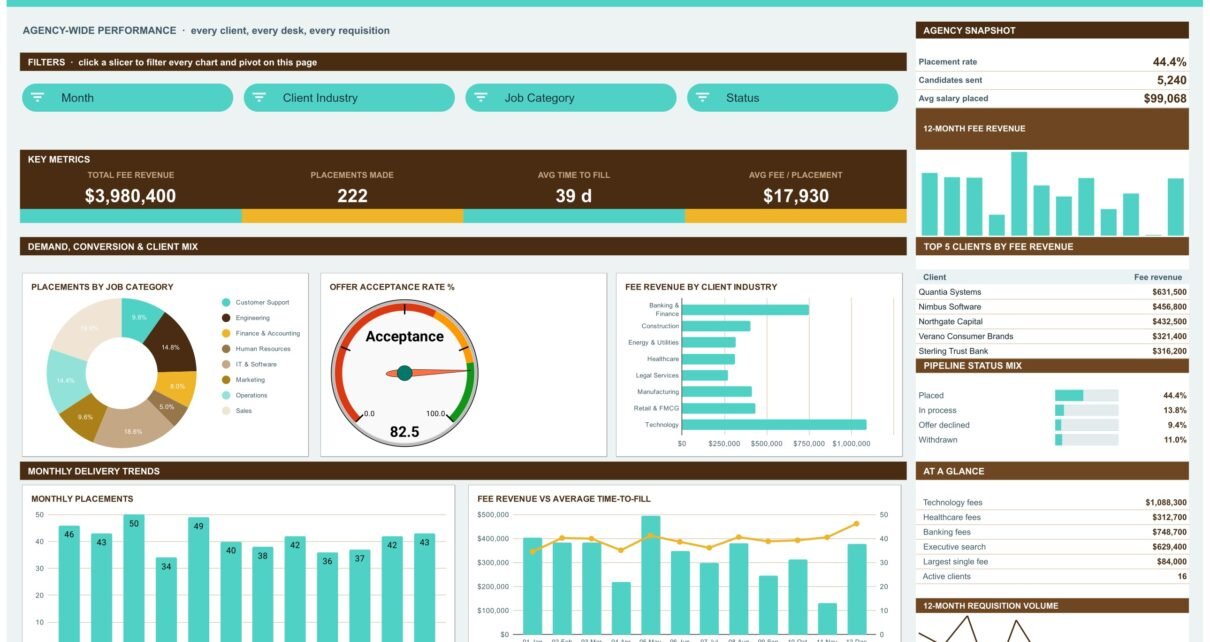
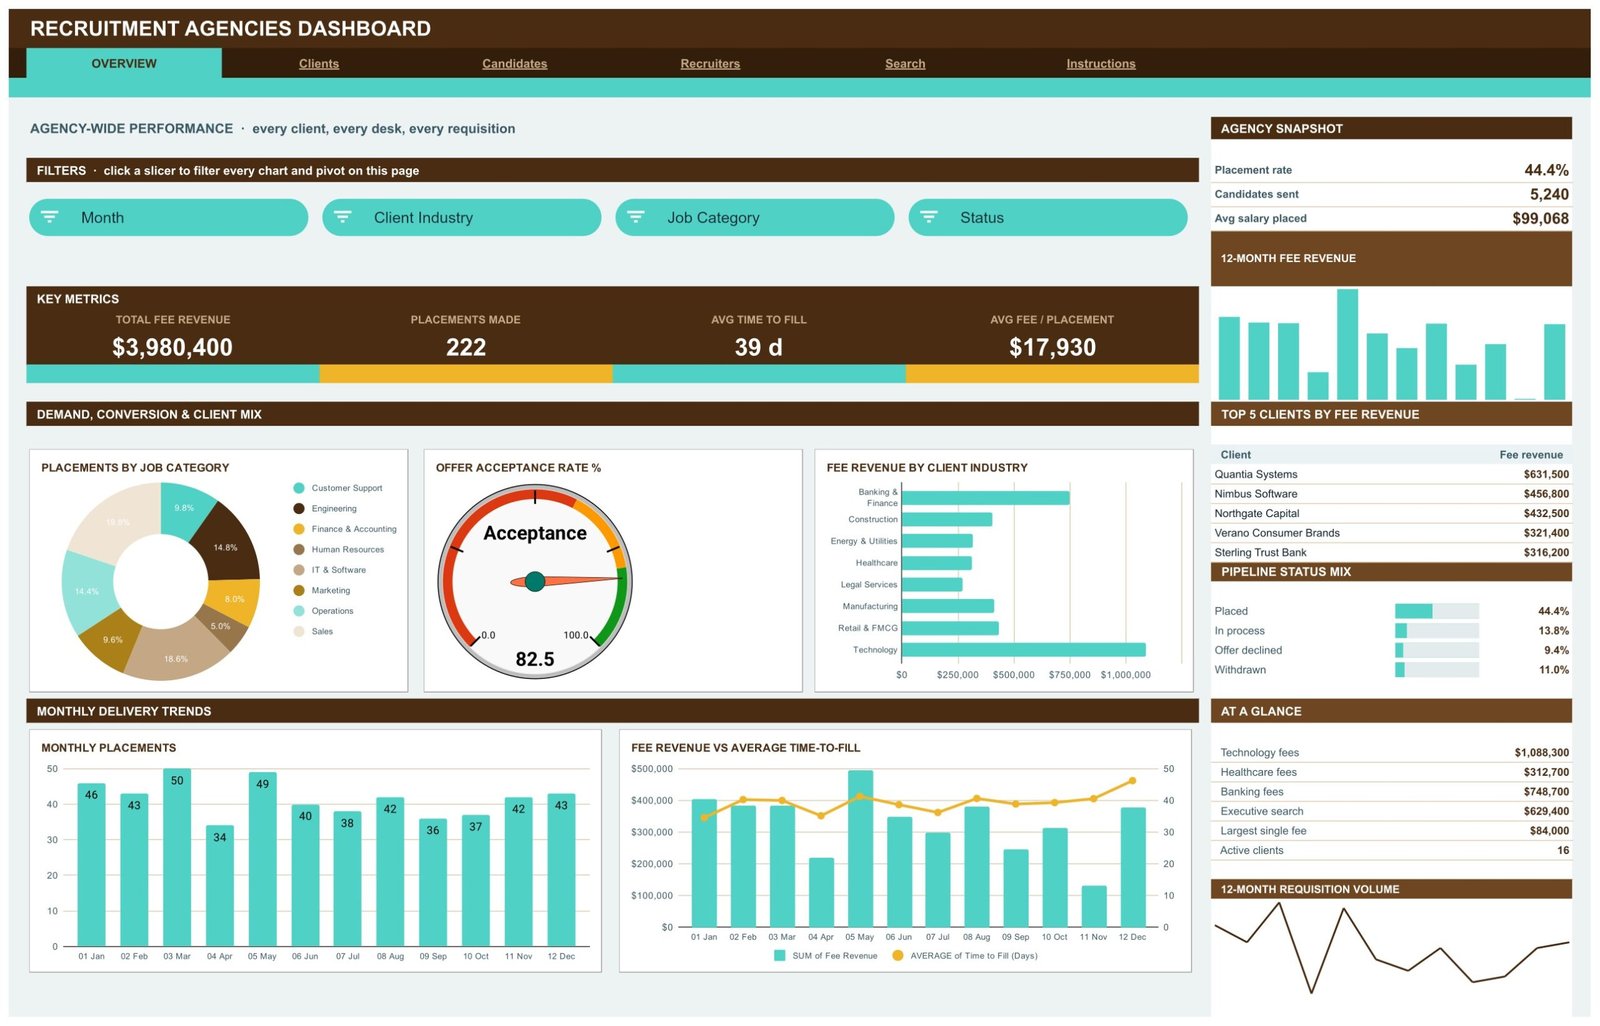
The Recruitment Agencies Dashboard in Google Sheets turns a flat placement log into a six-tab reporting pack: 16 KPI cards, 18 charts and 15 slicers, every one of them driven by a native Google Sheets pivot table. The demo agency it ships with runs 500 requisitions, $3,980,400 of fee revenue, 222 placements, a 39-day average time-to-fill and 5,240 candidate submissions across 10 recruiter desks.
Most agencies already keep that log somewhere — a spreadsheet, a CSV export, a report nobody reads. What they usually do not have is a monthly view of which desk bills the most, which industry actually pays, and how many submissions it takes to make one placement. This recruitment agency dashboard template answers those three questions the moment you paste your data in, without an ATS subscription and without writing a single formula.
Get the Recruitment Agencies Dashboard in Google Sheets
Key Features of the Recruitment Agencies Dashboard in Google Sheets
- Four analysis pages over one Data sheet. Overview, Clients, Candidates and Recruiters all read the same 500-row requisition log, so one paste updates everything.
- Native pivot tables and slicers. Each chart reads a pivot parked to the right of its page — no helper columns, no volatile array formulas, so the file stays fast as the log grows.
- 15 slicers across the four pages. Month, Client Industry, Job Category, Status, Contract Type, Seniority and Recruiter. Clicking one refilters every chart, pivot and Top 5 panel on that page together.
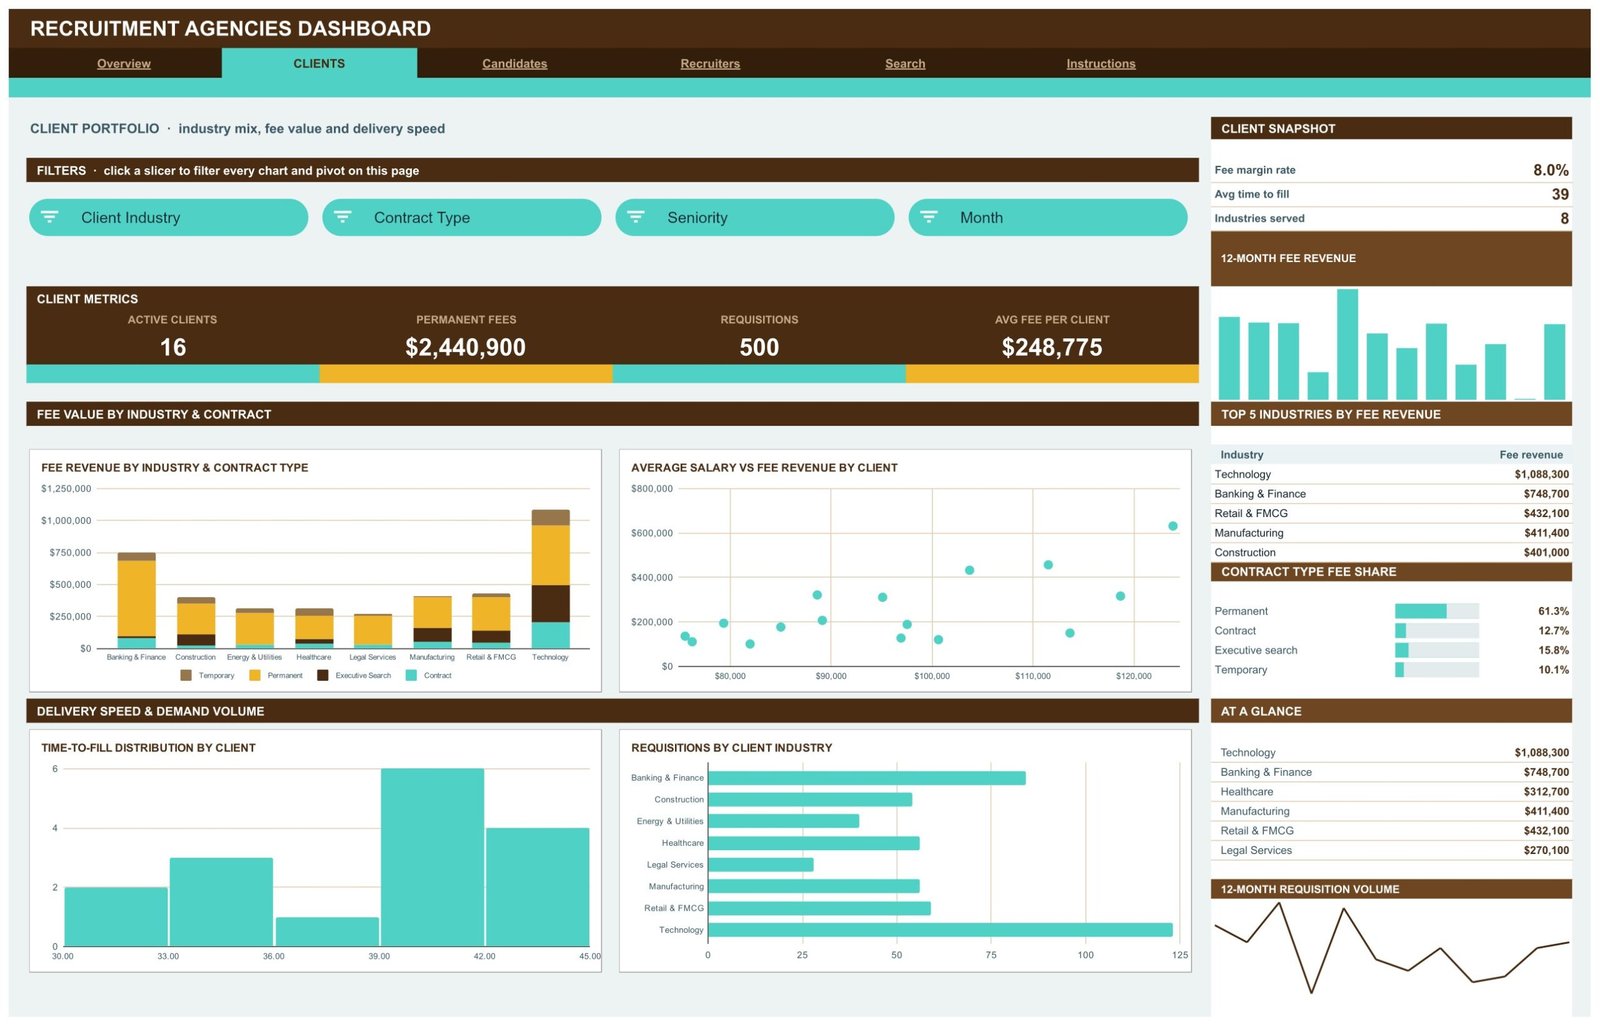
- Fee revenue split four ways. By client industry, by contract type (Permanent 61.3%, Executive search 15.8%, Contract 12.7%, Temporary 10.1%), by job category and by recruiter.
- Speed and conversion metrics. 39-day average time-to-fill, 7-day fastest fill, 123-day slowest, 23.6 submissions per placement, a 44.4% placement rate and an offer-acceptance gauge at 82.5.
- A record-level Search tab that returns all 16 fields for any single Placement ID.
- 1,000-row capacity out of the box. Pivots, slicers and formulas already cover row 1001, so pasting new requisitions needs no range editing.
Dashboard Pages Explanation
Page 1: Overview — Agency-Wide Performance
The Overview page reports Total Fee Revenue, Placements Made, Avg Time to Fill and Avg Fee / Placement, with a filter strip carrying Month, Client Industry, Job Category and Status. Its charts are Placements by Job Category, Offer Acceptance Rate %, Fee Revenue by Client Industry, Monthly Placements, and Fee Revenue vs Average Time-to-Fill. The right-hand rail adds an Agency Snapshot, a 12-Month Fee Revenue mini chart, a Top 5 Clients by Fee Revenue table, a Pipeline Status Mix panel and an At a Glance list.
Page 2: Clients — Portfolio, Industry Mix and Fee Value
The Clients page reports Active Clients, Permanent Fees, Requisitions and Avg Fee per Client, filtered by Client Industry, Contract Type, Seniority and Month. Charts include Fee Revenue by Industry and Contract Type, Average Salary vs Fee Revenue by Client, Time-to-Fill Distribution by Client, and Requisitions by Client Industry. A Top 5 Industries by Fee Revenue table and a Contract Type Fee Share panel sit alongside them.
Page 3: Candidates — Sourcing Channels and Salary Benchmarks
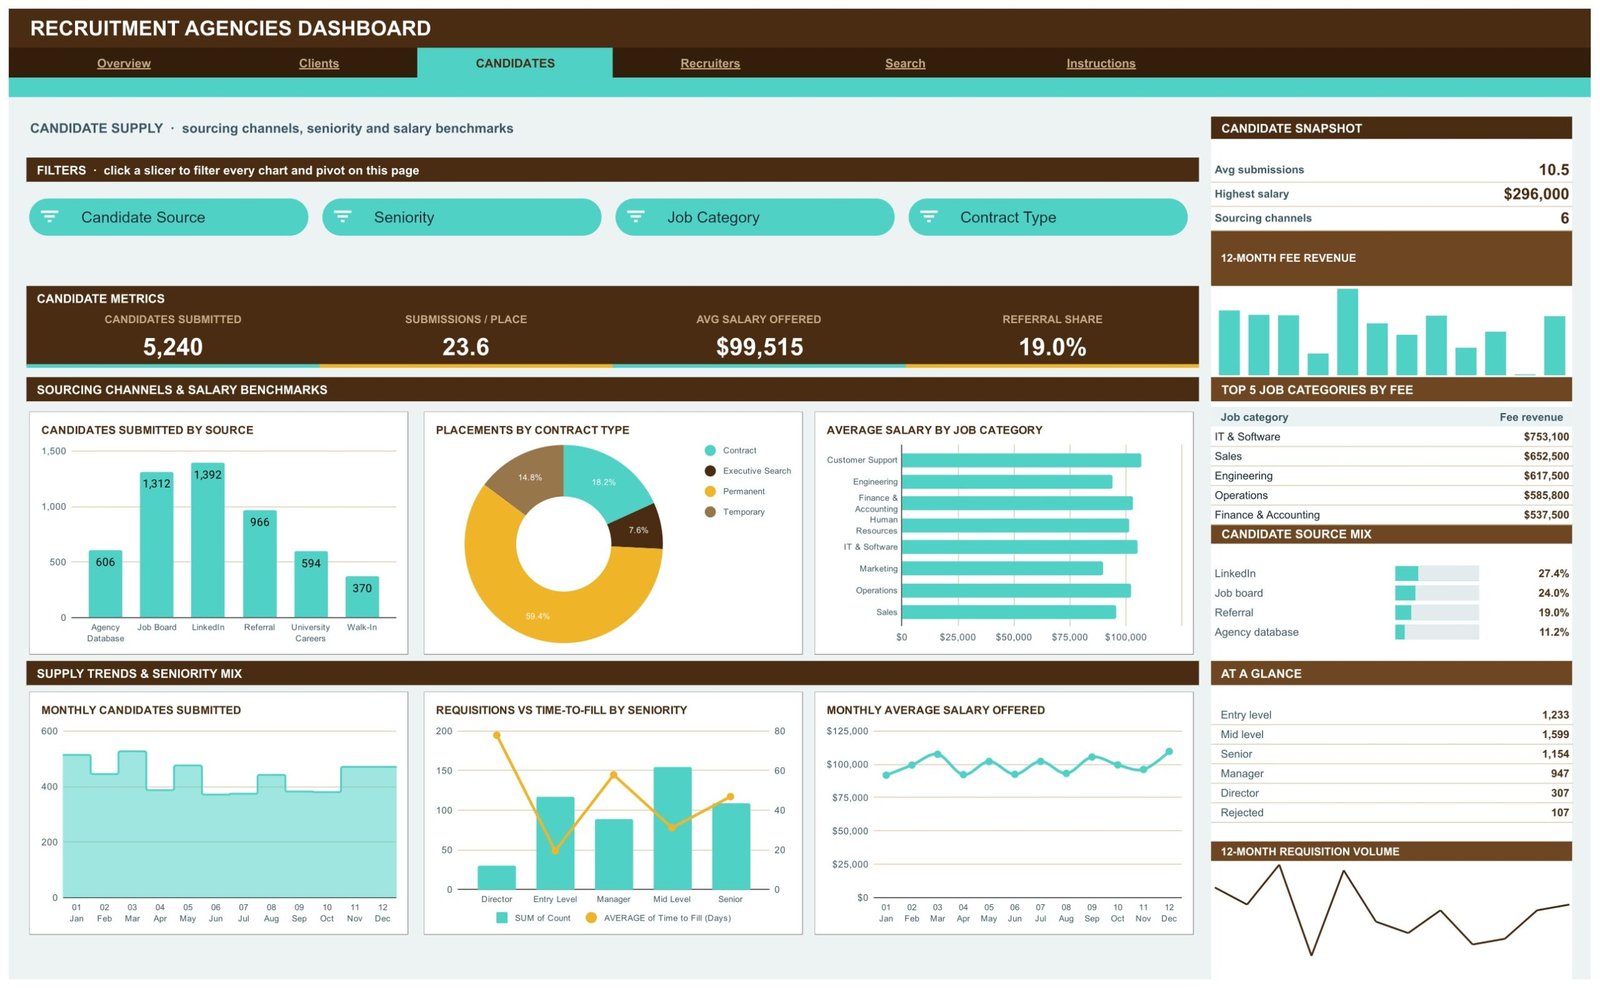
The Candidates page reports Candidates Submitted, Submissions / Place, Avg Salary Offered and Referral Share. Charts include Candidates Submitted by Source, Placements by Contract Type, Average Salary by Job Category, Monthly Candidates Submitted, Requisitions vs Time-to-Fill by Seniority, and Monthly Average Salary Offered. The Candidate Source Mix panel ranks LinkedIn, job boards, referrals and the agency database, and the At a Glance list splits the pool by seniority.
Page 4: Recruiters — Desk Billings, Speed and Pipeline Quality
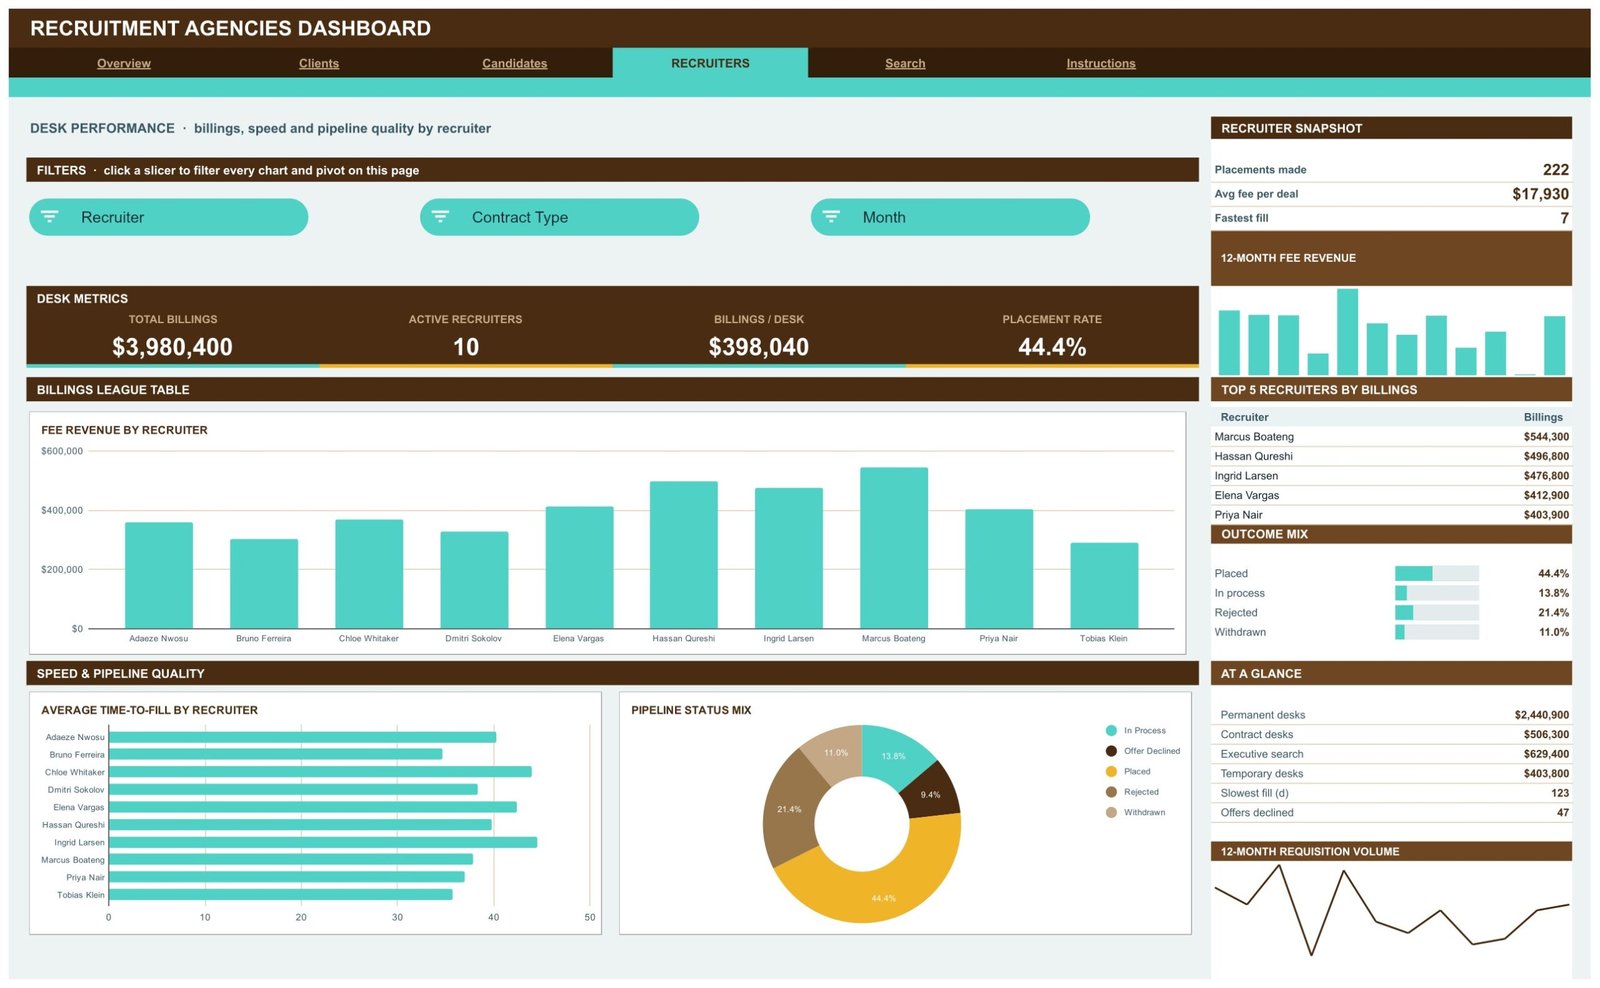
The Recruiters page reports Total Billings, Active Recruiters, Billings / Desk and Placement Rate, filtered by Recruiter, Contract Type and Month. Charts include Fee Revenue by Recruiter, Average Time-to-Fill by Recruiter and Pipeline Status Mix, beside a Top 5 Recruiters by Billings league table, an Outcome Mix panel and an At a Glance list splitting permanent, contract, executive-search and temporary desks.
Page 5: Search — Placement Record Lookup
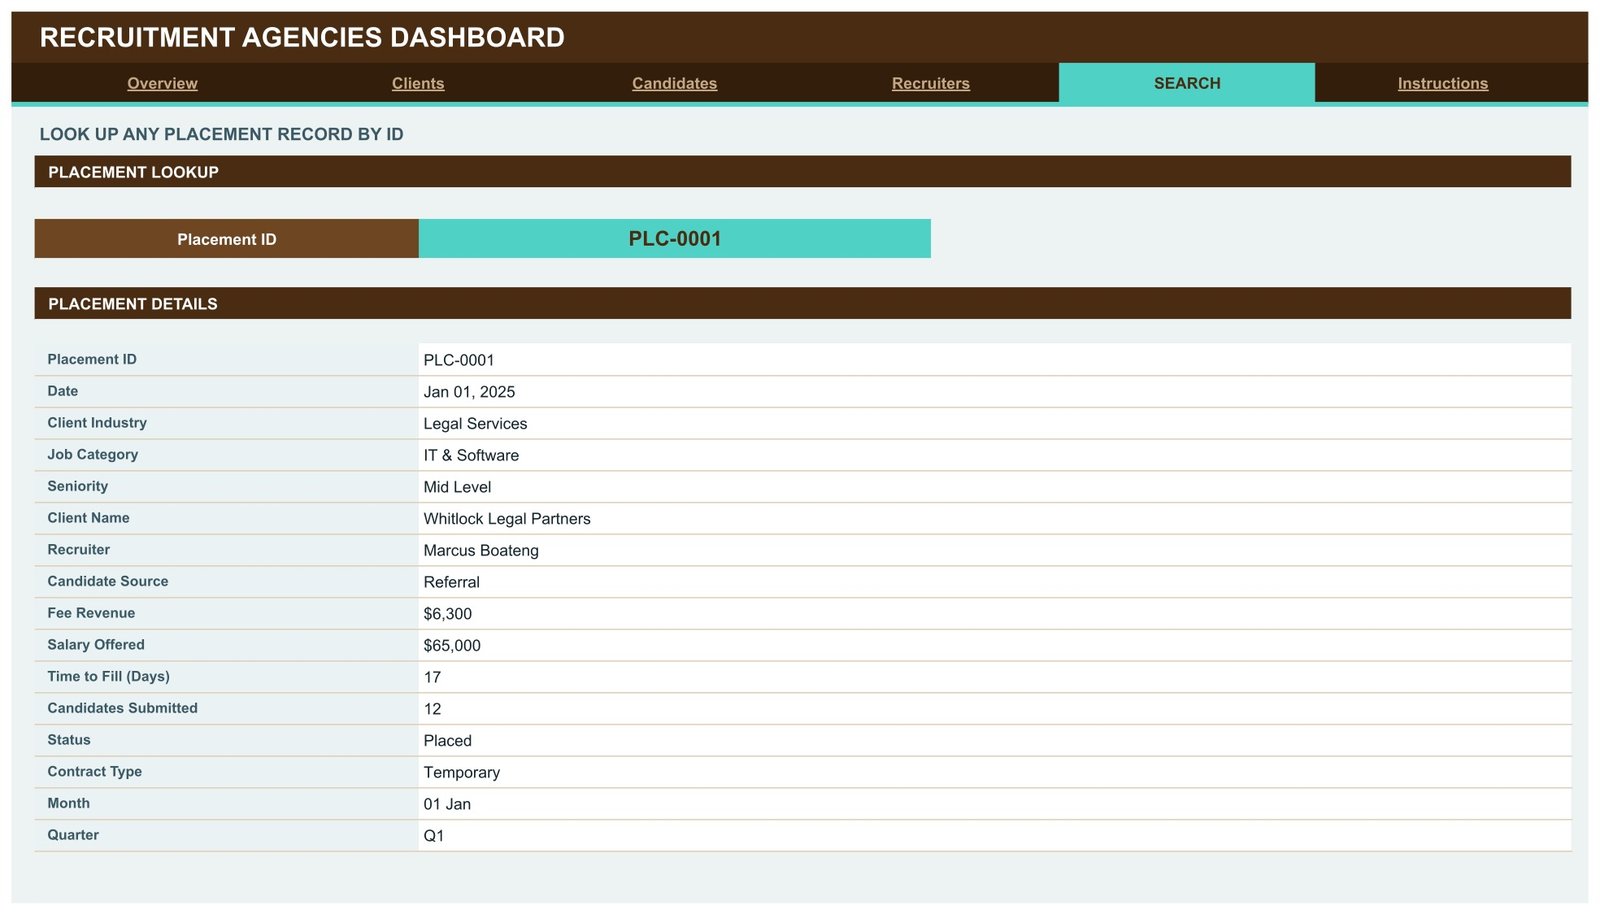
The Search page takes a Placement ID and returns the whole record: date, client industry, job category, seniority, client name, recruiter, candidate source, fee revenue, salary offered, time to fill, candidates submitted, status, contract type, month and quarter. It is the tab you open when a client questions one specific invoice.
Page 6: Instructions — the Built-In User Guide
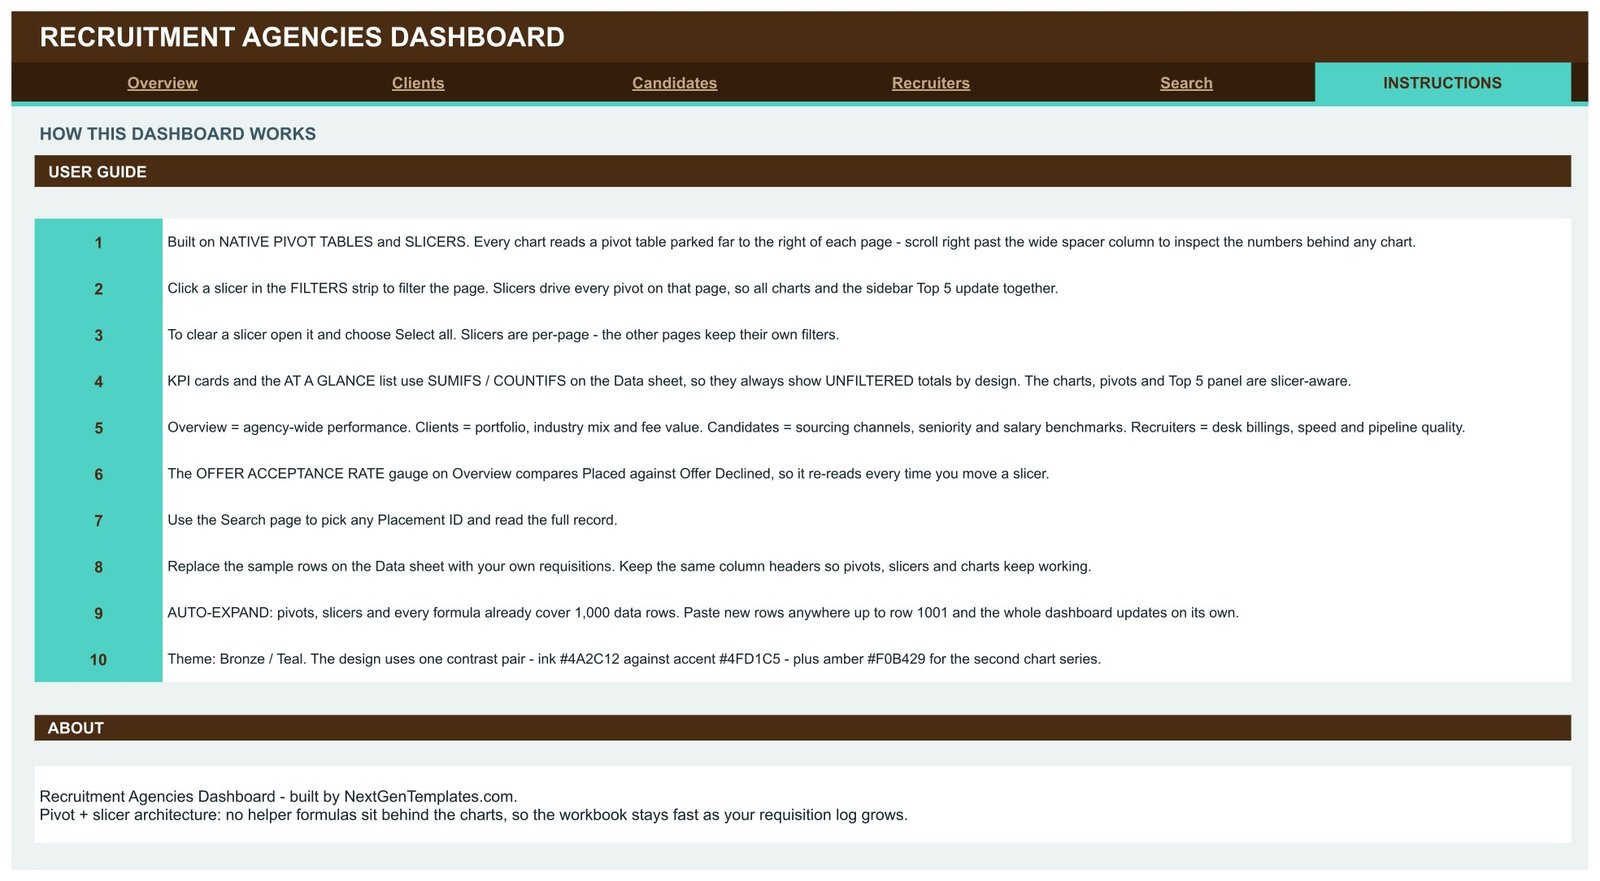
A 10-step guide explains the pivot-and-slicer architecture, how to clear a slicer with Select all, why the KPI cards use SUMIFS and COUNTIFS and therefore stay unfiltered by design, and how the 1,000-row auto-expand works. If you want to understand the mechanics behind it, Google’s own documentation on pivot tables in Google Sheets covers the same ground.
The Data Sheet
Behind the six visible tabs sits the Data sheet: 500 sample requisitions across 16 columns — Placement ID, Date, Client Industry, Job Category, Seniority, Client Name, Recruiter, Candidate Source, Fee Revenue, Salary Offered, Time to Fill (Days), Candidates Submitted, Status, Contract Type, Month and Quarter. Every name and figure in it is demo data. Delete the rows, keep the headers, paste your own.
Recruitment Agencies Dashboard in Google Sheets vs. Microsoft Excel Dashboard vs. Bullhorn / JobAdder / Vincere — Feature Comparison
| Feature | Recruitment Agencies Dashboard in Google Sheets | Excel dashboard edition | Bullhorn / JobAdder / Vincere |
|---|---|---|---|
| Cost | $9.99 one-time ✅ | $13.99 one-time | $99-$150 / user / month |
| Platform | Google Sheets, browser only ✅ | Microsoft Excel desktop | Vendor cloud, login required |
| Setup time | Under 10 minutes ✅ | Under 10 minutes | 2-6 weeks onboarding |
| Real-time team collaboration | Built in, multi-user ✅ | Only via OneDrive co-authoring | Built in |
| Mobile access | Google Sheets app ✅ | Excel mobile, limited slicers | Native apps |
| Customisable fields and charts | Every pivot and chart editable ✅ | Fully editable | Locked to vendor schema |
| Share with a link | Yes, view or edit ✅ | File must be sent or synced | Seat required per viewer |
| Year-1 cost at 5 users | $9.99 total ✅ | $13.99 total | $5,940-$9,000 |
| Recruiter league table and fee split | Included ✅ | Included | Included, reporting tier only |
For agencies that want desk-level billing visibility without paying per-seat ATS fees, the Recruitment Agencies Dashboard in Google Sheets sits in the sweet spot.
Who Should Use This Template
Perfect for:
- Recruitment and staffing agency owners running 3-30 desks who need a monthly billing and pipeline review
- Team leads who report placements, time-to-fill and fee revenue to a board, an investor or a client
- Independent recruiters and boutique search firms who already log requisitions in a spreadsheet
- In-house talent acquisition teams that want agency-style desk reporting without another HR system
Not a fit if:
- You need a live applicant tracking system — this reports on placements, it does not parse CVs, post jobs or store candidate records
- You need SSO, audit trails or SOC 2 controls over candidate personal data
- You want contractor timesheets, invoicing or payroll automation
- You log more than 1,000 requisitions per period and do not want to extend the pivot ranges
Real-World Use Cases
Priya runs a 10-desk technology recruitment agency in Manchester. Her Monday routine is the Recruiters page: the billings league table shows who is ahead, the Average Time-to-Fill by Recruiter chart shows who is slow, and the Outcome Mix panel shows whose pipeline is full of withdrawals rather than placements. That conversation used to need a report export and half a day.
Daniel owns a boutique executive search firm with four consultants. He works from the Clients page, where Fee Revenue by Industry and Contract Type shows that Technology and Banking & Finance carry his year. Filtering Contract Type to Executive search tells him how much of that revenue is retained search rather than permanent placement — which is the number his business-development plan actually depends on.
Amara leads talent acquisition at a mid-size services group. She uses the Candidates page to compare LinkedIn, job boards, referrals, university careers and walk-ins on both volume and average salary offered, then takes the Candidate Source Mix panel into her quarterly cost-per-hire review. Because it is a Google Sheet, she shares a view-only link with finance instead of emailing a file.
Advantages of the Recruitment Agencies Dashboard
The obvious advantage is cost: $9.99 once against $99-$150 per user per month for an ATS reporting tier. For a five-recruiter agency that is a year-one difference of roughly $5,900. But the practical advantage is time. Because the charts sit on native pivot tables rather than helper formulas, there is nothing to rebuild when your data changes shape — you paste, you refresh, you read.
The second advantage is that it is a Google Sheet. Two recruiters can be in it at once, a director can open it on a phone, and a client can be given a view-only link with no licence. The Staffing Agency Dashboard in Google Sheets and the Temp Staffing Dashboard in Google Sheets follow the same principle for different desks.
Opportunities for Improvement
Being honest about the limits: this is a reporting layer, not a system of record. It does not store candidate documents, send emails or manage a workflow — if that is what you need, the Recruitment Applicant Tracking System Web App is the right tool instead.
The KPI cards and the At a Glance lists are built on SUMIFS and COUNTIFS against the whole Data sheet, so they deliberately show unfiltered totals even when a slicer is active — the Instructions tab says so, but it surprises people the first time. The pivots and charts are the slicer-aware part. And the 1,000-row ceiling is a design choice for speed; heavy desks will need to extend the pivot ranges once, which takes about a minute.
Best Practices
- Keep the 16 column headers exactly as they ship. Every pivot, slicer and formula resolves by header name.
- Paste values, not formatted cells, when importing from an ATS export — formatting can break the number columns.
- Use one row per requisition, not per interview stage, or the placement rate and submissions-per-placement figures will drift.
- Clear a slicer with Select all rather than deleting it; Google Sheets slicers are per-page and the other tabs keep their own filters.
- Take a copy of the file at month end so you keep a frozen version of what you reported.
Explore Relevant Templates
- Recruitment & Talent Acquisition Bundle — seven premium Excel and Google Sheets templates covering the whole desk, at a 37% saving.
- Staffing Agency Dashboard in Google Sheets — a separate build weighted towards agency operations and temp desks rather than the client / candidate / recruiter split used here.
- Recruitment Funnel KPI Dashboard in Google Sheets — a month-picker KPI scorecard for the hiring funnel, complementary to this analytical dashboard.
- HR Google Sheets Pack — ten HR templates in Google Sheets, if recruitment is one part of a wider people function.
Also available as: Recruitment Agencies Dashboard in Excel and Recruitment Agencies Dashboard in Power BI — the same topic built for those platforms.
Curious how pivot tables and slicers like these are built? The Excel Pivot Tables & Dashboards course on NextGenTemplates Academy teaches the same ideas with practice files.
Get the Recruitment Agencies Dashboard in Google Sheets
Frequently Asked Questions
What KPIs does the Recruitment Agencies Dashboard track?
The Recruitment Agencies Dashboard in Google Sheets tracks 16 KPI cards across four pages: fee revenue, placements made, average time to fill, average fee per placement, active clients, permanent fees, requisitions, average fee per client, candidates submitted, submissions per placement, average salary offered, referral share, total billings, active recruiters, billings per desk and placement rate.
How long does setup take?
Under 10 minutes. Open the PDF in your download, click the “Make a copy” link to create your own Google Sheets copy, then paste your requisition log over the 500 sample rows keeping the same 16 headers. Every chart, pivot and KPI card in the Recruitment Agencies Dashboard redraws itself.
How does this compare to an ATS like Bullhorn or JobAdder?
An ATS manages candidates, jobs and workflow and costs roughly $99-$150 per user per month. The Recruitment Agencies Dashboard is a one-time $9.99 reporting layer over your placement log. It will not replace an ATS, but it gives a small agency board-level billing and pipeline reporting for a fraction of a single month of seats.
Can I add my own recruiters, clients and job categories?
Yes. Every slicer, pivot and chart in the Recruitment Agencies Dashboard reads the Data sheet, so new recruiter names, client industries, job categories, seniority levels or contract types appear automatically once the pivots refresh. No formulas need editing.
Does it work on mobile, and can I share it with clients?
Yes. The Recruitment Agencies Dashboard in Google Sheets runs entirely in Google Sheets, so it opens in the Google Sheets mobile app and can be shared as a view-only link with clients or directors — no seat licence, no extra software.
How much data can it hold?
It ships with 500 sample requisitions and its pivots, slicers and formulas already cover 1,000 rows. Paste new records anywhere up to row 1001 and the Recruitment Agencies Dashboard updates on its own. Beyond that, extend the pivot ranges once and it keeps working.
Are the numbers in the screenshots real?
No. Every client name, recruiter name and figure shown in the Recruitment Agencies Dashboard is demo data generated to illustrate the layout. Once you delete the sample rows, the dashboard reports only your own agency’s numbers.
About the Author
Built by PK — Microsoft Certified Professional with 15+ years of Excel, Google Sheets and Power BI experience. Founder of NextGenTemplates, reaching 300K+ subscribers across YouTube channels. Every template is hand-built and tested before release.
Conclusion
If your agency already keeps a placement log, the Recruitment Agencies Dashboard in Google Sheets is the fastest way to turn it into something a director will actually read: four analysis pages, a record lookup, a built-in guide, and a fee-revenue story split by client, candidate source and recruiter desk.
Instant download · One-time payment · No subscription
Last updated: August 2026