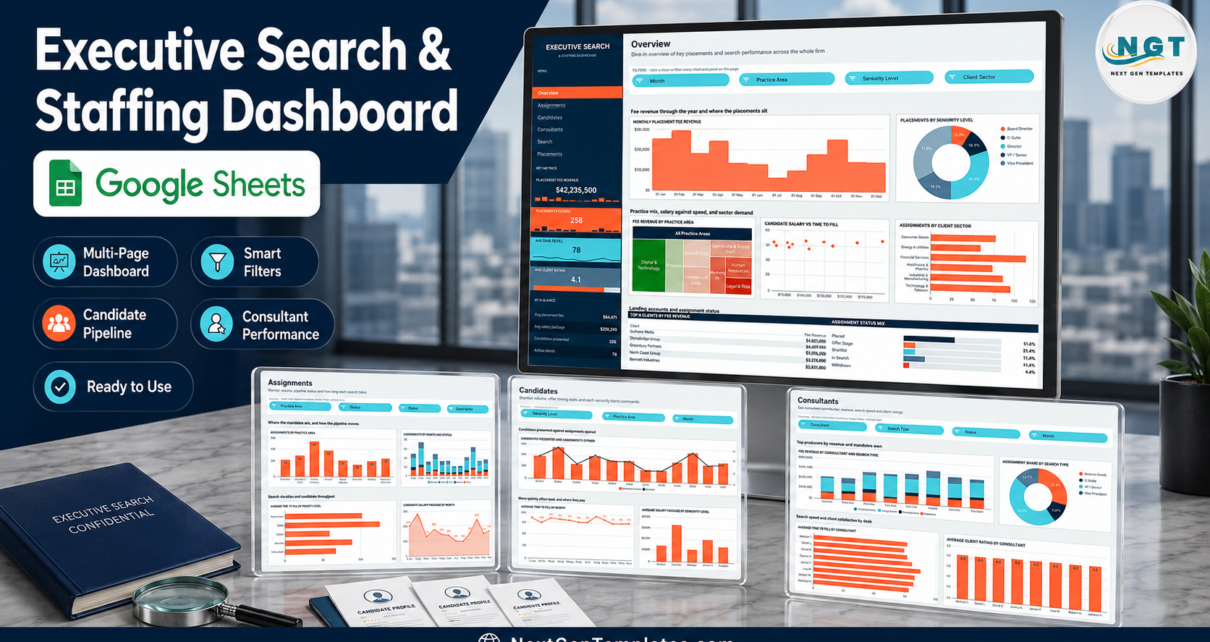
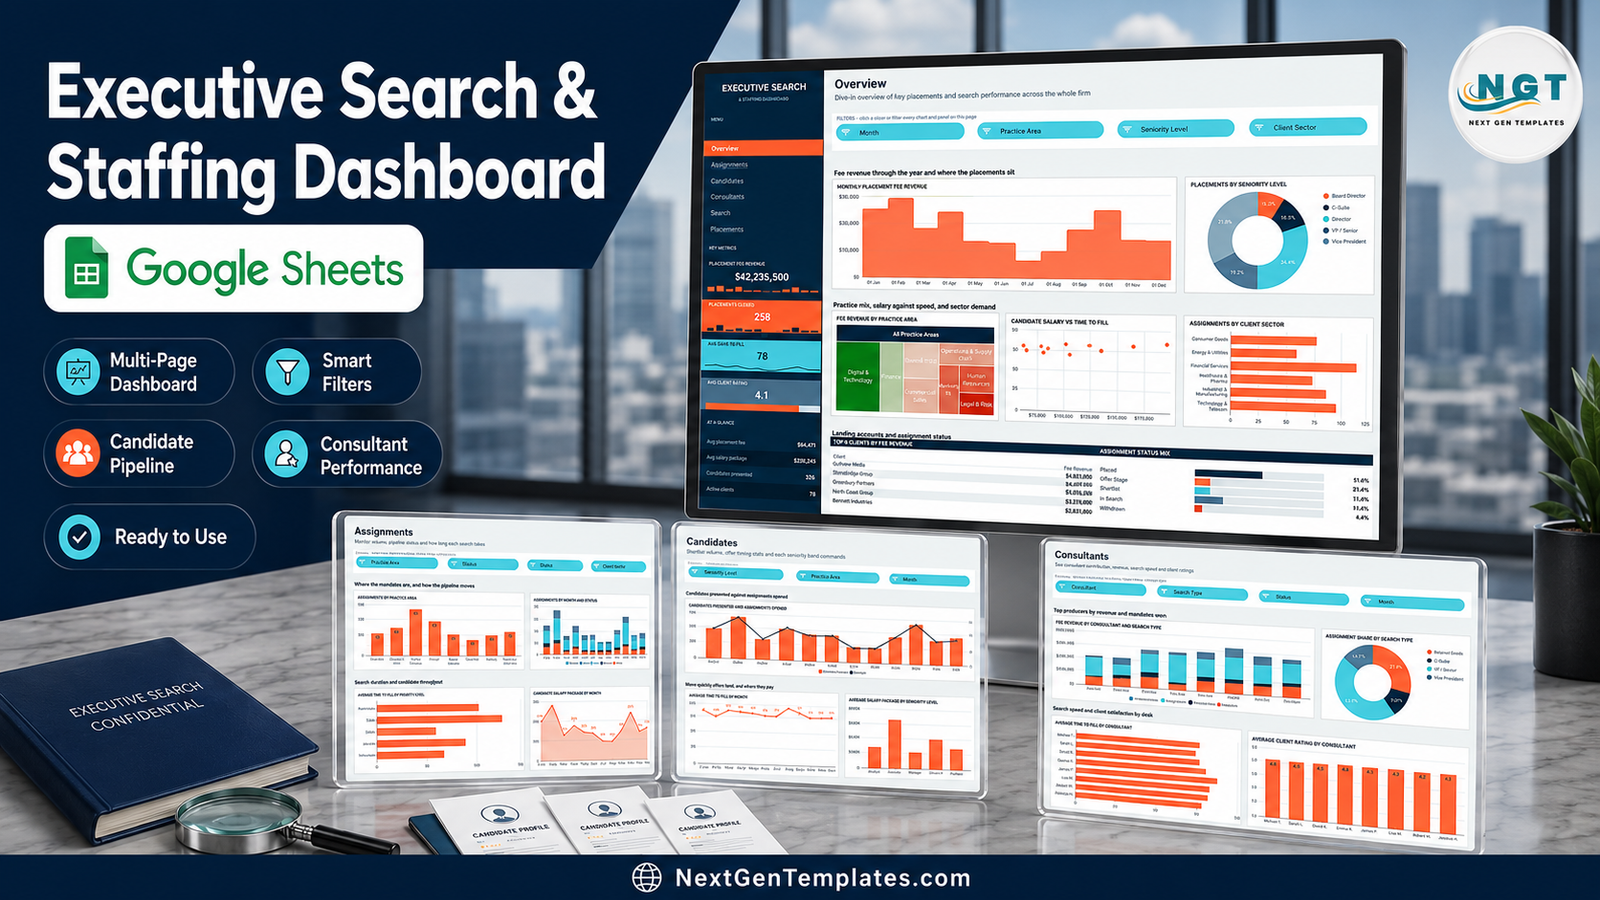
The Executive Search & Staffing Dashboard in Google Sheets is a six-tab reporting workbook that takes a flat list of search mandates and turns it into a partner-level view of fee revenue, pipeline and desk performance. The sample file carries 500 search assignments covering 8 practice areas, 5 seniority levels, 4 search types, 6 client sectors and 8 named consultants – $42,235,500 of placement fee revenue, 258 placements made, an average of 78 days to fill and an average client rating of 4.1. Every chart is driven by a native Google Sheets pivot table and filtered by a native slicer – 15 slicers in total – so there is nothing to install and no helper column hiding behind a visual.
Worth saying plainly up front: this is a tracking and reporting tool. It charts the mandates and fees you enter. It does not source candidates, parse CVs, or offer recruitment, employment or legal advice, and nothing in this article does either.
Get the Executive Search & Staffing Dashboard in Google Sheets
Key Features of the Executive Search & Staffing Dashboard in Google Sheets
- Six linked tabs – Overview, Assignments, Candidates, Consultants, Search and Instructions, all reachable from a navy navigation rail that sits on every page.
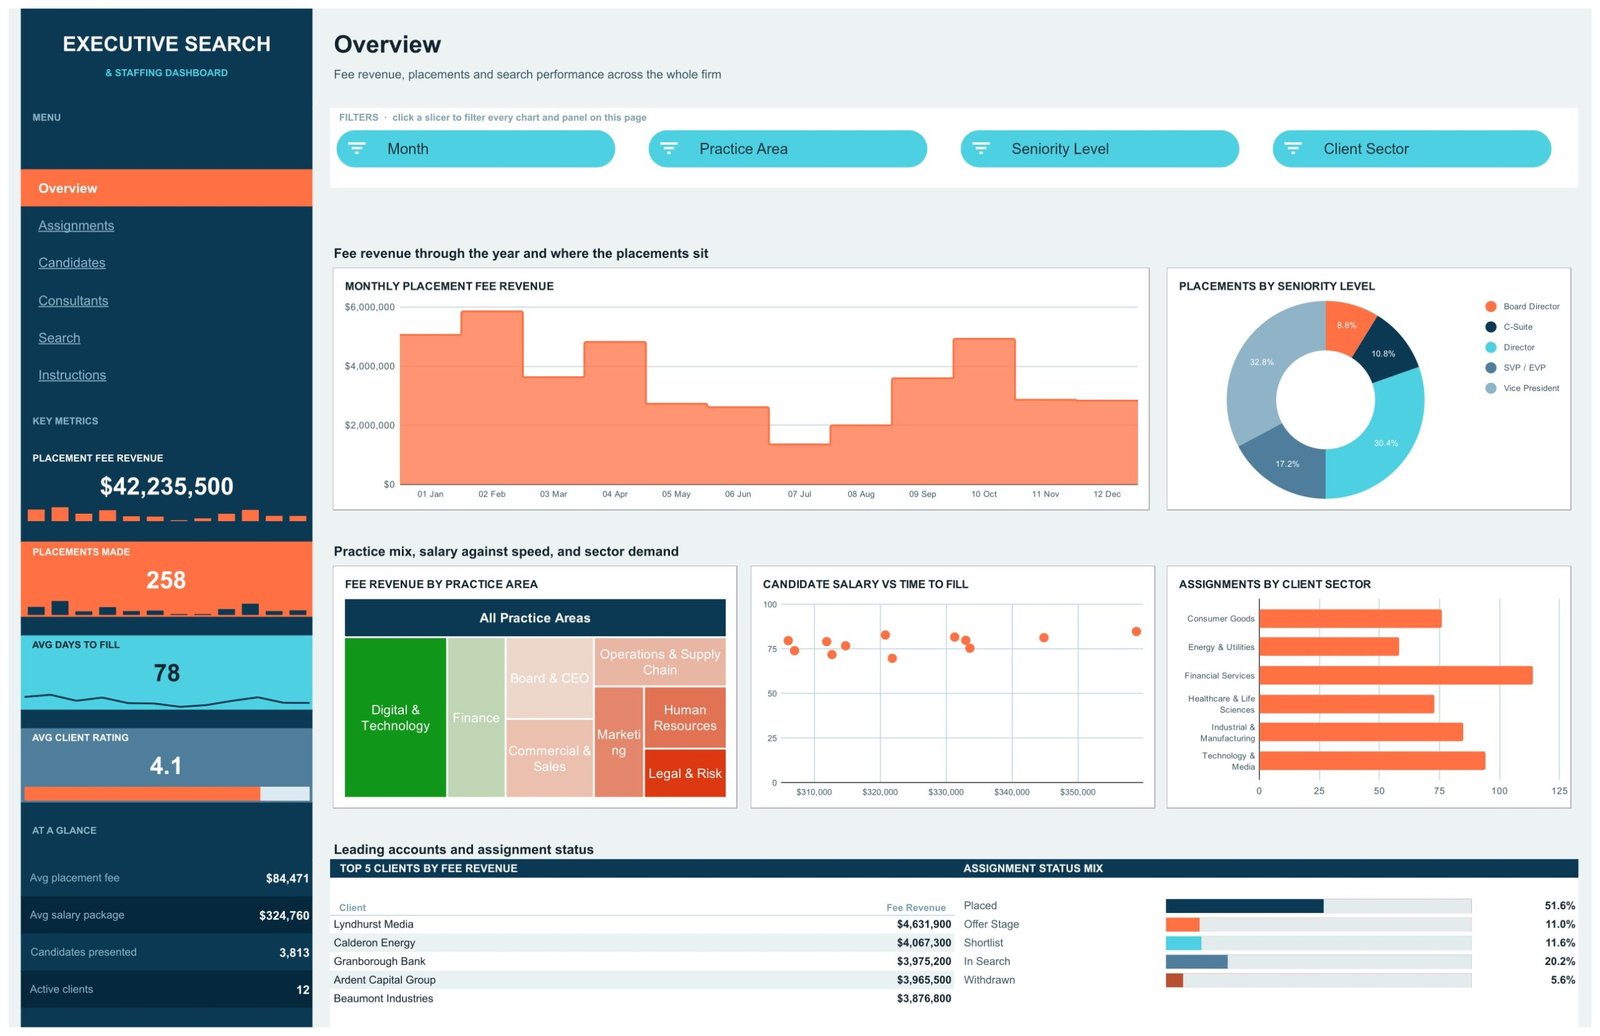
- Four KPI cards plus an At a Glance panel that travel with you: Placement Fee Revenue $42,235,500, Placements Made 258, Avg Days to Fill 78, Avg Client Rating 4.1, then avg placement fee $84,471, avg salary package $324,760, candidates presented 3,813 and 12 active clients.
- 15 native slicers – four each on Overview, Assignments and Consultants, three on Candidates. Slicers are page-scoped, so each tab keeps its own view of the search book.
- 16 charts across four analysis pages – stepped area, donut, treemap, scatter, stacked column, combo and bar, each fed by its own pivot.
- Four Top 5 ranking panels – clients, practice areas, seniority bands and consultants ranked by fee revenue, all re-ranking live as you filter.
- An assignment status mix strip repeated on four pages: Placed 51.6%, In Search 20.2%, Shortlist 11.6%, Offer Stage 11.0%, Withdrawn 5.6%.
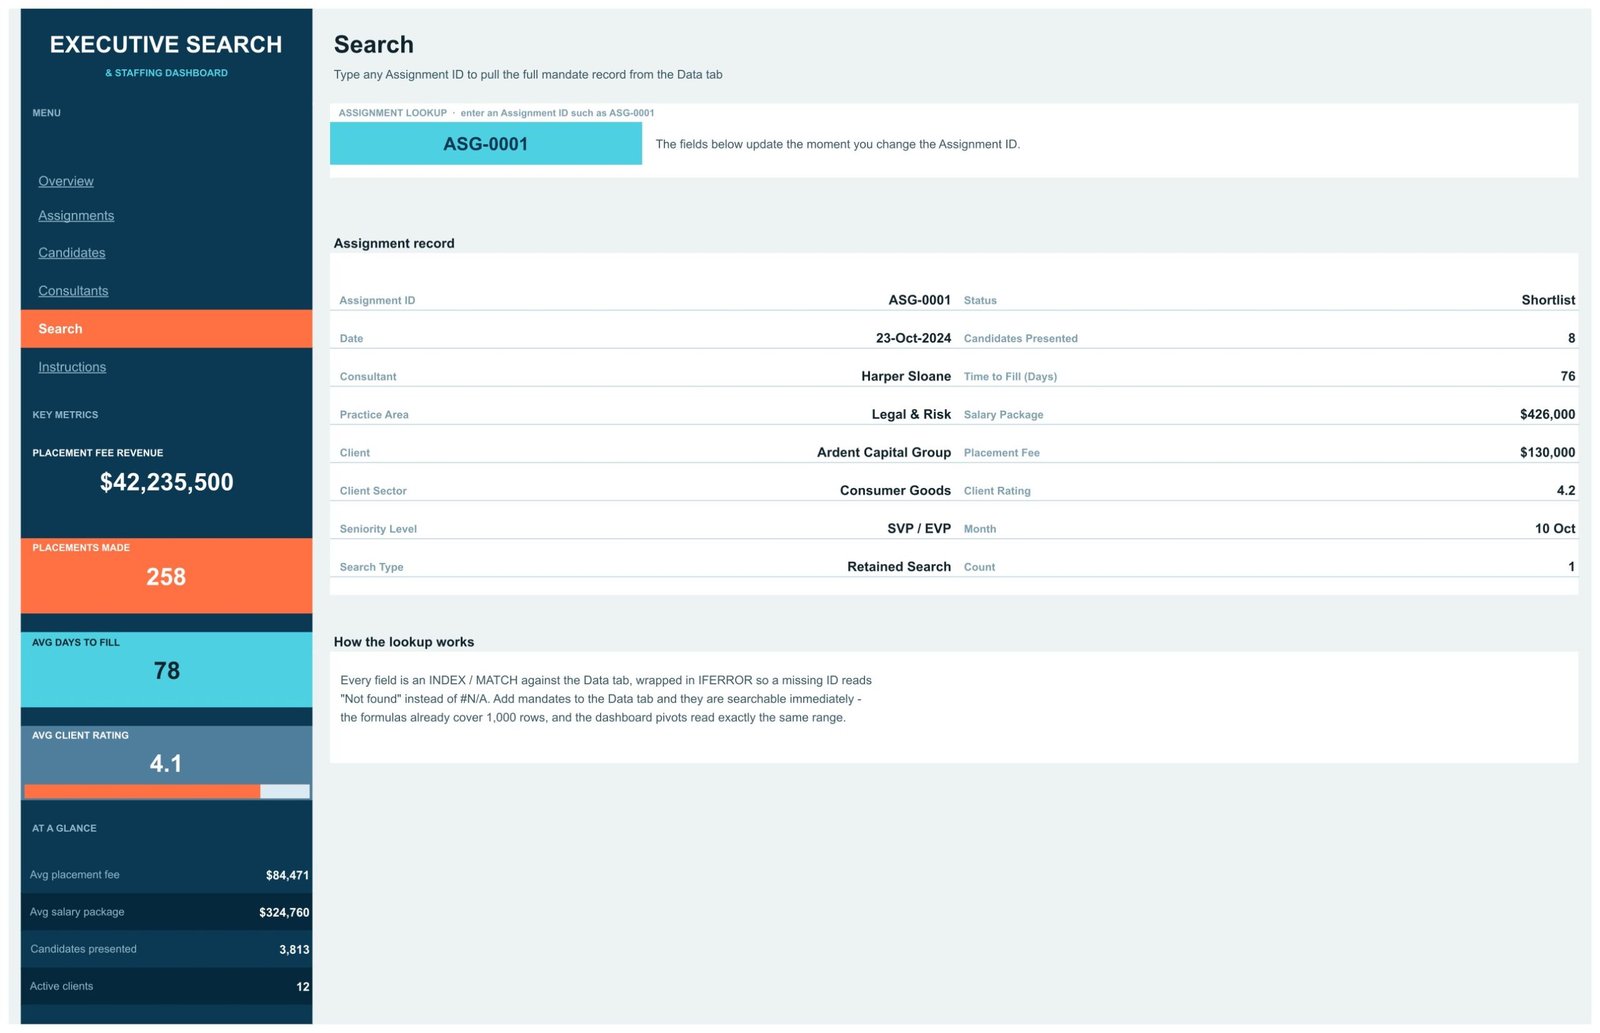
- A single-record Search page that pulls all 16 fields of any mandate from an Assignment ID.
- A 16-column Data tab with pivots pre-sized to A1:P1001 – room for 1,000 assignments before anything needs extending.
Dashboard Pages Explanation
Overview
The firm-wide page. Month, Practice Area, Seniority Level and Client Sector slicers sit in a white strip under the title and drive everything below. Monthly Placement Fee Revenue runs as a stepped area across twelve months, peaking near $5.8M in February and bottoming under $1.5M in July. Placements by Seniority Level is a donut – Vice President 32.8%, Director 30.4%, SVP / EVP 17.2%, C-Suite 10.8%, Board Director 8.8%. Fee Revenue by Practice Area is a treemap where Digital & Technology and Finance take the two largest blocks. Candidate Salary vs Time to Fill is a scatter that spreads mandates between roughly $310,000 and $355,000 of package. Assignments by Client Sector is a bar chart topped by Financial Services. Underneath, Top 5 Clients by Fee Revenue lists Lyndhurst Media $4,631,900, Calderon Energy $4,067,300, Granborough Bank $3,975,200, Ardent Capital Group $3,965,500 and Beaumont Industries $3,876,800.
Assignments
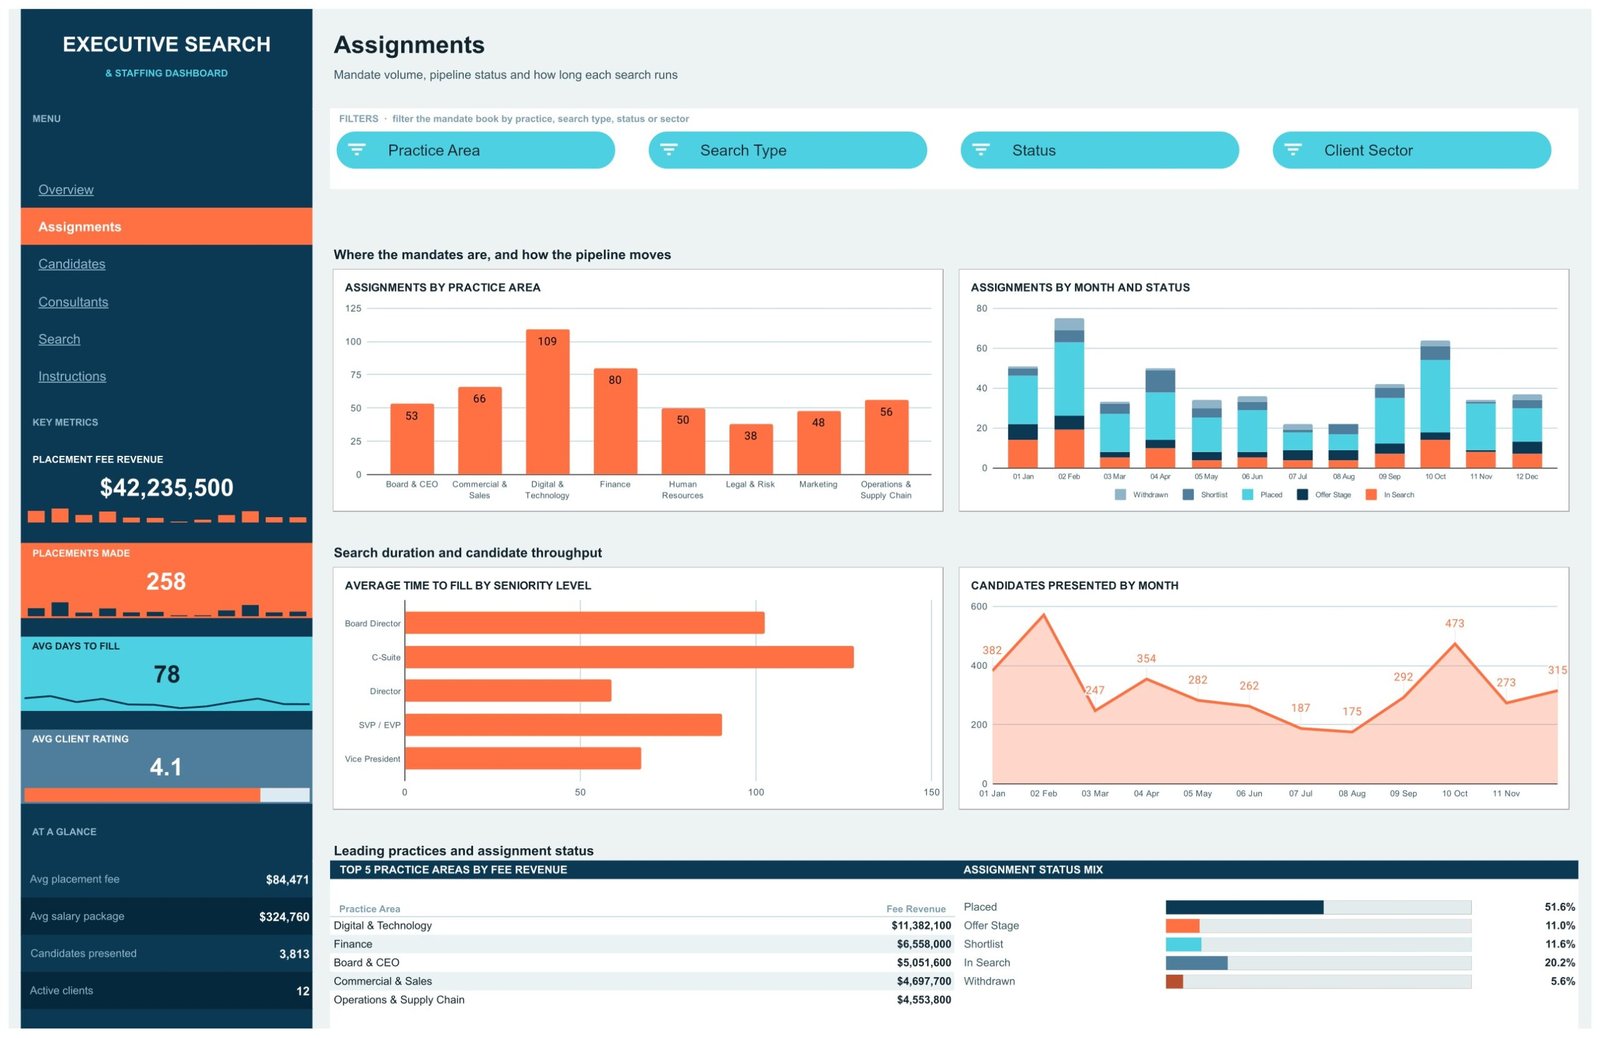
The mandate book, filtered by Practice Area, Search Type, Status and Client Sector. Assignments by Practice Area puts Digital & Technology at 109 mandates, Finance at 80, Commercial & Sales at 66, Operations & Supply Chain at 56, Board & CEO at 53, Human Resources at 50, Marketing at 48 and Legal & Risk at 38. Assignments by Month and Status stacks all five pipeline stages month by month. Average Time to Fill by Seniority Level shows C-Suite searches running longest at roughly 128 days against Director searches near 58. Candidates Presented by Month peaks at 473 in October and troughs at 175 in August. The ranking panel switches to Top 5 Practice Areas by Fee Revenue, led by Digital & Technology at $11,382,100.Executive Search & Staffing Dashboard in Google Sheets
Candidates
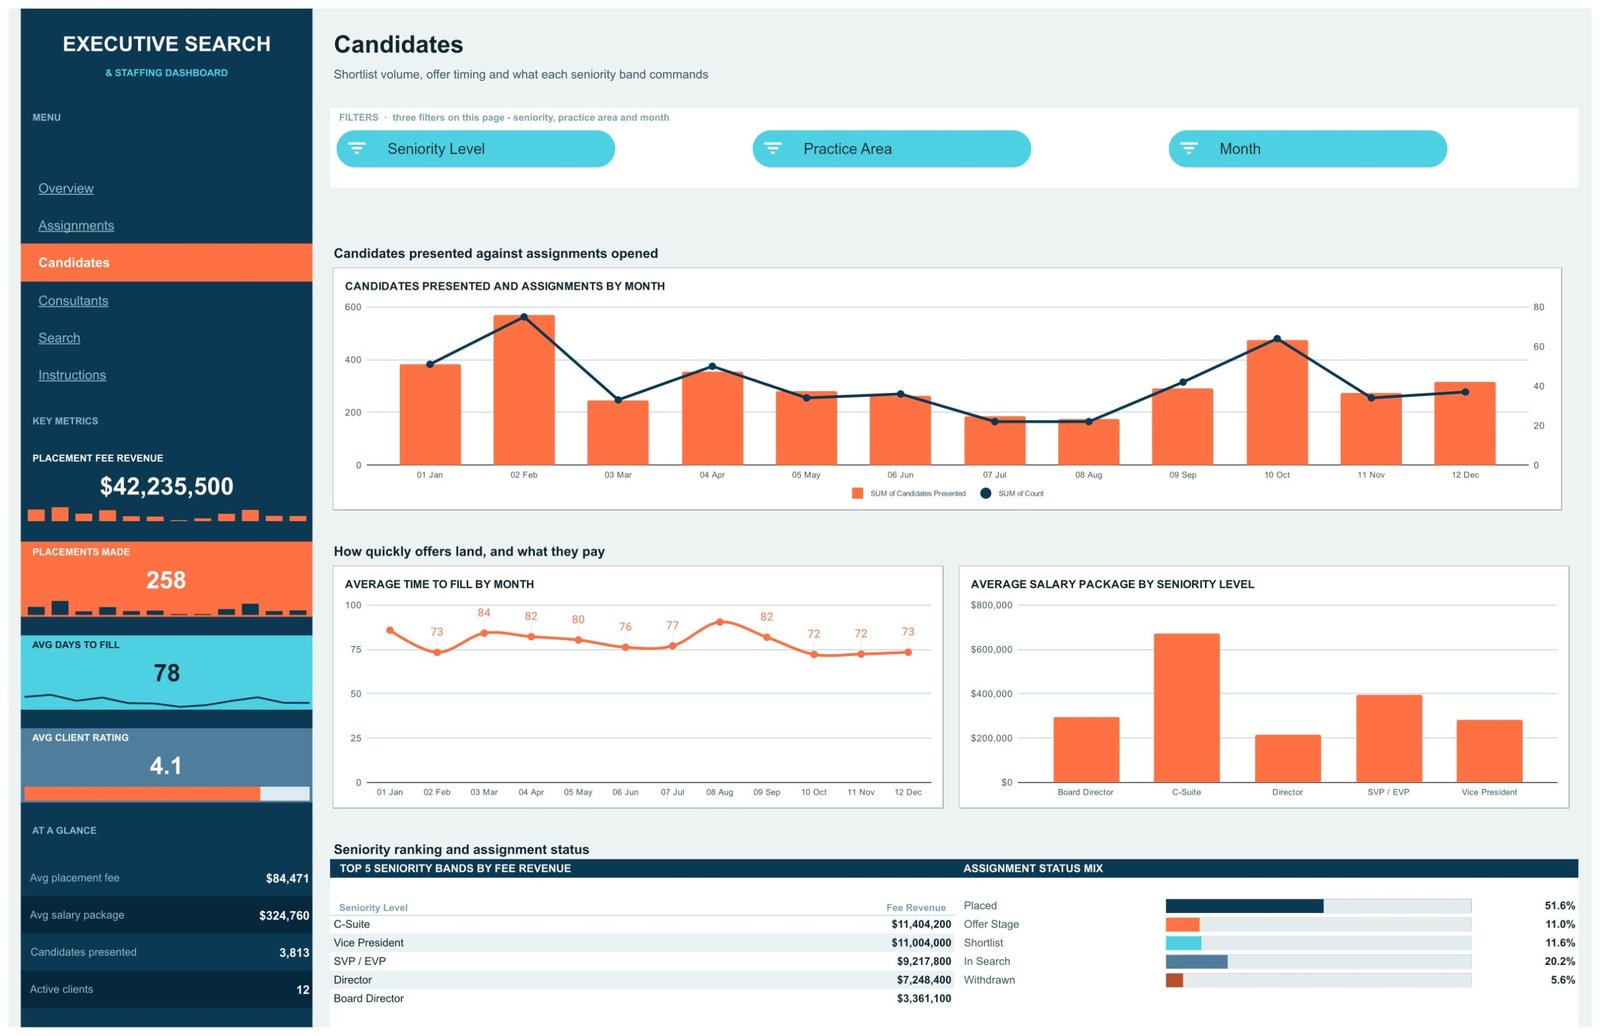
Shortlist volume against offer economics, with Seniority Level, Practice Area and Month slicers. Candidates Presented and Assignments by Month is a dual-axis combo – columns for candidates presented, a line for assignment count – so you can see whether shortlist volume is tracking mandate volume or running ahead of it. Average Time to Fill by Month holds a tight band between 72 and 84 days. Average Salary Package by Seniority Level puts C-Suite near $670,000, far above SVP / EVP at roughly $395,000. Top 5 Seniority Bands by Fee Revenue reads C-Suite $11,404,200, Vice President $11,004,000, SVP / EVP $9,217,800, Director $7,248,400 and Board Director $3,361,100.Executive Search & Staffing Dashboard in Google Sheets
Consultants
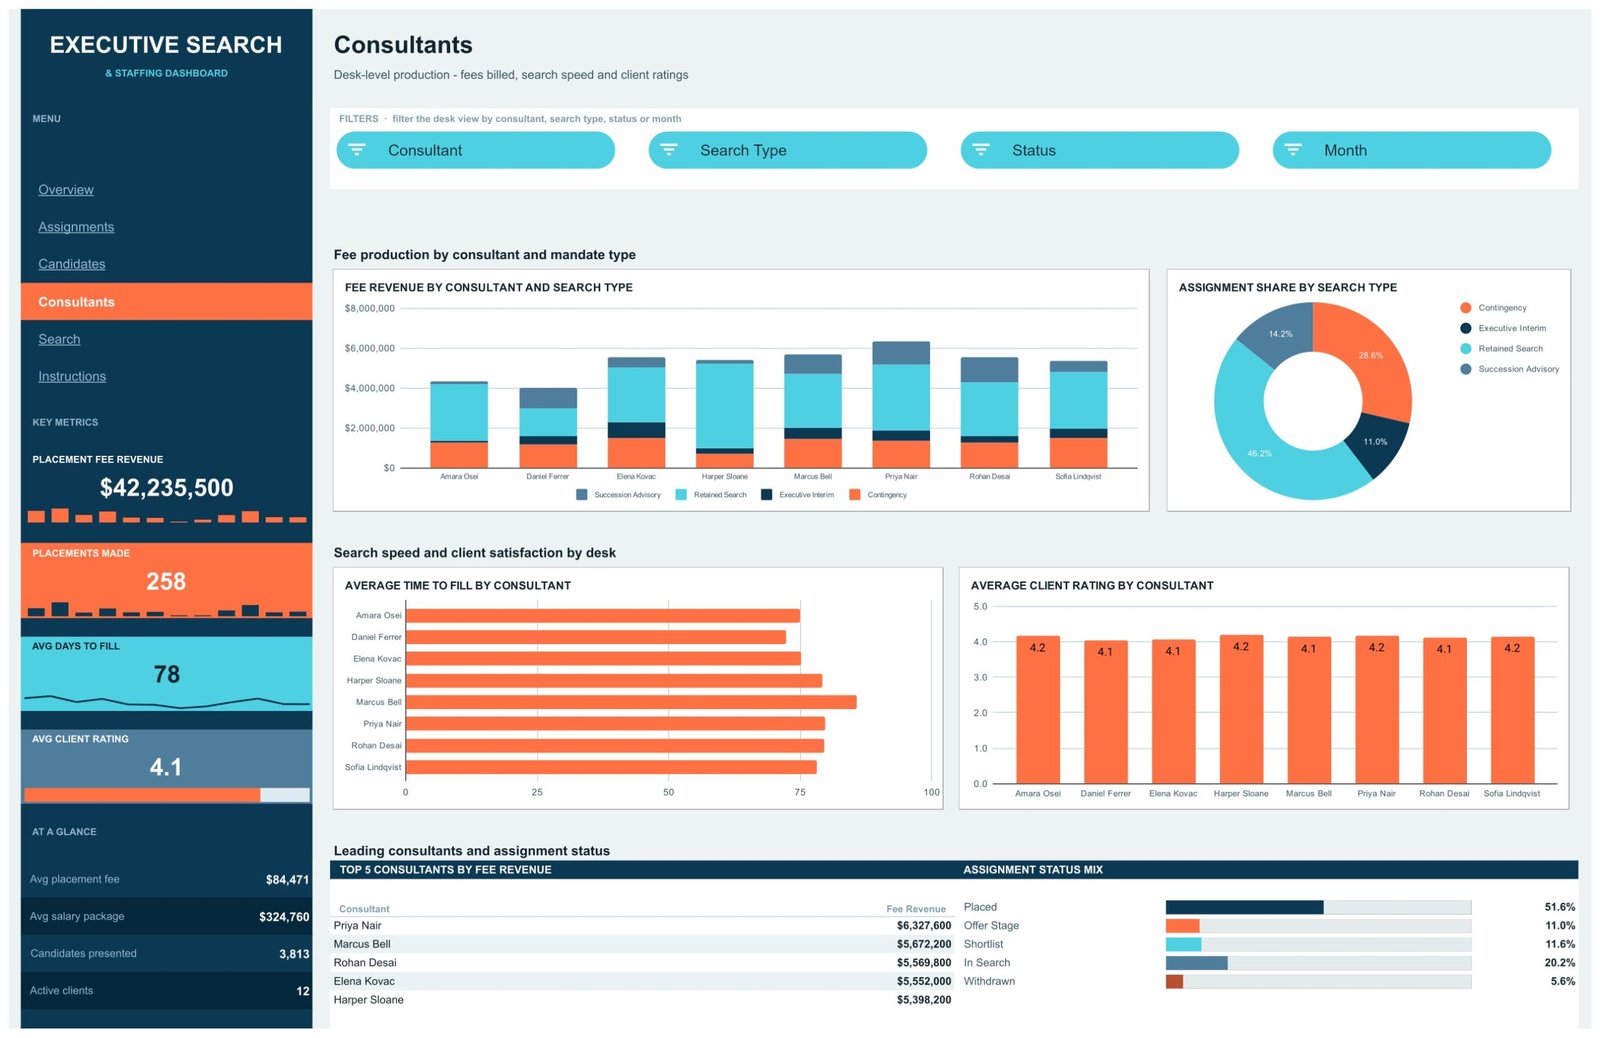
Desk-level production for eight consultants – Amara Osei, Daniel Ferrer, Elena Kovac, Harper Sloane, Marcus Bell, Priya Nair, Rohan Desai and Sofia Lindqvist. Fee Revenue by Consultant and Search Type stacks Contingency, Executive Interim, Retained Search and Succession Advisory per desk. Assignment Share by Search Type is a donut: Retained Search 46.2%, Contingency 28.6%, Succession Advisory 14.2%, Executive Interim 11.0%. Average Time to Fill by Consultant and Average Client Rating by Consultant sit side by side so speed and satisfaction can be read together. Priya Nair tops the fee table at $6,327,600, ahead of Marcus Bell at $5,672,200.Executive Search & Staffing Dashboard in Google Sheets
Search and Instructions
The Search page is a single-record lookup: type an Assignment ID such as ASG-0001 and the workbook returns date, consultant, practice area, client, client sector, seniority level, search type, status, candidates presented, time to fill, salary package, placement fee, client rating, month and count. Every field is an INDEX / MATCH against the Data tab wrapped in IFERROR, so a missing ID reads “Not found” rather than #N/A. Instructions closes the file with four short setup steps – load your own data, use the filters, move around, make it yours.Executive Search & Staffing Dashboard in Google Sheets
Google Sheets vs. Microsoft Excel vs. Paid Executive Search SaaS – Feature Comparison
| This template (Google Sheets) | Excel dashboard build | Bullhorn / Vincere | |
|---|---|---|---|
| Cost | One payment, no renewal | Microsoft 365 subscription | Per-seat monthly licence |
| Platform | Google Sheets, any browser | Excel desktop | Vendor-hosted ATS |
| Setup time | Under 10 minutes | Hours to days to build | Weeks of implementation |
| Real-time team collaboration | Yes, native | Only via OneDrive co-authoring | Yes |
| Mobile access | Sheets app, free | Limited | Vendor mobile app |
| Customizable fields | Edit any of the 16 columns | Yes | Admin-controlled |
| Share with link | Yes | File send or shared drive | Seat required |
| Year-1 cost at 5 users | Price of this template | Roughly $400 in licences | Commonly $5,000+ |
| Mandate capacity out of the box | 1,000 assignments | Whatever you build | Unlimited |
| Candidate sourcing and CV parsing | No | No | Yes |
Who Should Use This Template
Boutique executive search firms with two to twenty consultants get the most out of it, because the Consultants page is built around desk-level fee production rather than headcount reporting. Staffing agency owners who bill on placement fees will recognise the revenue, time-to-fill and status-mix framing immediately. In-house talent acquisition leads running retained searches through external partners can use it to hold those partners to a number. So can operations managers who currently rebuild the same partner pack in a fresh spreadsheet every quarter.Executive Search & Staffing Dashboard in Google Sheets
It is the wrong tool if you need candidate sourcing, CV parsing, email sequencing or consent-managed candidate records – that is an applicant tracking system, and the Recruitment Applicant Tracking System Web App covers that ground instead.Executive Search & Staffing Dashboard in Google Sheets
Real-World Use Cases
A nine-person search boutique. The managing partner opens Consultants each Monday, filters to Retained Search, and reads fee revenue and average client rating per desk before the partner call – two minutes instead of a morning of copy-paste.Executive Search & Staffing Dashboard in Google Sheets
A staffing agency owner. Assignments by Month and Status shows shortlists stacking at Offer Stage across Q3. Two consultants get reallocated to closing before the pipeline stalls, and the following month’s status mix confirms it worked.Executive Search & Staffing Dashboard in Google Sheets
An in-house talent lead. Overview is filtered to Financial Services, and the practice-area treemap plus the 78-day time-to-fill figure go straight into the quarterly board pack as a picture rather than a table.Executive Search & Staffing Dashboard in Google Sheets
Advantages of the Executive Search & Staffing Dashboard in Google Sheets
- No add-ons and no scripts to authorise – slicers and pivot tables are native features, so nothing breaks when an add-on updates.
- Every chart is traceable – each visual has its own pivot table to the right of the page, starting at column Z, so you can always see where a number came from.
- Shareable by link – clients and partners can be given view-only access without a licence, seat or export.
- Fast to rebrand – the rail, the KPI cards and the chart palette are plain fills, so a firm’s colours go on in one pass.
- Room to grow – 1,000 mandates fit before any range needs extending, which covers several years of a boutique desk.Executive Search & Staffing Dashboard in Google Sheets
Opportunities for Improvement
Being honest about the edges: there is no candidate-level record, so a shortlist is a count rather than a list of people. Fees are entered, not calculated from a percentage of package, so a change to your fee model is a data-entry change rather than a setting. The workbook holds one currency at a time. Beyond 1,000 mandates you will need to extend the pivot source ranges once by hand. And because slicers are page-scoped, a filter set on Overview does not carry through to Assignments – that is deliberate, but it does surprise people on day one.Executive Search & Staffing Dashboard in Google Sheets
Best Practices
- Never leave Assignment ID blank – the pivots use it to ignore empty rows and the Search page uses it to find a mandate.Executive Search & Staffing Dashboard in Google Sheets
- Keep all 16 column headers exactly as shipped; rename them only if you are ready to refresh every pivot afterwards.Executive Search & Staffing Dashboard in Google Sheets
- Enter one row per mandate, not per candidate, and use Candidates Presented as the count.
- Update status weekly rather than at close – the status mix is only as current as your last edit.Executive Search & Staffing Dashboard in Google Sheets
- Share view-only with clients and edit access with consultants, so the Data tab stays clean.
- Take a copy at the end of each year before archiving rows, so prior-year charts stay intact.Executive Search & Staffing Dashboard in Google Sheets
Explore Relevant Templates
- Staffing Agency Dashboard in Google Sheets – agency-wide placements, margins and consultant output.
- Temp Staffing Dashboard in Google Sheets – contractor shifts, fill rates and gross margin.
- Recruitment Funnel KPI Dashboard in Google Sheets – stage-by-stage conversion for the hiring funnel.
- HR KPI Scorecard in Google Sheets – a monthly scorecard cut rather than an analytics dashboard.
- HR Google Sheets Pack – ten HR templates in one purchase.Executive Search & Staffing Dashboard in Google Sheets
Interested in the pivot-table skills behind a dashboard like this? The Excel Pivot Tables & Dashboards course on NextGenTemplates Academy covers them step by step with practice files.
Get the Executive Search & Staffing Dashboard in Google Sheets
Frequently Asked Questions
Do I need an add-on for the filters to work?
No. All 15 filters are native Google Sheets slicers and all 16 charts are fed by native pivot tables, so there is nothing to install or authorise.Executive Search & Staffing Dashboard in Google Sheets
How many assignments can the workbook hold?
1,000 out of the box, because the pivots read A1:P1001. Past that you extend the pivot source range once and every chart follows.
Is there an Excel or Power BI version?
Yes – the Excel build and the Power BI build are sold separately.
Can I change the currency and the field names?
Yes. Reformat the fee and salary columns to your currency and rename headers on the Data tab, then refresh the pivots so the field list picks the new names up.Executive Search & Staffing Dashboard in Google Sheets
Will clients need a Google account to look at it?
Only people editing need an account. A view-only link works for anyone.
Does it track individual candidates?
No. It reports at mandate level. Candidates Presented is a number on the assignment row, not a linked candidate record.
Is this an applicant tracking system?
No. It reports on searches you are already running – it does not source candidates, parse CVs or send email.
About the Author
Built by PK – Microsoft Certified Professional with 15+ years of Excel, Google Sheets, and Power BI experience. Founder of NextGenTemplates, reaching 300K+ subscribers across YouTube channels. Every template is hand-built and tested before release.
Conclusion
The Executive Search & Staffing Dashboard in Google Sheets does one job well: it takes the mandate list a search firm already keeps and shows fee revenue, pipeline stage, search duration and desk performance on six pages that anyone in the firm can open in a browser. It will not run your search process for you, and it will not tell you what the numbers mean – that reading is yours to do. What it removes is the hour a week spent rebuilding the same partner pack from scratch.
If that is the job you need done, you can get the Executive Search & Staffing Dashboard in Google Sheets for $9.99 – normally $16.99, instant download, lifetime access and free updates.
For walkthroughs of this and other Google Sheets builds, subscribe at
youtube.com/@NeotechNavigators.