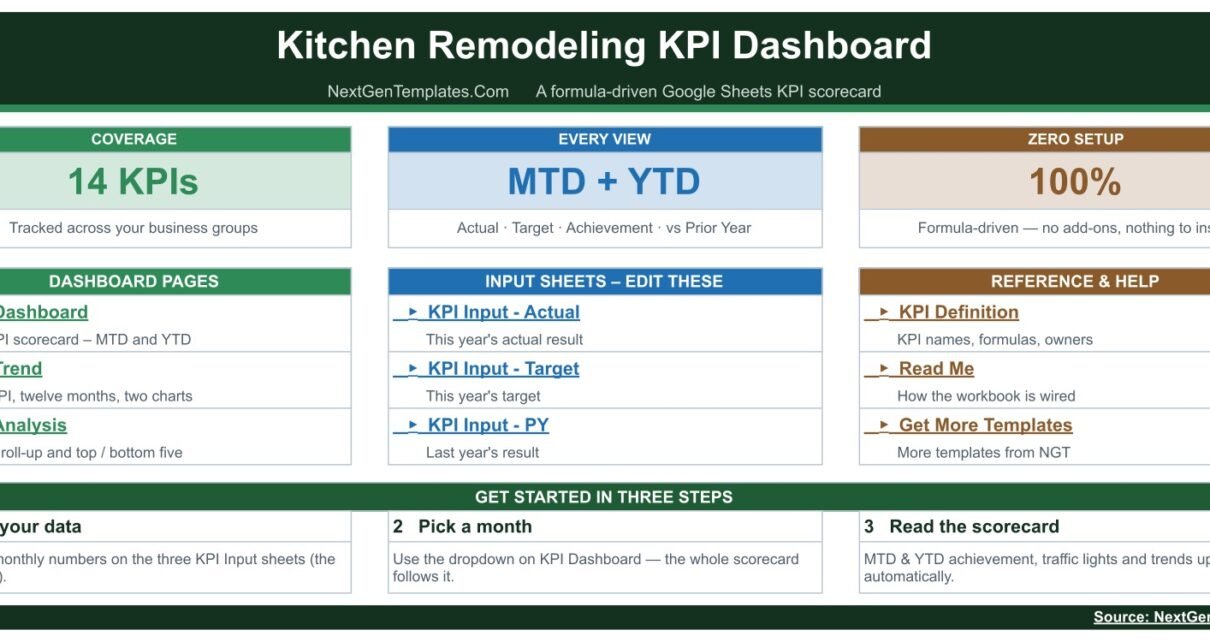
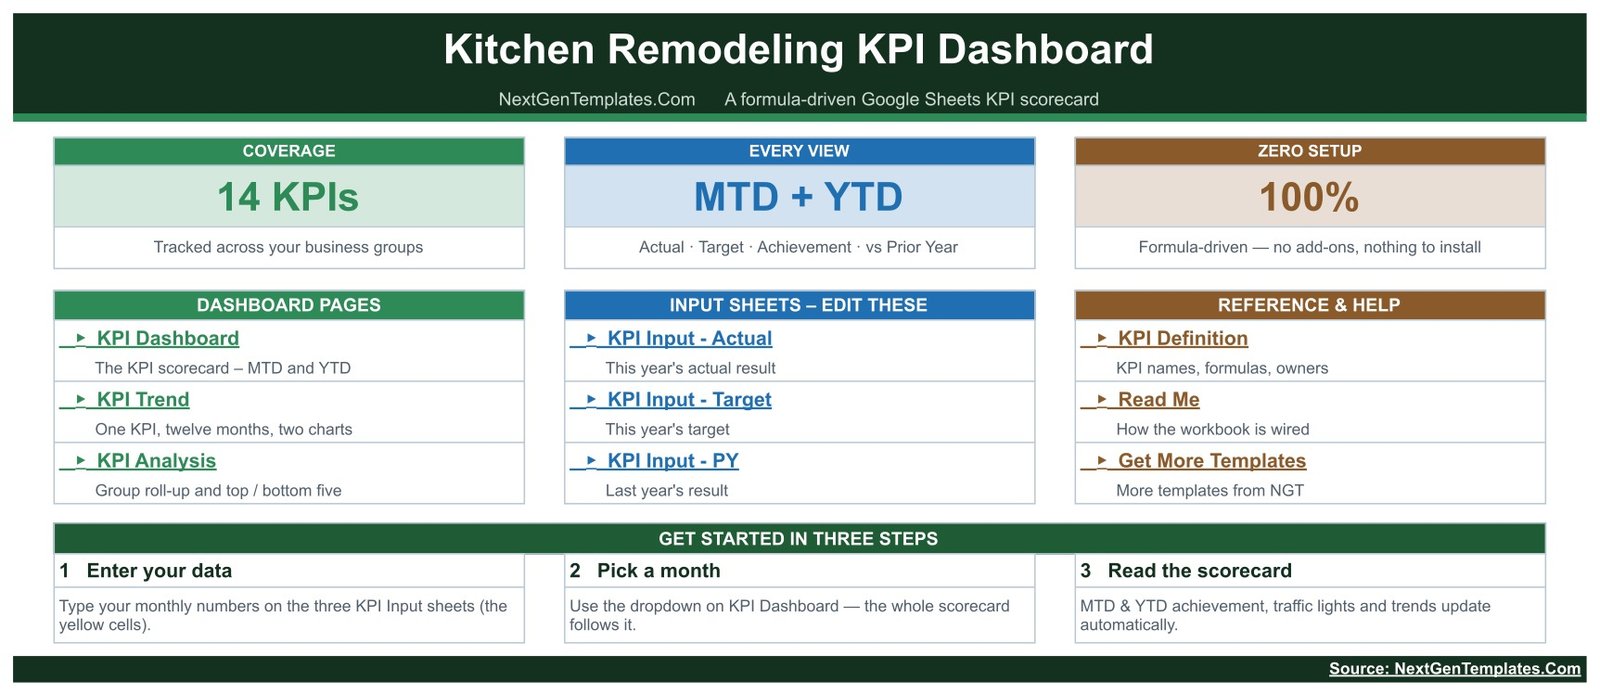
The Kitchen Remodeling KPI Dashboard in Google Sheets tracks 14 KPIs across four KPI groups on ten tabs, and every row on the scorecard carries six columns twice over — Actual, Target, Achievement %, Status, Prior Yr and a vs-PY arrow, once for month-to-date and once for year-to-date. One month picker drives the entire file: change it and the scorecard, the twelve-month trend page and the group roll-up all follow, with no refresh step and no add-on to install.
Most remodeling firms already have the numbers. They live in the accounting package, in a job-costing app, in the production manager’s head. What is usually missing is the one page a month that puts revenue, margin, on-time completion, cabinet lead time and callbacks next to their targets and last year’s figures, so the monthly meeting is about two or three KPIs that moved rather than a scroll through a spreadsheet. That is the whole job this template does.Kitchen Remodeling KPI Dashboard in Google Sheets
Get the Kitchen Remodeling KPI Dashboard in Google Sheets
What this template is — and what it is not
This is a reporting spreadsheet built over numbers you type in. It is worth being blunt about the boundaries before anything else, because the topic invites assumptions it cannot support.
- It does not establish compliance with building codes, permitting, licensing, lien law or home-improvement-contract law in any jurisdiction.Kitchen Remodeling KPI Dashboard in Google Sheets
- It is not a structural, electrical, plumbing, gas or safety assessment, not an inspection record and not a warranty.Kitchen Remodeling KPI Dashboard in Google Sheets
- It does not produce estimates, bids or contracts that are binding, accurate or fit to hand a customer. It does not price work at all.Kitchen Remodeling KPI Dashboard in Google Sheets
- It does not replace any duty a licensed contractor carries by statute.
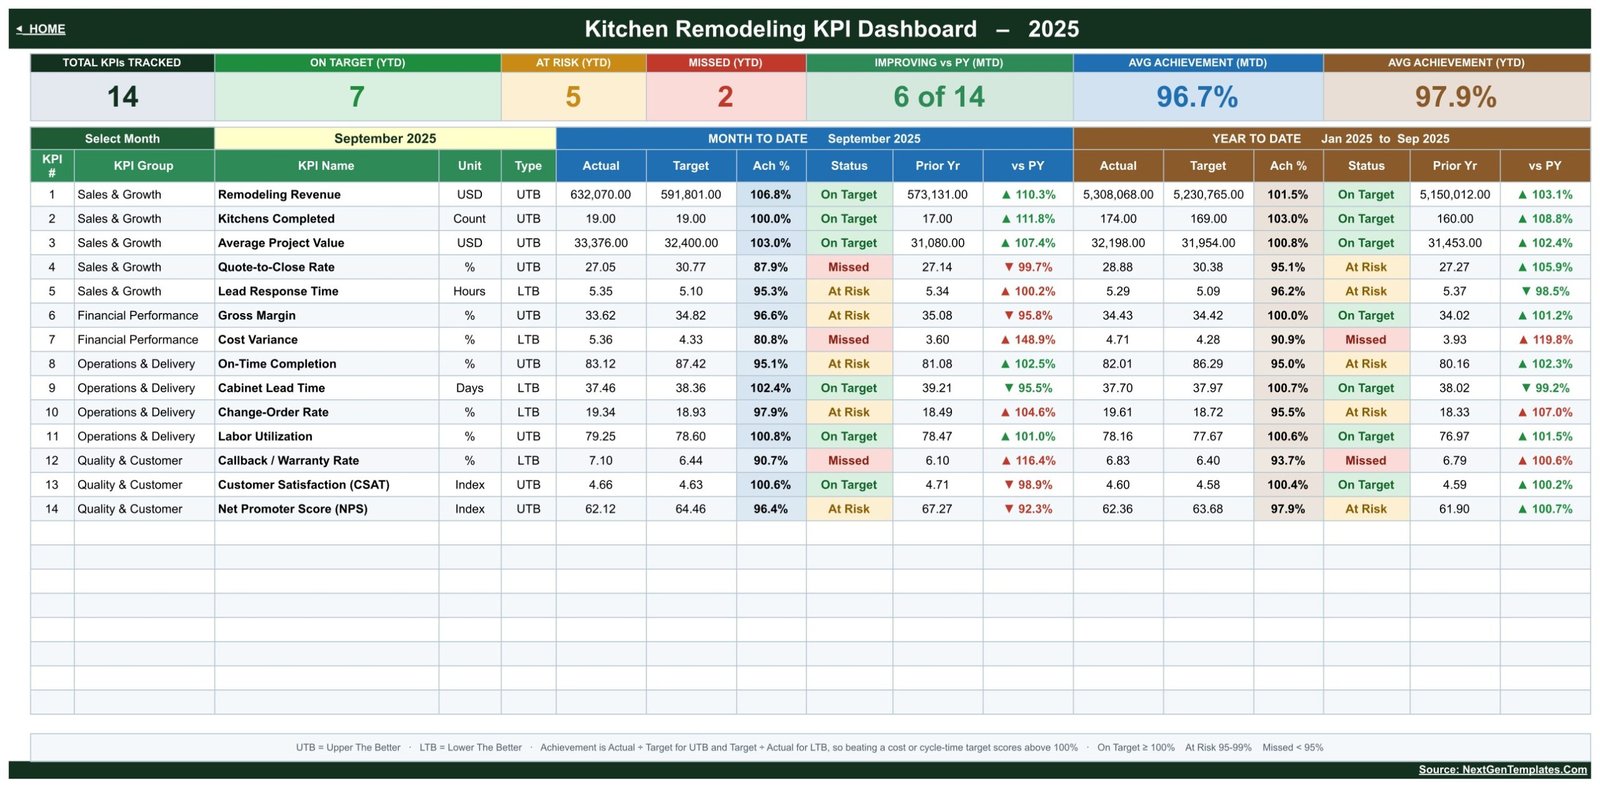
Everything visible in the screenshots below is demo data shipped inside the file so that the pages are not blank when you open them. The 33.62% gross margin, the 37.46-day cabinet lead time, the 96.7% average achievement — none of those are benchmarks, and none of them came from a real business. Delete them and type your own.Kitchen Remodeling KPI Dashboard in Google Sheets
Key Features of the Kitchen Remodeling KPI Dashboard in Google Sheets
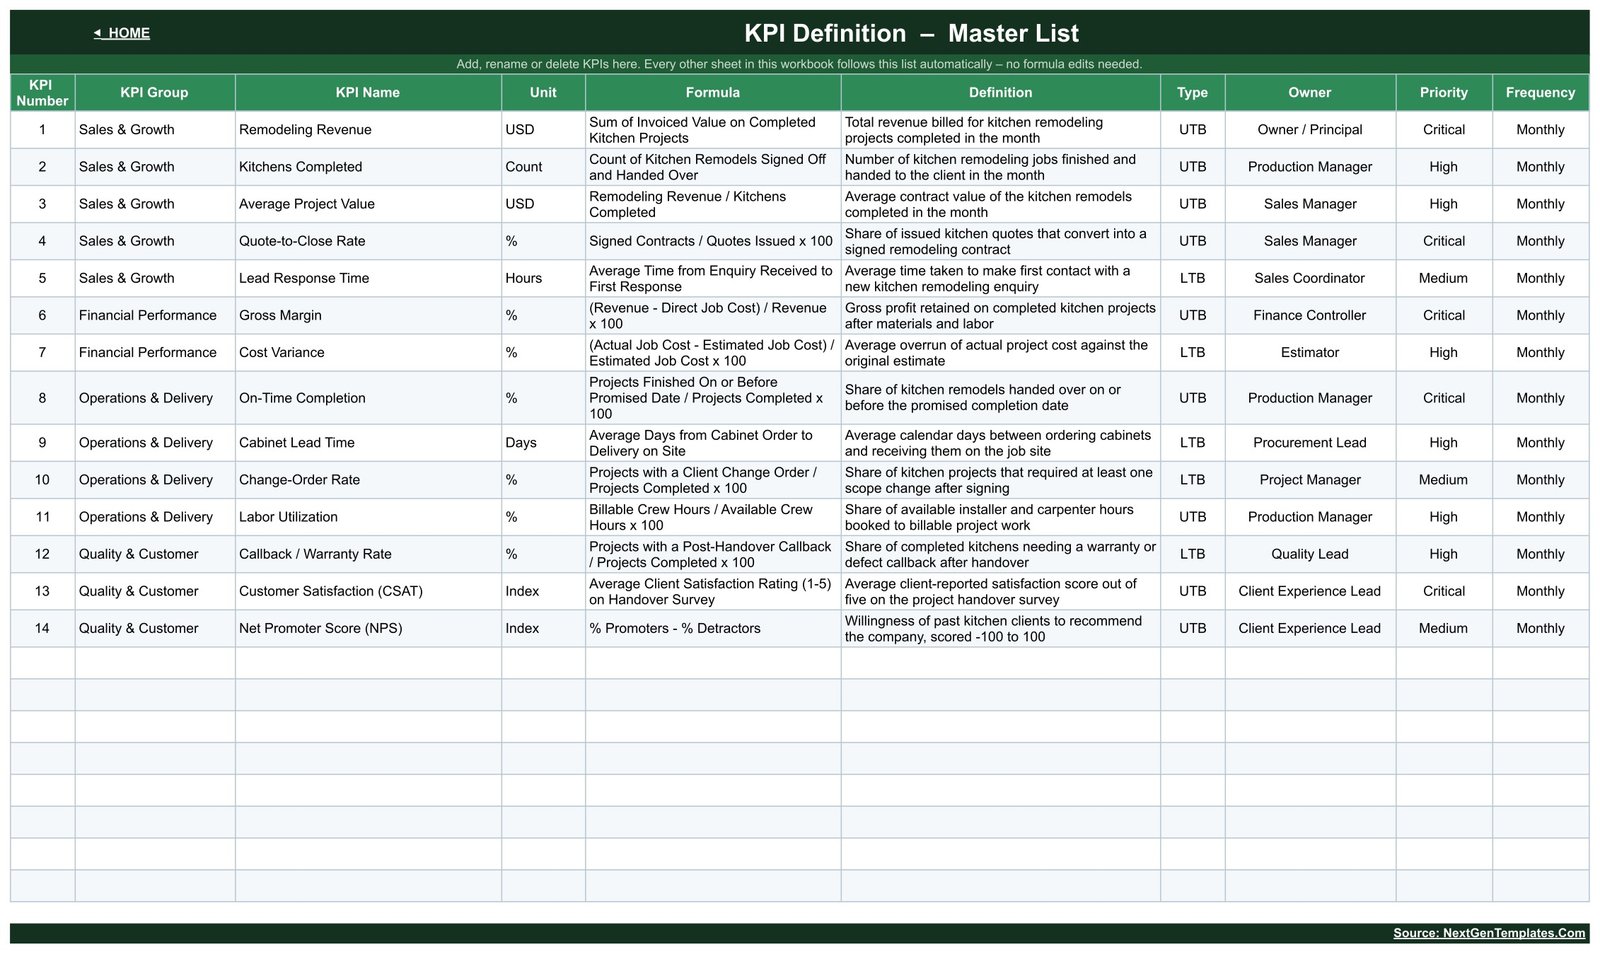
14 KPIs in four groups. Sales & Growth holds Remodeling Revenue, Kitchens Completed, Average Project Value, Quote-to-Close Rate and Lead Response Time. Financial Performance holds Gross Margin and Cost Variance. Operations & Delivery holds On-Time Completion, Cabinet Lead Time, Change-Order Rate and Labor Utilization. Quality & Customer holds Callback / Warranty Rate, Customer Satisfaction (CSAT) and Net Promoter Score (NPS).Kitchen Remodeling KPI Dashboard in Google Sheets
Direction-aware achievement. Each KPI is tagged UTB (upper the better) or LTB (lower the better) on the definition sheet. Achievement is Actual ÷ Target for UTB rows and Target ÷ Actual for LTB rows, which means beating a cost target or shortening a lead time scores above 100% rather than below it. The vs-PY arrows follow the same logic: a falling Cabinet Lead Time gets a green down arrow, a rising Cost Variance gets a red up arrow.
Traffic lights you can move. On Target is 100% and above, At Risk is 95% to 99%, Missed is below 95%. Those are ordinary formulas on the KPI Dashboard sheet, not hard-coded conditional rules, so a firm that wants a tighter band can change them.Kitchen Remodeling KPI Dashboard in Google Sheets
One definition sheet feeds everything. Rename a KPI, change its unit, flip it from UTB to LTB, or add a fifteenth row, and the scorecard, the trend picker and the group roll-up all follow. There are no formula edits to chase.Kitchen Remodeling KPI Dashboard in Google Sheets
Plain formulas, nothing to install. No Apps Script, no add-on, no authorisation prompt. It behaves like a normal Google Sheets file in a shared Drive, which also means it works on the Sheets mobile app.
Sheets Explanation
Ten tabs: a Home index, three dashboard pages, three input sheets you edit, and three reference sheets.
KPI Dashboard
The scorecard, and the page you will actually live on. Seven cards run across the top — Total KPIs Tracked, On Target (YTD), At Risk (YTD), Missed (YTD), Improving vs PY (MTD), Avg Achievement (MTD) and Avg Achievement (YTD). Below them the 14-row table splits into a Month To Date block and a Year To Date block. In the shipped demo month those cards read 14, 7, 5, 2, 6 of 14, 96.7% and 97.9%.
KPI Trend
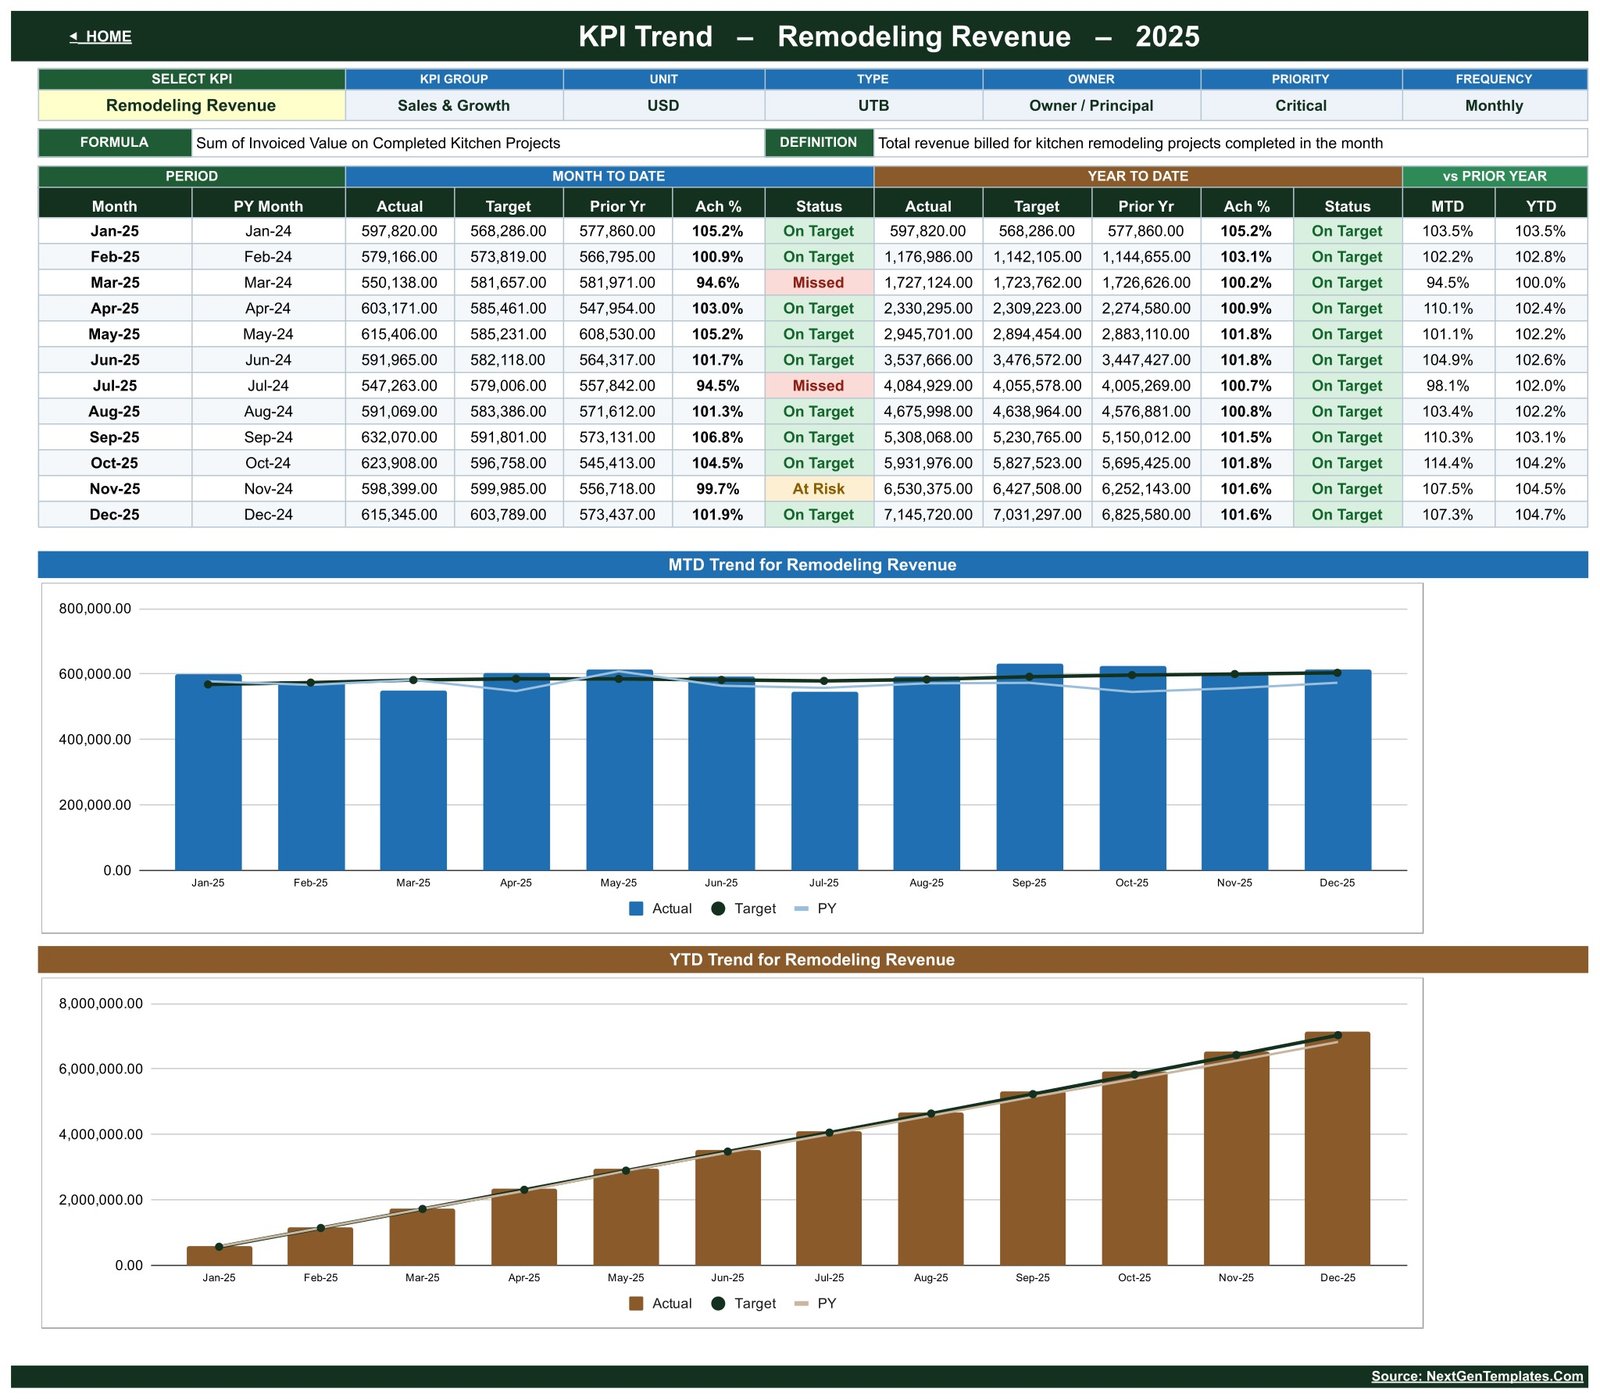
One KPI, twelve months. Choose a KPI in the Select KPI cell and the header fills in its group, unit, type, owner, priority and frequency, plus its formula and definition. A twelve-row table gives MTD and YTD Actual, Target, Prior Yr, Achievement and Status for each month, and two charts follow it: MTD Trend for Remodeling Revenue and YTD Trend for Remodeling Revenue, each plotting Actual as columns against Target and prior-year lines.
KPI Analysis
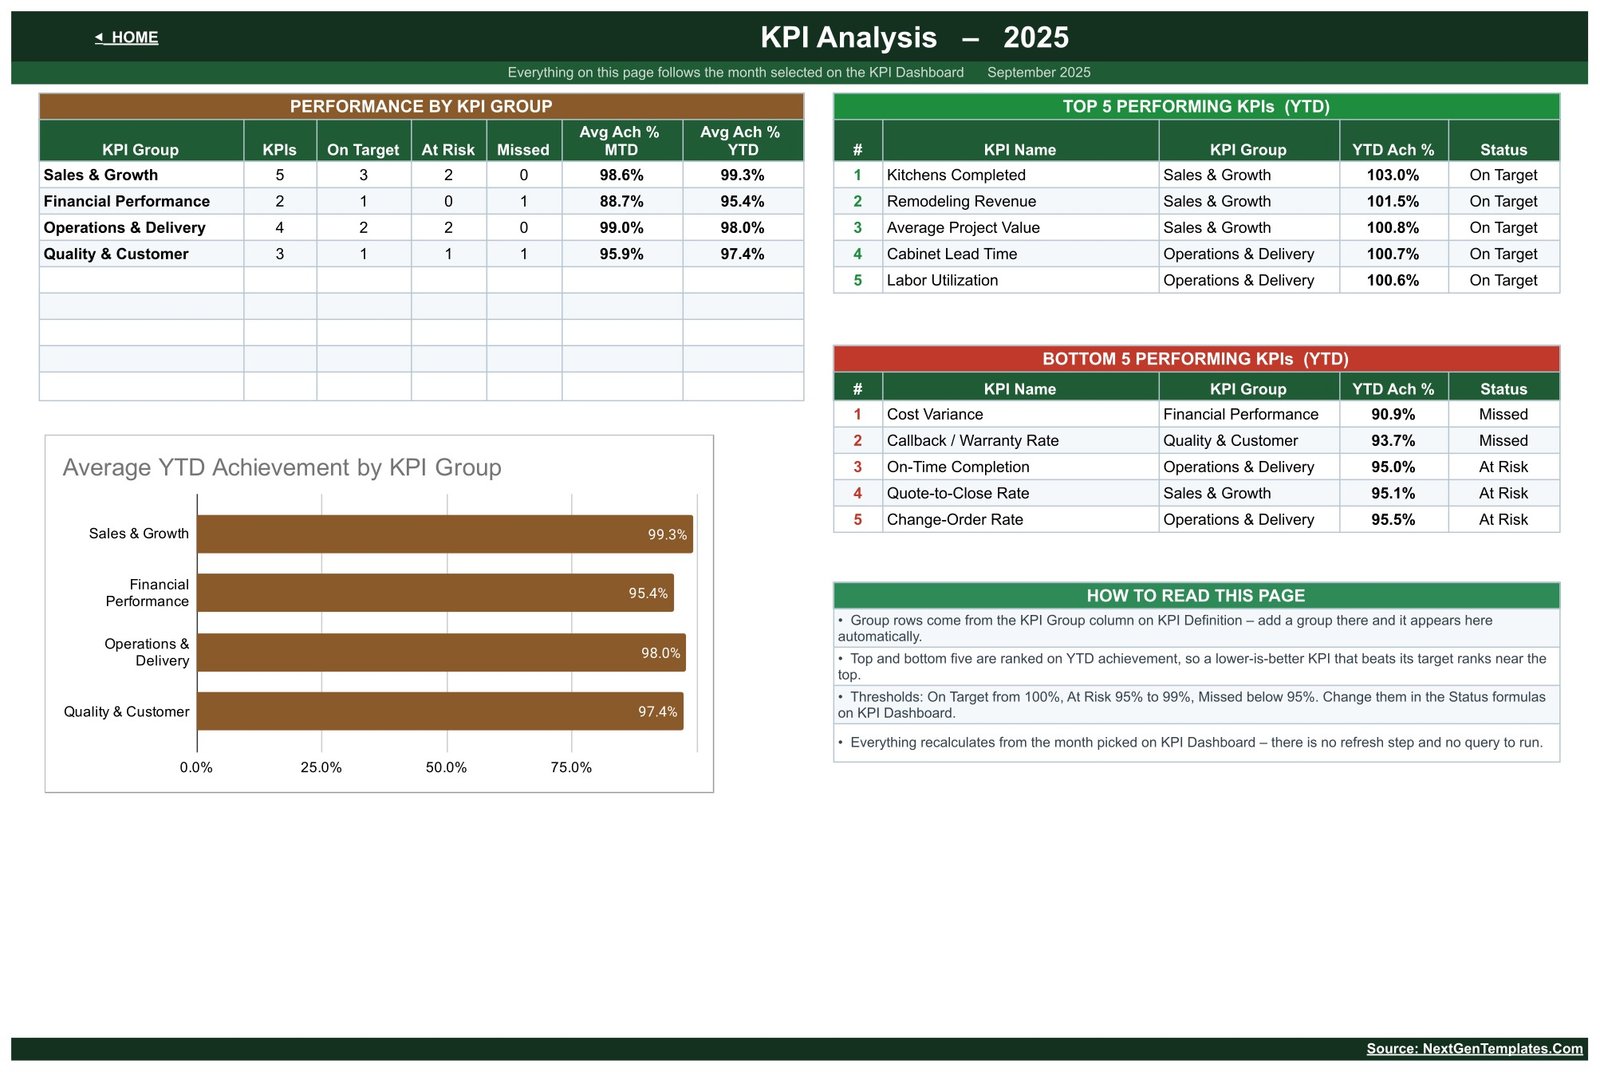
The roll-up, and the page to take into a partner meeting. A Performance by KPI Group table counts KPIs, On Target, At Risk and Missed per group and averages MTD and YTD achievement, with a chart of Average YTD Achievement by KPI Group below it. On the right, Top 5 Performing KPIs (YTD) and Bottom 5 Performing KPIs (YTD) rank the whole list, and a How To Read This Page panel restates the thresholds.
KPI Input – Actual, Target and PY
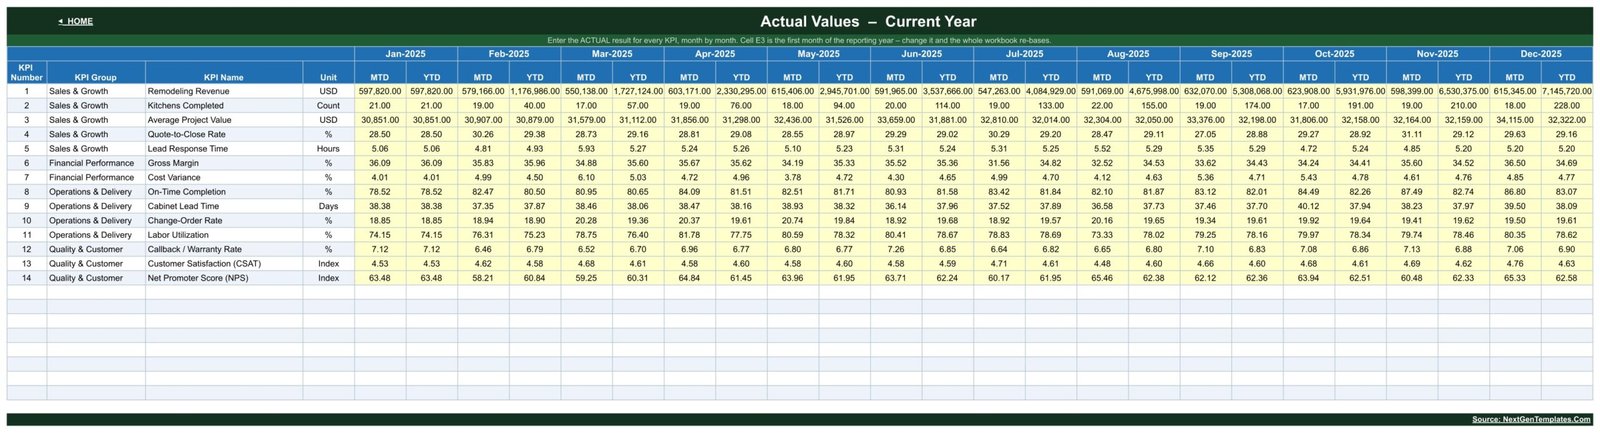
Where you type. Fourteen rows by twelve months, each month holding an MTD cell and a YTD cell, editable cells shaded yellow. Cell E3 sets the first month of your reporting year, so a firm on an April-to-March year changes one cell rather than rebuilding anything. The Target and PY sheets repeat the identical layout.
KPI Definition
The master list every other sheet reads: group, unit, plain-English formula, definition, UTB/LTB type, owner, priority and frequency for all 14 KPIs. It doubles as the page you hand a new production manager to explain what “Cost Variance” means in your firm.
Google Sheets vs. Excel vs. Paid Contractor SaaS — Feature Comparison
| Feature | This Google Sheets template | Microsoft Excel dashboard | Buildertrend / JobTread / Houzz Pro |
|---|---|---|---|
| Cost | $8.99 one-time ✅ | $20-60 one-time, plus Microsoft 365 | $99-499 / month |
| Platform | Any browser ✅ | Excel desktop, Windows or Mac | Vendor web app |
| Setup time | Under 10 minutes ✅ | 10-20 minutes | Days of onboarding and import |
| Real-time collaboration | Native Drive sharing ✅ | OneDrive co-authoring only | Yes |
| Mobile access | Sheets mobile app ✅ | Excel mobile app | Yes |
| Rename or add your own KPIs | One row on the definition sheet ✅ | Edit the definition sheet | Limited to the vendor’s fields |
| Share with a link | Yes, Drive link ✅ | Attachment or OneDrive link | Yes, seat required |
| Job costing, scheduling, client portal | No — reporting only | No | Yes ✅ |
| Year-1 cost at 5 users | $8.99 ✅ | $20-60 plus licences | $1,200-6,000 |
For a remodeling firm that wants a monthly KPI review without a five-figure software line, this template sits in the sweet spot — and if you need scheduling, job costing and a client portal, buy the SaaS instead.
Who Should Use This Template
Perfect for:
- Kitchen remodeling and renovation firms doing roughly 5-40 kitchens a year who already keep their figures somewhere
- Owner-operators and production managers who want one page a month rather than a reporting project
- Design-build and fit-out contractors preparing a KPI pack for a partner, lender or board review
Not a fit if:
- You expect the file to collect the data — there is no job costing, timesheet, scheduling or CRM engine in it
- You need permitting, code-compliance, licensing or lien records
- You want customer-facing estimates or bids generated
- You need a live sync from QuickBooks, Buildertrend or a field app
Real-World Use Cases
Dan runs a six-crew kitchen remodeling company. On the first Monday of each month he types his figures into the three input sheets, picks the month, and reads whether cabinet lead time and change-order rate moved against last year. The review that used to cost him an afternoon of pivot tables now costs twenty minutes.
Priya is production manager at a design-build firm. She brings the KPI Analysis page to her owner to show which of the four groups is dragging the year, then uses the bottom-five list to pick the two KPIs the team will work on next quarter — a conversation that is much easier with a ranked list than with a wall of numbers.
Marco owns a two-crew outfit that does kitchens and bathrooms. He runs this alongside the Bathroom Remodeling KPI Scorecard in Google Sheets so each side of the business has its own targets instead of one blended average that hides both.
Advantages
The cost case is the obvious one: $8.99 once against $99-499 a month for contractor software, which is a $1,200-6,000 difference in year one for a five-person team. But the real advantage is narrower than that. The file does not try to run your business, so there is nothing to migrate into it and nothing to abandon if it does not suit you. Twenty minutes a month of typing buys you a trend line, a prior-year comparison and a ranked list of what is slipping.
The second advantage is that the KPI list is yours. “Cabinet Lead Time” and “Callback / Warranty Rate” are sensible defaults for a kitchen firm, but if your bottleneck is countertop templating or permit turnaround, rename the row and the rest of the workbook follows. Few paid tools let you do that.
Opportunities for Improvement
Being honest about what is weak matters more than another round of feature bullets.
Data entry is manual, and that is the design. There is no import, no connector and no sync. If your figures live in three systems, somebody still has to reconcile them monthly. For a firm doing 200 kitchens a year that is a real cost and a job-costing tool is probably the better buy.
The Average YTD Achievement by KPI Group chart is labelled to 75%. All four bars run past the last printed axis label because the 100% gridline is not labelled. The data labels on the bars are correct and readable, so nothing is misreported, but the axis looks truncated until you notice the labels.
The trend page shows all twelve months regardless of the selected month. Pick September and the table still lists October through December from the demo data. Once you replace the sample rows with your own, unfilled future months simply read as blanks or zeros — but it surprises people the first time.
It is single-year. Current year and prior year, no more. A three-year view means a second copy of the file.
Best Practices
- Rename the 14 KPIs to your own wording before you paste a year of data — it is a one-off job on the definition sheet and it saves rework.
- Set targets you will defend. Every traffic light on the scorecard is only as meaningful as the Target column behind it.
- Fill the PY input sheet even if it is tedious. Achievement alone tells you if you hit a number; vs-PY tells you whether the business is actually moving.
- Check the UTB/LTB tag on every KPI you add. Tag a cost metric as UTB by mistake and its traffic light will be inverted, quietly, all year.
- Share the file view-only with the crew and keep edit rights with whoever owns the monthly close.
- Google’s own guidance on protected ranges and sheet protection is worth ten minutes if several people will open it.
Explore Relevant Templates
- Kitchen Remodeling KPI Scorecard in Google Sheets — same trade, the ten-KPI scorecard layout rather than this month-picker dashboard.
- Home Renovation Contractor KPI Scorecard in Google Sheets — the wider renovation view for firms that do more than kitchens.
- Interior Fit-Out KPI Scorecard in Google Sheets — for commercial fit-out work alongside residential.
- Window and Door Installation KPI Dashboard in Google Sheets — the same dashboard layout for a neighbouring trade.
- Elevator Maintenance KPI Dashboard in Google Sheets — another build of this dashboard, useful if you want to see how the layout adapts.
Curious how a KPI page like this gets built? The Excel Pivot Tables & Dashboards course on NextGenTemplates Academy walks through the method with practice files.
Get the Kitchen Remodeling KPI Dashboard in Google Sheets
Frequently Asked Questions
Does this make our remodeling work compliant or our estimates accurate?
No. The Kitchen Remodeling KPI Dashboard in Google Sheets charts numbers you type in. It establishes no compliance with building codes, permitting, licensing or contract law, it is not an inspection or safety assessment, and it produces no estimate or bid that is binding or accurate. A licensed contractor’s statutory duties are entirely unchanged by it.Kitchen Remodeling KPI Dashboard in Google Sheets
Are the figures in the screenshots real industry benchmarks?
No. Every number in the artwork is demo data shipped with the file so the pages render. The gross margin, cabinet lead time, NPS and achievement percentages did not come from a real remodeling business and should not be used as targets.Kitchen Remodeling KPI Dashboard in Google Sheets
What KPIs does it track?
Fourteen: Remodeling Revenue, Kitchens Completed, Average Project Value, Quote-to-Close Rate, Lead Response Time, Gross Margin, Cost Variance, On-Time Completion, Cabinet Lead Time, Change-Order Rate, Labor Utilization, Callback / Warranty Rate, CSAT and NPS. Any of them can be renamed or replaced on the KPI Definition sheet.Kitchen Remodeling KPI Dashboard in Google Sheets
How long does setup take?
Under 10 minutes to copy the file, set your first reporting month in cell E3 and paste a year of figures. Renaming the KPIs to your own wording adds 10-15 minutes once, on the definition sheet.Kitchen Remodeling KPI Dashboard in Google Sheets
How does it compare to Buildertrend or Houzz Pro?
Those platforms run the work — scheduling, job costing, client portals — for $99-499 a month. This template only reports, once, for $8.99. Plenty of firms run both: the platform for operations, this file for the monthly KPI page leadership actually reads.Kitchen Remodeling KPI Dashboard in Google Sheets
Can I add a fifteenth KPI?
Yes. Add the row on KPI Definition with its group, unit and UTB/LTB type, then add the matching row on the three input sheets. The scorecard, the trend picker and the group roll-up pick it up with no formula editing.Kitchen Remodeling KPI Dashboard in Google Sheets
Do I need Excel or an add-on?
Neither. It is plain Google Sheets formulas — nothing to install, nothing to authorise, and it works in a shared Drive on any browser or the Google Sheets mobile app.Kitchen Remodeling KPI Dashboard in Google Sheets
About the Author
Built by PK — Microsoft Certified Professional with 15+ years of Excel, Google Sheets and Power BI experience. Founder of NextGenTemplates, reaching 300K+ subscribers across YouTube channels. Every template is hand-built and tested before release.Kitchen Remodeling KPI Dashboard in Google Sheets
Conclusion
If your monthly review currently means rebuilding the same pivot table, this file replaces that for the price of a sandwich. It will not run your jobs, it will not keep you compliant and it will not price a kitchen — but it will put 14 KPIs, their targets, their traffic lights and last year’s figures on one page, and it will do it in under ten minutes of setup.
Instant download · One-time payment · No subscription
Last updated: September 2026