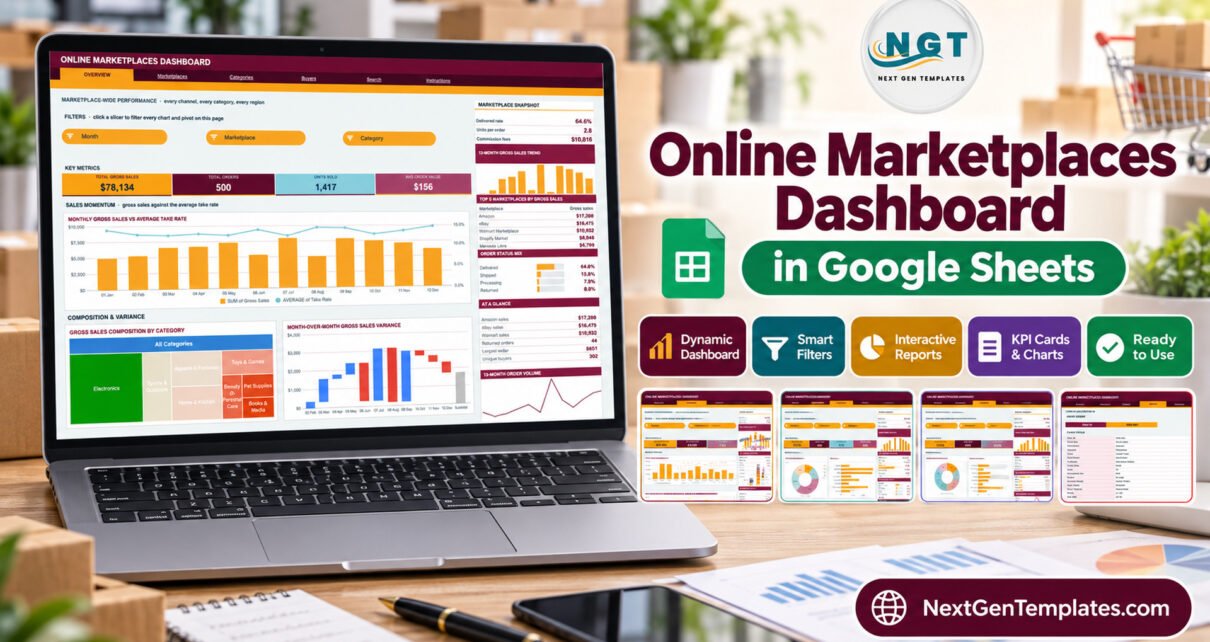
The Online Marketplaces Dashboard in Google Sheets reports 16 KPI cards and 18 charts across six tabs, driven by 15 native slicers sitting on top of native pivot tables. It ships with 500 sample orders covering 8 marketplaces, 8 product categories, 5 regions and 3 buyer segments, and every pivot, slicer and formula is pre-stretched to 1,000 data rows. In the sample file the headline figures read $78,134 gross sales, 500 orders, 1,417 units and a $156 average order value.
If you sell on more than one channel, the numbers you need are scattered across as many seller consoles as you have storefronts. Each one shows its own fees, its own return rate and its own definition of a “buyer”. Nothing puts Amazon next to Etsy next to Walmart on the same axis. This multi-channel marketplace sales dashboard does exactly that, in a file you can open in a browser and share with a link.
Get the Online Marketplaces Dashboard in Google Sheets
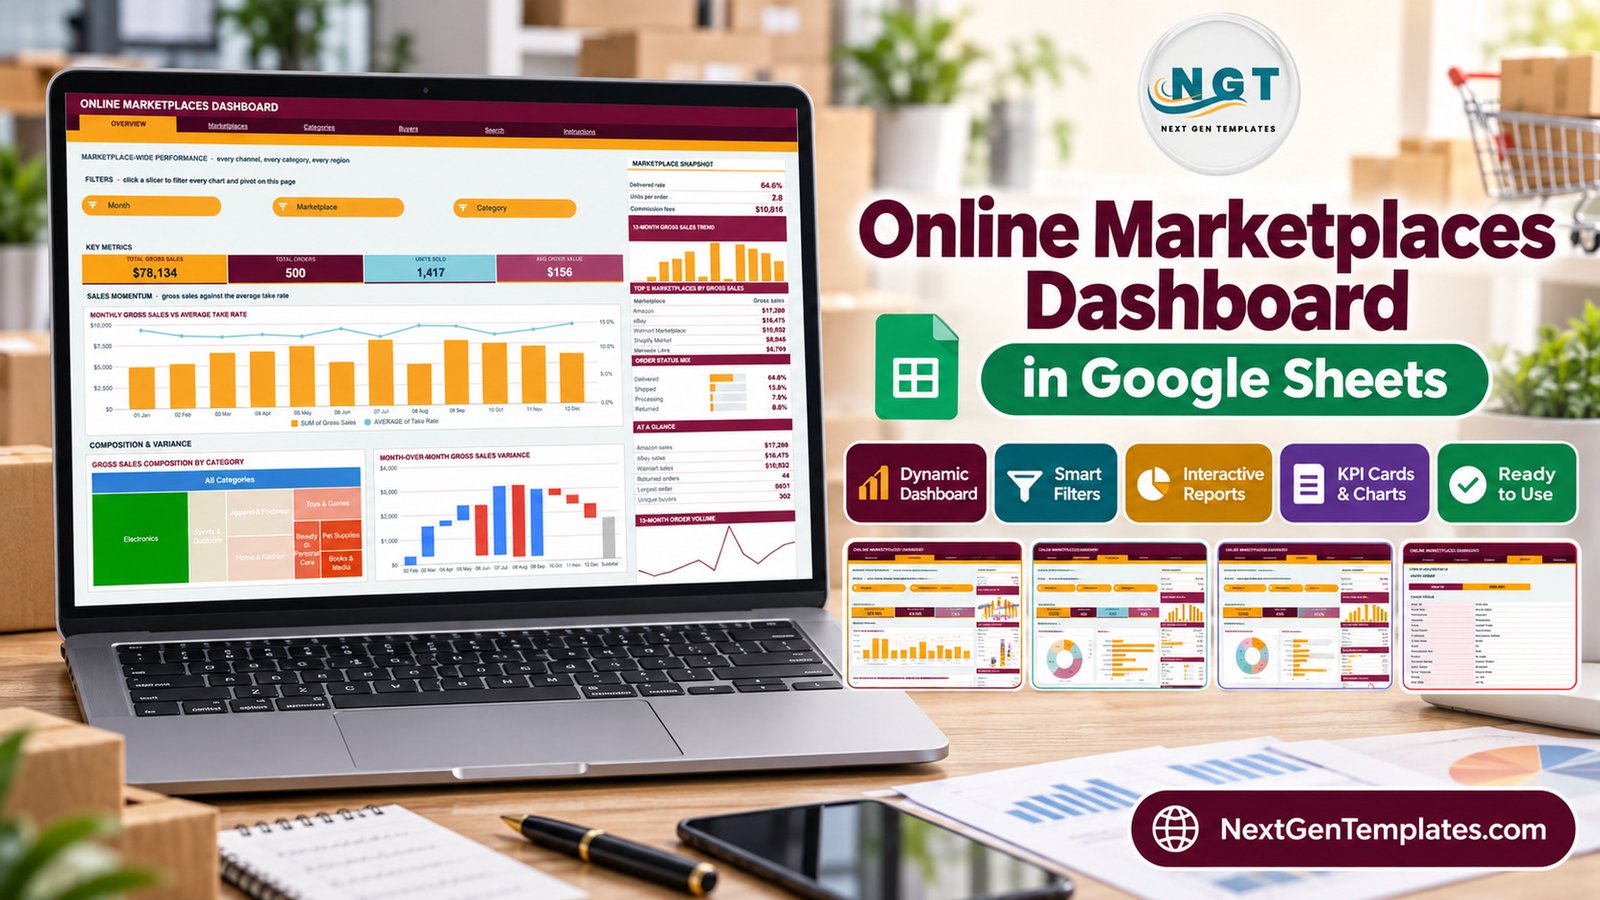
One thing to be clear about up front: this is a reporting workbook, not a connector. It does not link to Amazon, eBay, Etsy, Shopify, Walmart or any other marketplace API, and it does not import orders, settlements or fee reports by itself. You export your order rows from each channel and paste them onto the Data sheet. That is the only input the file needs, and it is the honest trade you make for a one-time purchase instead of a monthly seat fee.
Key Features of the Online Marketplaces Dashboard in Google Sheets
- Four slicer-driven analysis pages. Overview, Marketplaces, Categories and Buyers each carry four KPI cards and their own filter strip. Overview has three slicers (Month, Marketplace, Category); the three deeper pages have four each, so 15 slicers in total.
- Native pivot tables behind every chart. Each page parks its pivots to the right, past a wide spacer column. Scroll across and you can read the exact numbers feeding any visual — nothing is hidden inside a chart definition.
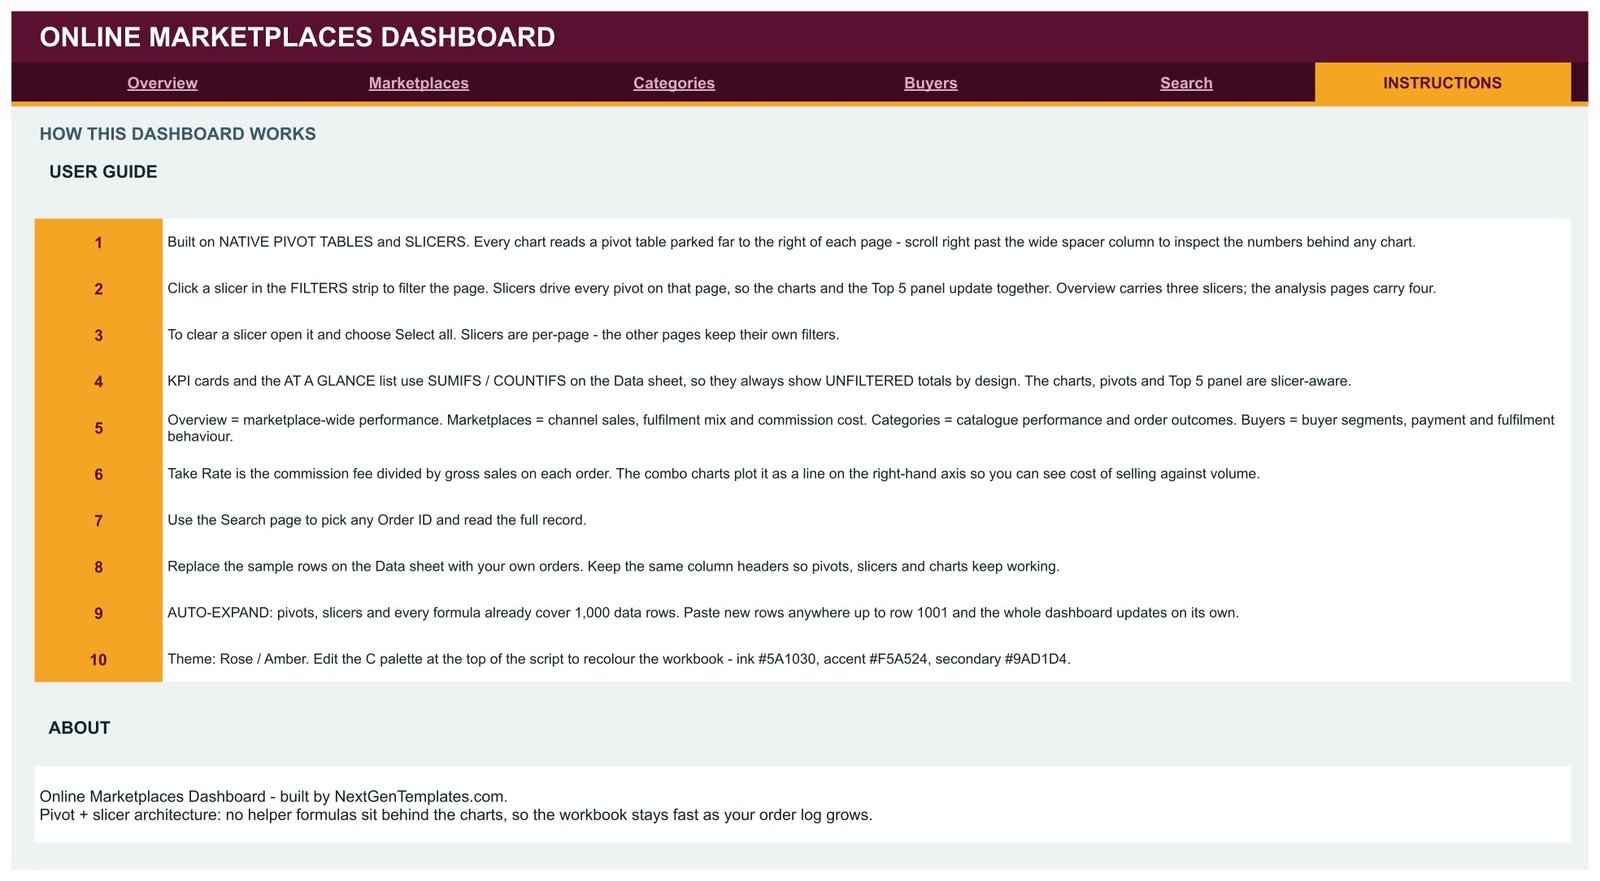
- Take Rate computed per order. Take Rate is the commission fee divided by gross sales on that order. It is plotted as a right-axis line on Monthly Gross Sales vs Average Take Rate and on Region Sales vs Average Take Rate, so cost of selling is always shown against volume.
- Deliberately unfiltered KPI cards. The KPI cards and the At a Glance lists use SUMIFS and COUNTIFS on the Data sheet, so they show whole-period totals no matter which slicer is active. Charts, pivots and the Top 5 panels are slicer-aware.
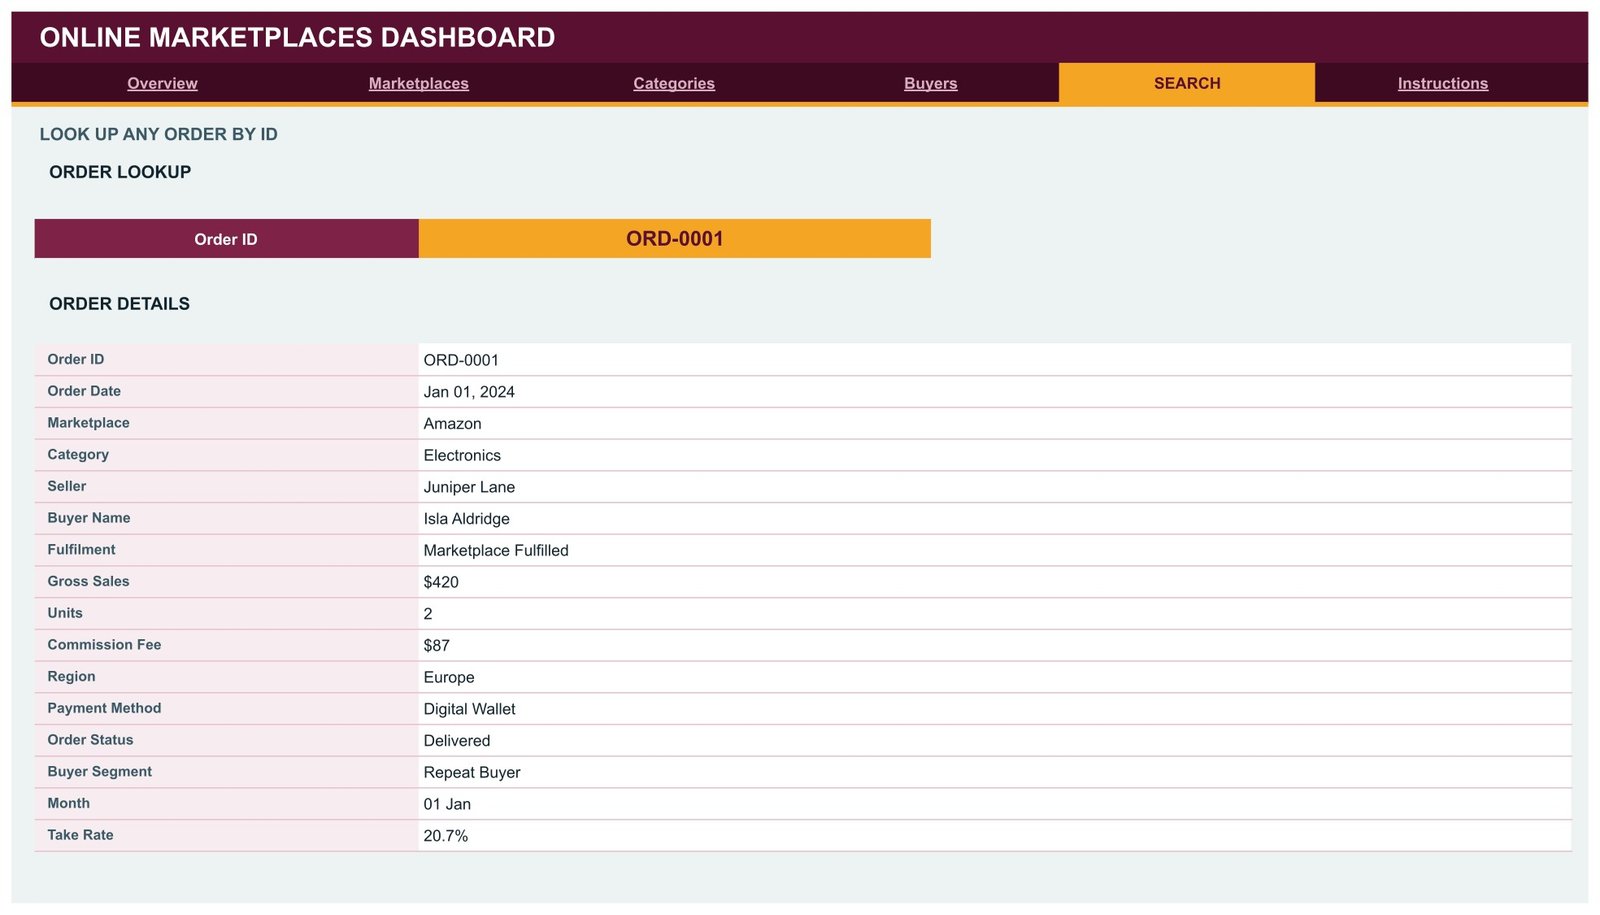
- A dedicated order lookup. The Search tab turns any Order ID into a 16-field record on one screen.
- One-place recolouring. The shipped Rose / Amber theme lives in a single palette block (ink #5A1030, accent #F5A524, secondary #9AD1D4). Change it and every banner, card and chart follows.
- Auto-expanding to 1,000 rows. Paste new orders anywhere up to row 1001 and the whole dashboard updates without resizing a single range.
Dashboard Pages Explanation
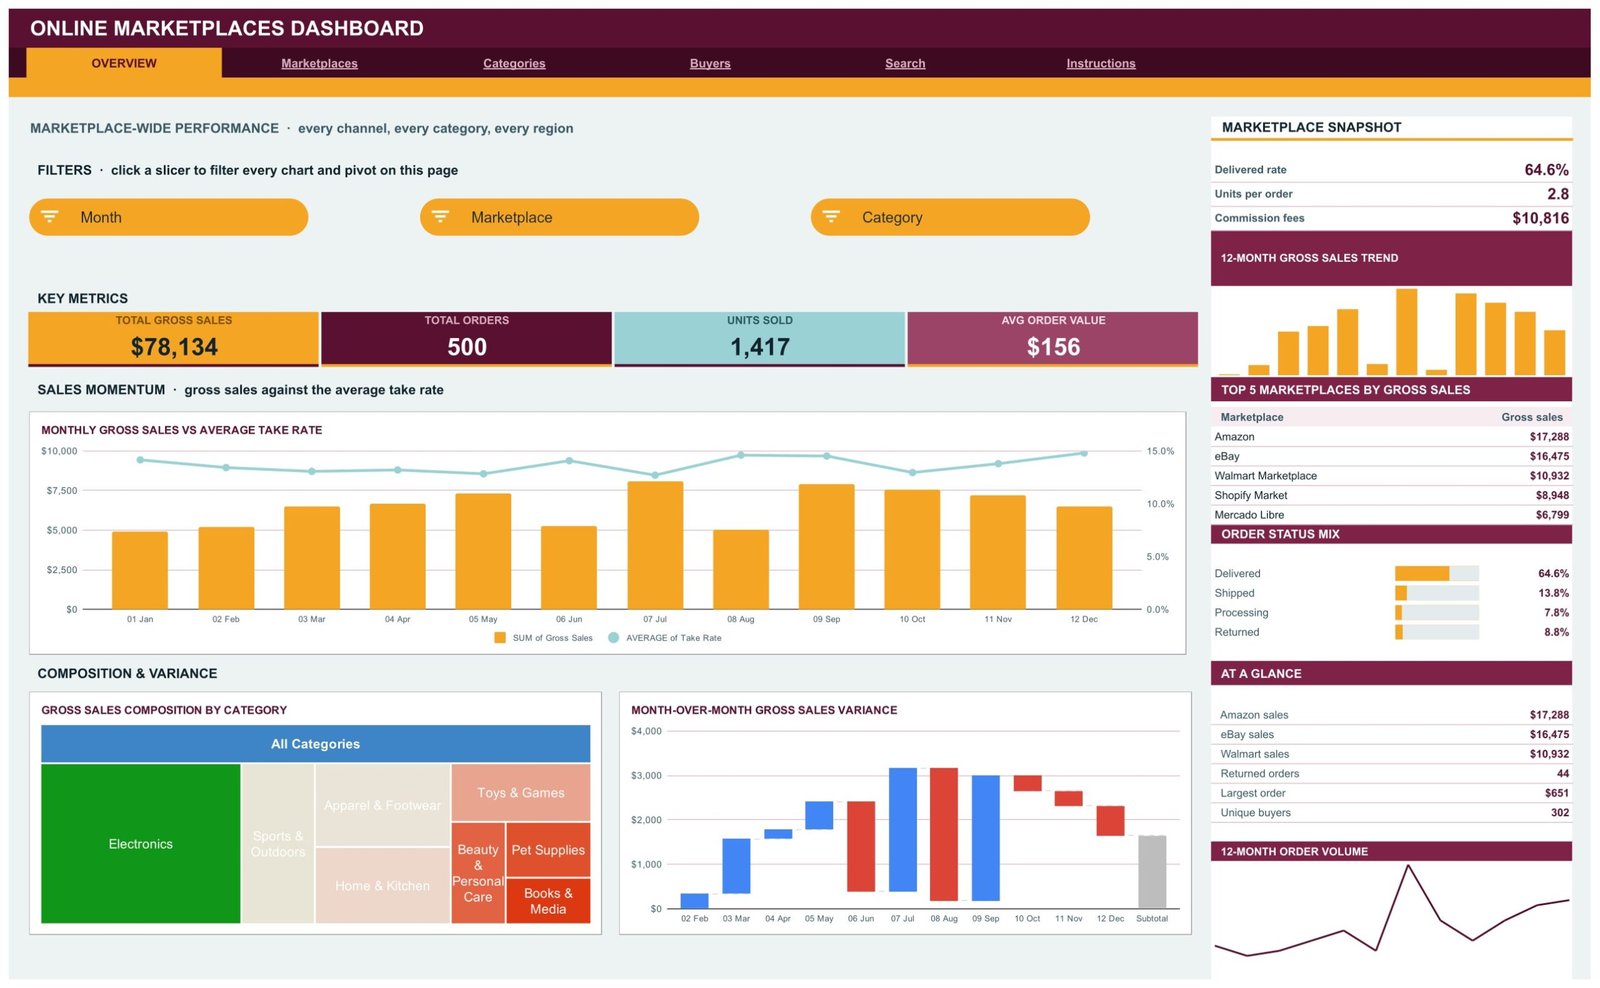
Page 1: Overview — marketplace-wide performance
The landing tab answers the “how did we do everywhere” question. Four KPI cards carry Total Gross Sales, Total Orders, Units Sold and Avg Order Value, under Month, Marketplace and Category slicers. The charts are Monthly Gross Sales vs Average Take Rate, Gross Sales Composition by Category and Month-over-Month Gross Sales Variance. The right rail stacks a Marketplace Snapshot (delivered rate 64.6%, units per order 2.8, commission fees $10,816), a 12-Month Gross Sales Trend, Top 5 Marketplaces by Gross Sales, an Order Status Mix list and an At a Glance table.
Page 2: Marketplaces — channel sales, fulfilment mix and commission cost
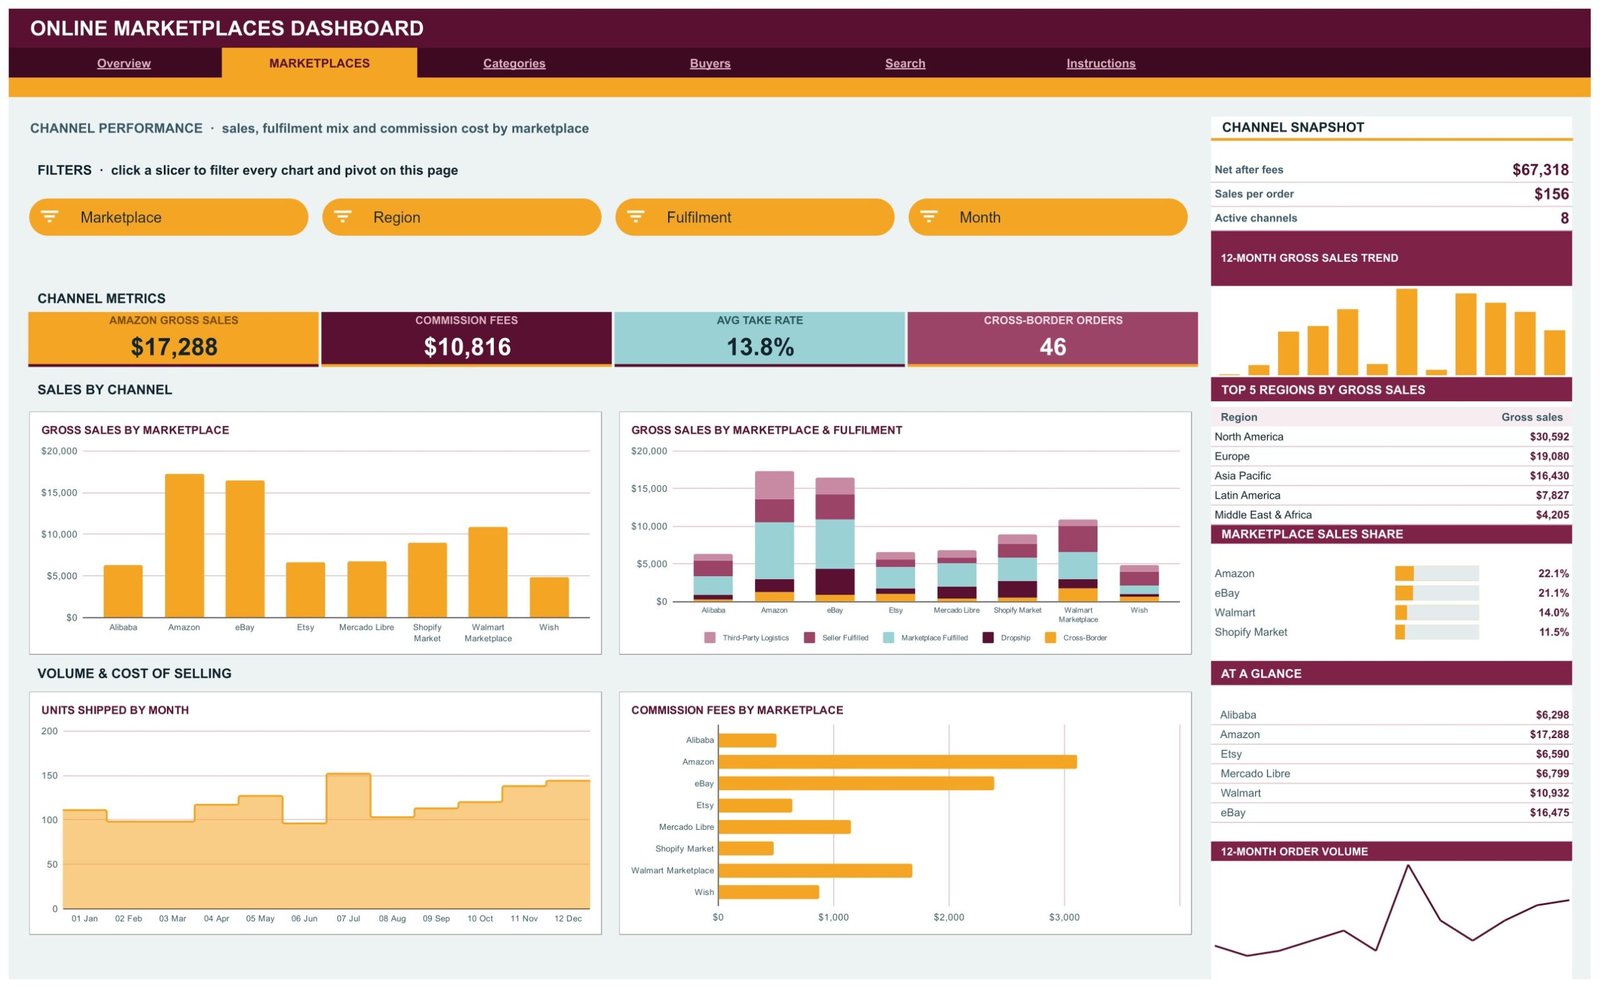
Eight channels sit side by side here: Alibaba, Amazon, eBay, Etsy, Mercado Libre, Shopify Market, Walmart Marketplace and Wish. KPI cards show Amazon Gross Sales $17,288, Commission Fees $10,816, Avg Take Rate 13.8% and Cross-Border Orders 46. The charts are Gross Sales by Marketplace, Gross Sales by Marketplace & Fulfilment, Units Shipped by Month and Commission Fees by Marketplace. The rail adds a Channel Snapshot with net-after-fees of $67,318, Top 5 Regions by Gross Sales and a Marketplace Sales Share list.
Page 3: Categories — catalogue performance and order outcomes
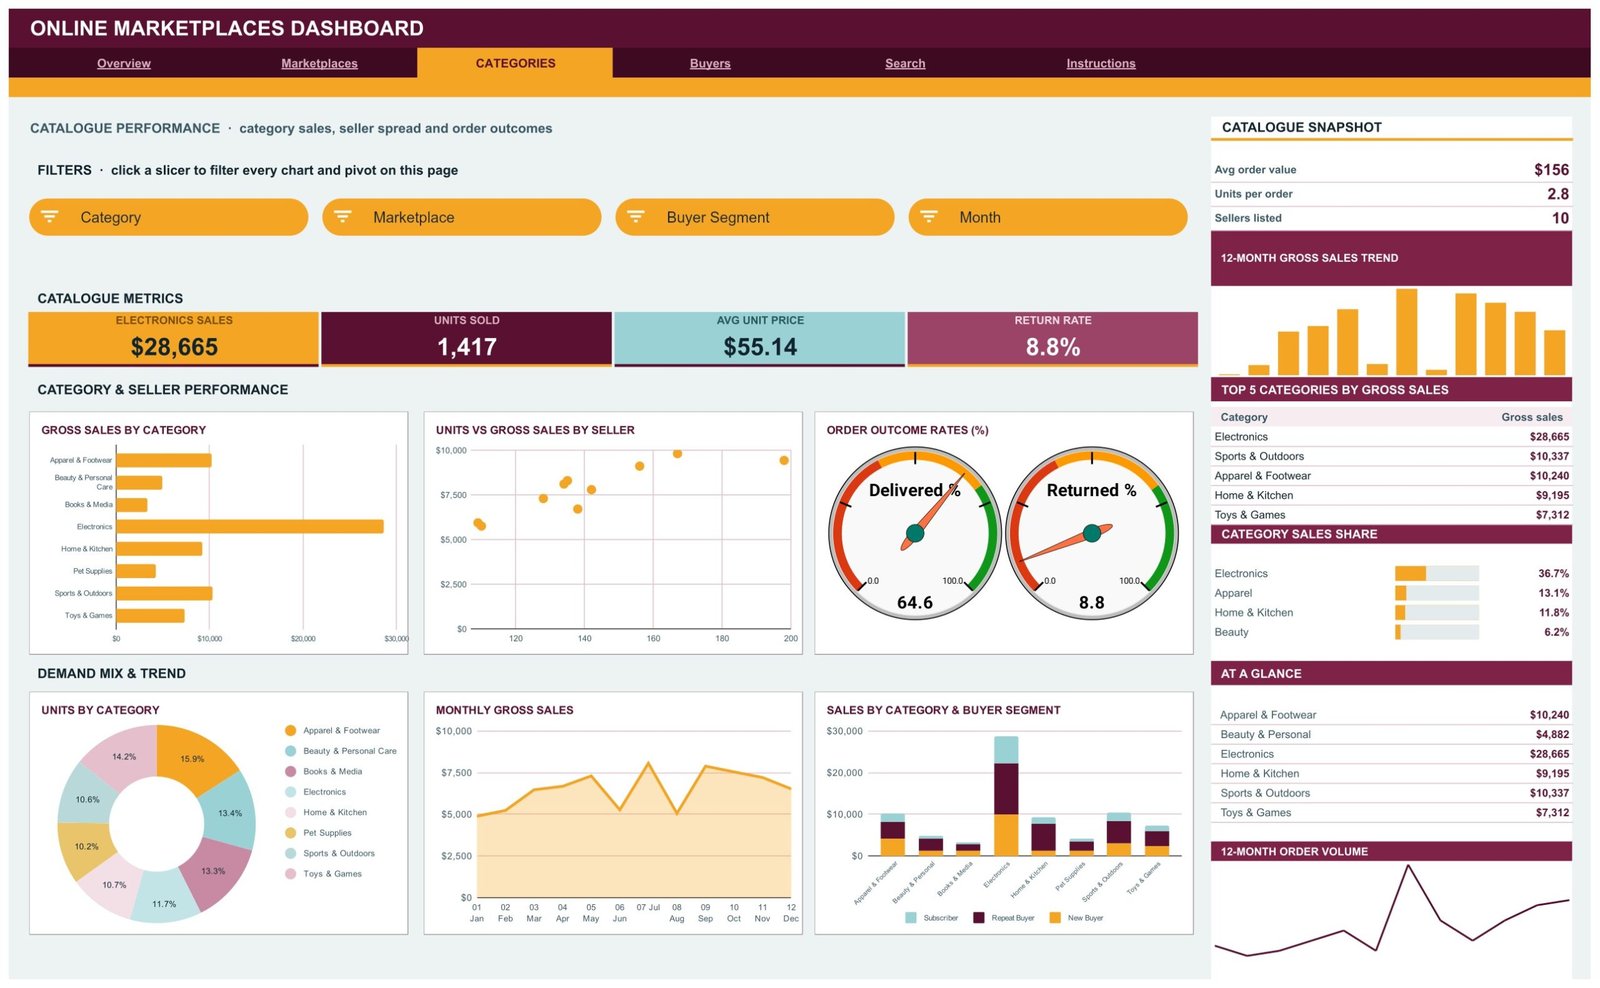
Eight categories — Apparel & Footwear, Beauty & Personal Care, Books & Media, Electronics, Home & Kitchen, Pet Supplies, Sports & Outdoors and Toys & Games — are measured against ten listed sellers. KPI cards read Electronics Sales $28,665, Units Sold 1,417, Avg Unit Price $55.14 and Return Rate 8.8%. The charts are Gross Sales by Category, Units vs Gross Sales by Seller, Order Outcome Rates, Units by Category, Monthly Gross Sales and Sales by Category & Buyer Segment, with twin gauges reading delivered and returned percentages.
Page 4: Buyers — who buys, how they pay, how it ships
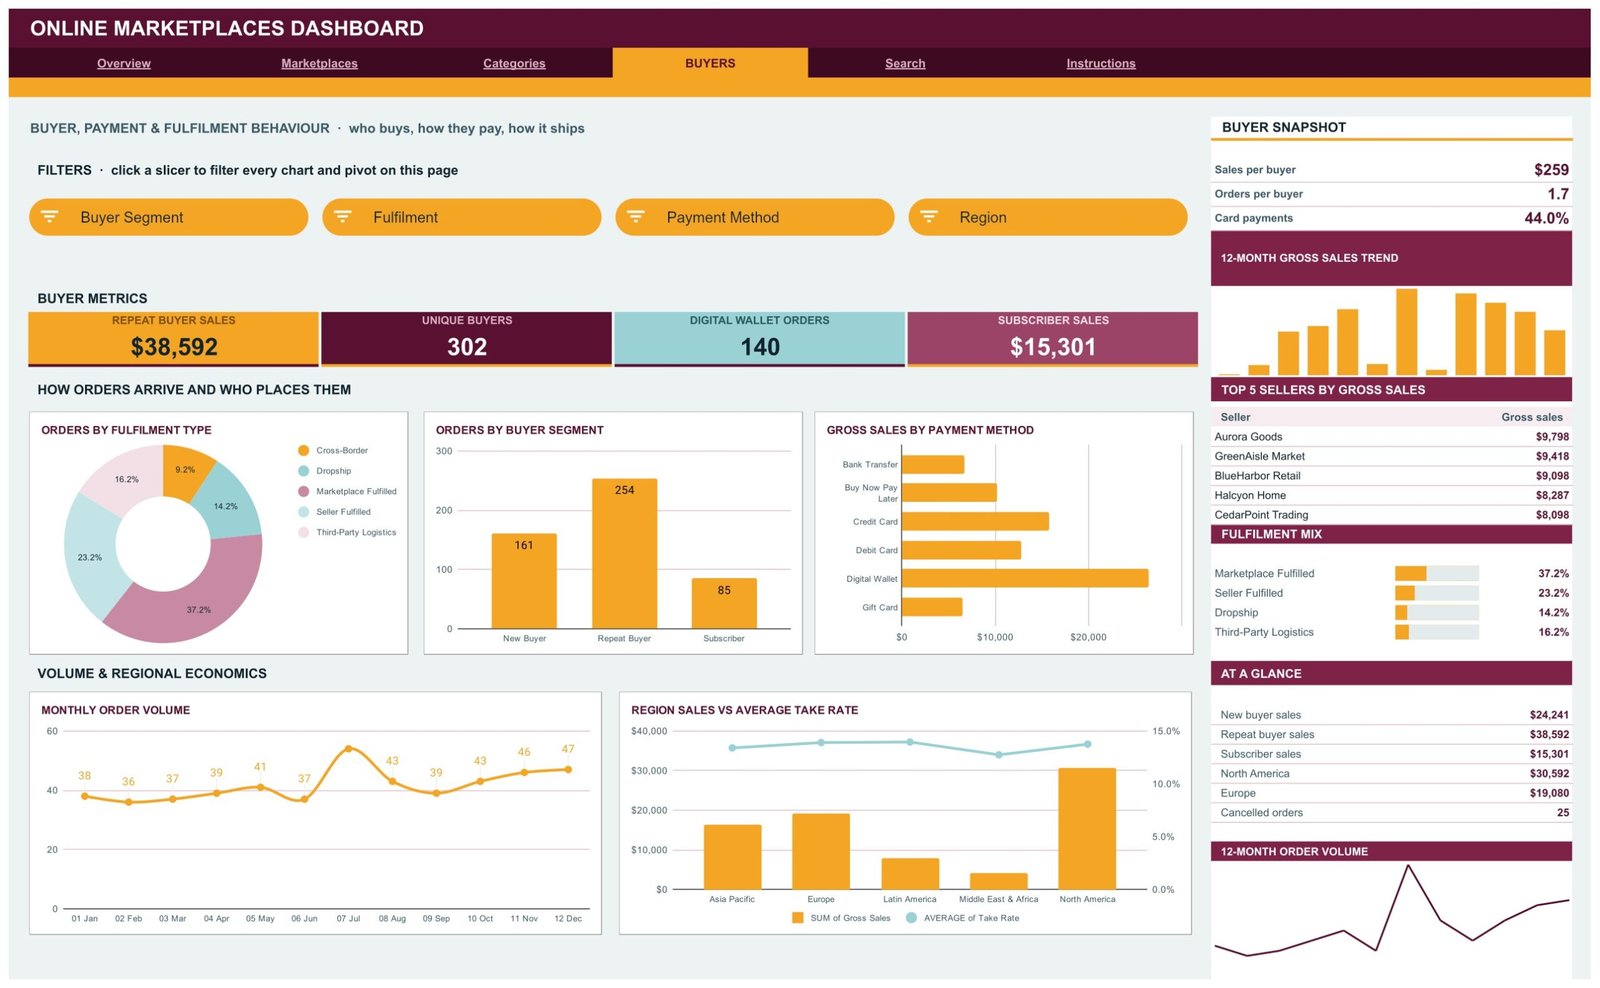
This tab splits demand across three buyer segments (New Buyer 161 orders, Repeat Buyer 254, Subscriber 85), six payment methods and five fulfilment types. KPI cards read Repeat Buyer Sales $38,592, Unique Buyers 302, Digital Wallet Orders 140 and Subscriber Sales $15,301. The charts are Orders by Fulfilment Type, Orders by Buyer Segment, Gross Sales by Payment Method, Monthly Order Volume and Region Sales vs Average Take Rate. The rail carries a Buyer Snapshot, Top 5 Sellers by Gross Sales and a Fulfilment Mix list.
Page 5: Search — order lookup
Choose an Order ID and the Order Details panel returns the whole record: order date, marketplace, category, seller, buyer name, fulfilment, gross sales, units, commission fee, region, payment method, order status, buyer segment, month and take rate. It is the page you open when a buyer disputes a charge.
Page 6: Instructions — the ten-step user guide
A plain-English guide to the whole file: how slicers drive a page, how to clear one with Select all, why the KPI cards stay unfiltered, how Take Rate is derived, how to swap in your own orders and how the 1,000-row auto-expand works. The About block records the pivot-plus-slicer architecture and the theme codes.
Online Marketplaces Dashboard in Google Sheets vs. a Microsoft Excel Dashboard vs. Sellerboard / Helium 10 — Feature Comparison
| Feature | Online Marketplaces Dashboard in Google Sheets | Microsoft Excel dashboard | Sellerboard / Helium 10 |
|---|---|---|---|
| Cost | Under $10 one-time ✅ | $13.99–$17.99 one-time | $19–$229 / month |
| Platform | Browser, any OS, no install ✅ | Desktop Excel | Vendor web app |
| Setup time | Under 10 minutes ✅ | Under 10 minutes | Account, API keys, channel authorisation |
| Real-time team collaboration | Native, multi-editor ✅ | Needs OneDrive co-authoring | Seat-based |
| Mobile access | Google Sheets app ✅ | Limited | Vendor app |
| Share with link | Yes, view or edit ✅ | File send or cloud link | Invite only |
| Automatic marketplace sync | No — you paste your order export | No | Yes ✅ |
| Edit the KPI and chart logic yourself | Yes, every formula is open ✅ | Yes | No |
| Year-1 cost at 5 users | One purchase, no seats ✅ | One purchase | $1,140–$13,740 |
For sellers who want one cross-channel view of sales, fees and buyers without paying a per-month seat fee for a tool they open at month-end, the Online Marketplaces Dashboard in Google Sheets sits in the sweet spot.
Who Should Use This Template
Perfect for:
- Multi-channel sellers listing on two or more of Amazon, eBay, Etsy, Walmart, Shopify or Alibaba
- E-commerce and account managers reporting gross sales, commission fees and return rate to an owner or client
- Agencies and virtual assistants who want a branded, shareable report rather than a raw CSV
- Finance and operations staff who need net-after-fees and take rate per channel before a pricing decision
Not a fit if:
- You need orders to arrive automatically — there is no marketplace API connection anywhere in this file
- You process more than 1,000 orders per reporting period and do not want to extend the ranges yourself
- You need live inventory, repricing or listing management — this reports on orders that already happened
- You are reconciling settlements for accounting or tax; the commission figures here are for internal analysis
Real-World Use Cases
Priya sells home and kitchen goods on Amazon, eBay and Etsy. Each month she exports three order reports, stacks them on the Data sheet and opens the Marketplaces tab. Commission Fees by Marketplace and the 13.8% average take rate showed her one channel was costing roughly three points more than the others — something three separate seller consoles had never put side by side.
Marco runs operations for a 12-person brand selling into five regions. He watches the repeat-buyer share and the digital-wallet mix on the Buyers tab, then shares a view-only link with the founders before the monthly call. Because the KPI cards stay unfiltered, his headline numbers match theirs even while he drills into one region.
Anita is a virtual assistant handling seller accounts for four small clients. She keeps one copy of the workbook per client, pastes each order export in, and hands over the same six-tab report to all four — without four seats of a subscription tool she would open once a month.
Advantages of the Online Marketplaces Dashboard in Google Sheets
The clearest advantage is cost shape. A subscription analytics tool bills every month whether you open it or not; this file is bought once and stays yours, with no per-user charge when a second person needs access. At five users the difference over a single year runs into four figures.
The second is transparency. Every KPI is a visible SUMIFS or COUNTIFS and every chart sits on a pivot you can scroll to and read. When a number looks wrong, you can trace it in about thirty seconds instead of filing a support ticket. That also means you can change the logic: add a channel, rename a category, swap a metric.
The third is distribution. A Google Sheets file shares with a link, opens on a phone, and needs no installation or macro permission, so a client or a co-founder can look at the same report you do without any setup on their side.
Opportunities for Improvement
Being straight about the limits: there is no API sync, so the monthly refresh is a manual export-and-paste. The 1,000-row ceiling is generous for a small seller and tight for a busy one — past that you extend the pivot and formula ranges by hand, which is easy but is still a job. The KPI cards ignore slicers by design, which is right for a stable reference number but does surprise people on first use, so read the Instructions tab before you decide something is broken. And because the sample sellers and buyer names are fictional, any narrative you build on the shipped data is illustrative only. Replace it before you show it to anyone.
Best Practices
- Keep one copy per client or per brand rather than stacking unrelated businesses into one Data sheet.
- Never rename the column headers on the Data sheet — the pivots, slicers and formulas all key off them.
- Archive each period to a separate copy before pasting the next export, so you keep a dated record.
- Use Select all to clear a slicer instead of deleting it; slicers are per-page and deleting one breaks that page.
- Recolour once, at the palette block, rather than restyling charts individually.
- If you are new to the underlying features, Google’s guides to pivot tables and slicers cover everything this workbook relies on.
Explore Relevant Templates
If you run a single storefront rather than several, the Seller Analytics Dashboard in Google Sheets covers listing and seller performance in more depth. Etsy-only sellers should look at the Etsy Seller Analytics Dashboard in Google Sheets instead.
For the supply side, the Drop Shipping Dashboard in Google Sheets tracks supplier lead times and margin per order, and the Shipping Dashboard in Google Sheets picks up carrier cost and delivery performance once the parcel leaves you. Sellers of digital or made-to-order goods may prefer the Print-on-Demand Sales Tracker in Google Sheets.
Also available as: Online Marketplaces Dashboard in Excel and Online Marketplaces Dashboard in Power BI. If you would rather have a month-picker scorecard with targets and traffic lights than four analysis pages, see the Online Marketplaces KPI Dashboard in Google Sheets.
Want to learn how pivot-driven dashboards like this are built? The Excel Pivot Tables & Dashboards course on NextGenTemplates Academy walks through it with practice files.
Get the Online Marketplaces Dashboard in Google Sheets
Frequently Asked Questions
Does the Online Marketplaces Dashboard in Google Sheets connect to Amazon or eBay automatically?
No. The Online Marketplaces Dashboard in Google Sheets has no API connection to Amazon, eBay, Etsy, Shopify, Walmart or any other marketplace. You export your order report from each channel and paste those rows onto the Data sheet, which is the only input the workbook needs.
How many orders can it handle?
Pivots, slicers and every formula are pre-stretched to 1,000 data rows and the file ships with 500 sample orders. Paste new rows anywhere up to row 1001 and the dashboard updates on its own. Beyond 1,000 you extend the pivot and formula ranges manually.
What KPIs does the dashboard track?
It carries 16 KPI cards over four pages: gross sales, orders, units and average order value on Overview; Amazon gross sales, commission fees, average take rate and cross-border orders on Marketplaces; category sales, units, average unit price and return rate on Categories; and repeat-buyer sales, unique buyers, digital wallet orders and subscriber sales on Buyers.
Why don’t the KPI cards react to the slicers?
That is intentional. The KPI cards and the At a Glance lists read the Data sheet through SUMIFS and COUNTIFS, so they always show whole-period totals and give you a fixed reference point, while the charts, pivots and Top 5 panels respond to the slicers on that page.
How does it compare to Sellerboard or Helium 10?
Those platforms sync marketplace data automatically and bill $19 to $229 a month. This template is a one-time purchase with no seat fees and fully editable formulas, but you paste the order export yourself. It suits periodic reporting rather than live operational monitoring.
How long does setup take?
Under 10 minutes. Copy the sheet from the link in the PDF, delete the 500 sample rows on the Data sheet, paste your own orders with the headers unchanged, and all six tabs recalculate. Rebranding the colours takes another two minutes in the palette block.
Does it work on a Mac or a phone?
Yes. It runs in any browser and in the Google Sheets mobile app on Windows, macOS, ChromeOS, iOS and Android. There is nothing to install and no macros are used, so none of the usual Windows-only restrictions apply.
About the Author
Built by PK — Microsoft Certified Professional with 15+ years of Excel, Google Sheets and Power BI experience. Founder of NextGenTemplates, reaching 300K+ subscribers across YouTube channels. Every template is hand-built and tested before release.
Conclusion
If your sales live in four seller consoles and your reporting lives in a spreadsheet you rebuild every month, the Online Marketplaces Dashboard in Google Sheets replaces that rebuild with a paste. Six tabs, 16 KPI cards, 18 charts and 15 slicers, all open to edit, all shareable with a link — provided you are happy to bring the order export yourself.
Instant download · One-time payment · No subscription
Last updated: September 2026