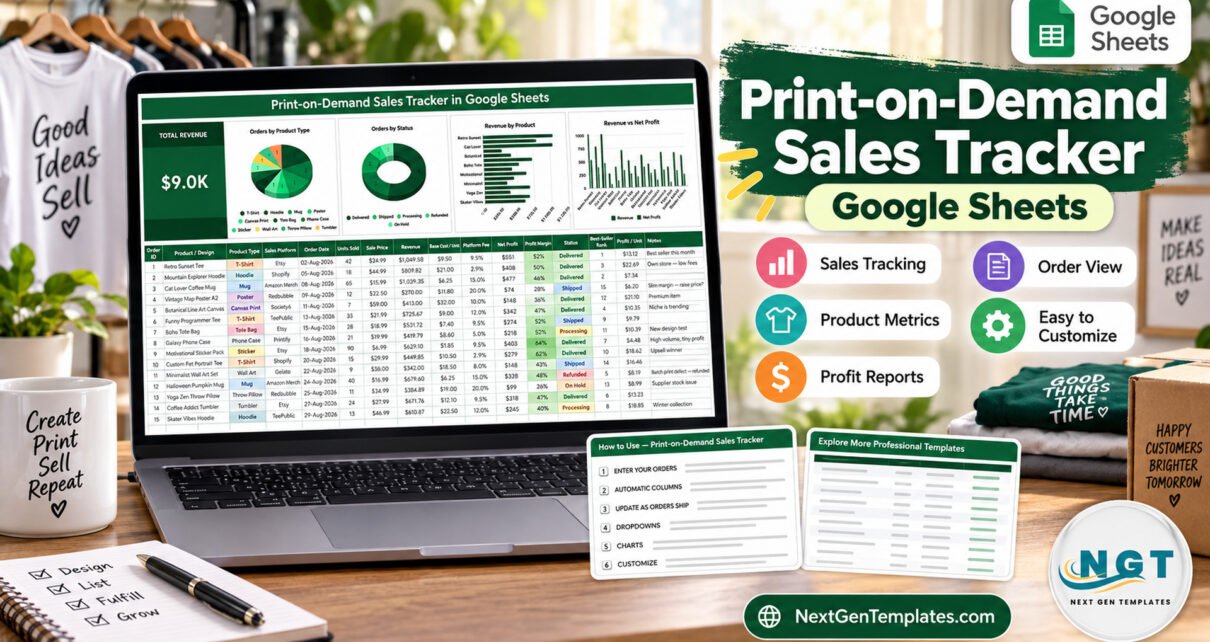
A print-on-demand shop can look busy while its margins quietly shrink. This print on demand sales tracker puts orders, base costs, platform fees and profit into one Google Sheets page, so sellers can see which designs really pay. The Print-on-Demand Sales Tracker in Google Sheets combines a Total Revenue card ($9.0K in the demonstration data), four charts and a 16-column order register with formulas for revenue, net profit, profit margin, profit per unit and best-seller rank.
The tracker is deliberately transparent. You enter or paste each order; the formulas do the arithmetic. It has no API connection to any marketplace or print provider, and the platform names in the sample rows are editable labels only.
Get the Print-on-Demand Sales Tracker in Google Sheets

The tracker page with its revenue card, four charts and order register
Key Features of Print-on-Demand Sales Tracker in Google Sheets
- Total Revenue headline card.
- Orders by Product Type chart.
- Orders by Status chart.
- Revenue by Product ranking.
- Revenue vs Net Profit comparison for each design.
- Formula columns for Order ID, Revenue, Net Profit, Profit Margin, Best-Seller Rank and Profit / Unit.
- A red flag on any order that makes a net loss.
- Editable Product Type, Sales Platform and Status dropdowns fed by the List tab.
- A How to Use tab with setup and customisation notes.
Dashboard and Tracker Structure Explained
Total Revenue
The large card on the left totals the Revenue column. As you replace the 15 sample orders with your own, the figure updates immediately. Use it as a quick pulse check, then look at net profit in the charts and register for the real picture.
Orders by Product Type
This pie chart counts orders for each product type. The sample covers T-shirts, hoodies, mugs, posters, canvas prints, tote bags, phone cases, stickers, wall art, throw pillows and tumblers, and every label can be changed on the List tab.
Orders by Status
A doughnut chart shows how many orders are Delivered, Shipped, Processing, Refunded or On Hold. Cancelled is also available in the dropdown. In the sample, eight of fifteen orders are delivered.
Revenue by Product
A horizontal bar chart compares revenue for each design, which makes the strongest sellers obvious at a glance.
Revenue vs Net Profit
This column chart places each design’s revenue next to its net profit. It is the most useful view for print-on-demand sellers, because a design with high sales and a thin margin can earn less than a quieter design with a better price.
The 16-column order register
The register holds Order ID, Product / Design, Product Type, Sales Platform, Order Date, Units Sold, Sale Price, Revenue, Base Cost / Unit, Platform Fee, Net Profit, Profit Margin, Status, Best-Seller Rank, Profit / Unit and Notes. You fill eight input fields; the rest calculate. For example, the first sample order sells 42 units at $24.99 for $1,049.58 in revenue. After a $9.50 base cost per unit and a 9.5% platform fee, the row shows about $551 net profit, a 52% margin and $13.12 profit per unit.
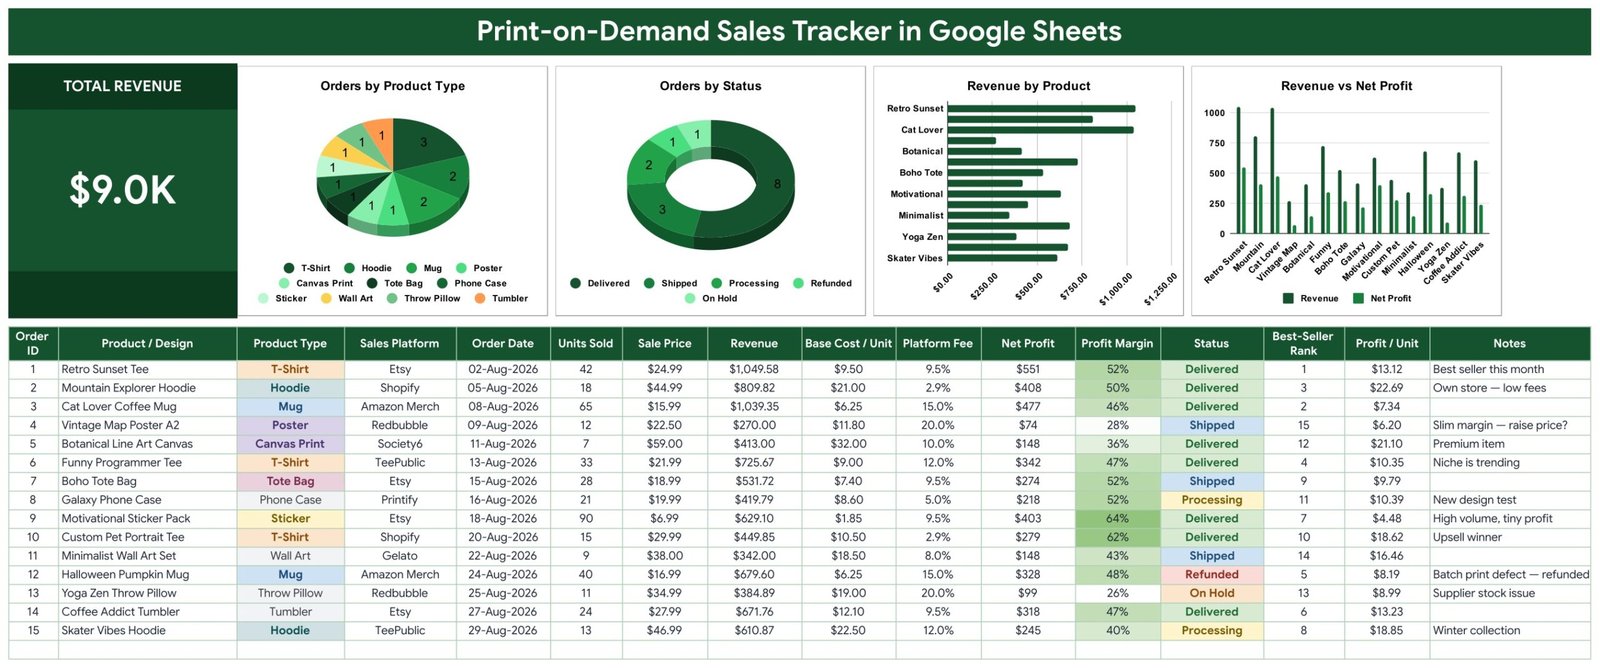
The actual tracker page with 15 sample orders
How to Set Up the Print on Demand Sales Tracker
- Open the PDF from your download and use its link to make your own copy in Google Drive.
- Replace the sample orders with your own. Fill Product / Design, Product Type, Sales Platform, Order Date, Units Sold, Sale Price, Base Cost / Unit and Platform Fee.
- Update Status as each order moves from Processing to Shipped to Delivered, or to Refunded, On Hold or Cancelled.
- Add new marketplaces or product types on the List tab; they appear in the dropdowns automatically.
- Switch the currency with Google Sheets number formatting if you sell in rupees, euros or pounds.
- Optional: follow the instructions tab to show the dropdowns as coloured chips through Data validation.
Google Sheets Tracker vs Excel vs Seller Analytics Software
| Feature | Google Sheets tracker | Excel tracker | Seller analytics software |
|---|---|---|---|
| Pricing | One-time purchase | Template plus Excel access | Usually recurring |
| Setup | Make a Drive copy | Download and configure | Account setup and store connection |
| Collaboration | Native Drive sharing | Microsoft setup dependent | Seat and plan dependent |
| Profit formulas | Visible and editable | Workbook dependent | Often hidden |
| Automatic order import | Not included | Not normally included | Often available |
Who Should Use This Template
Independent designers can compare designs across several storefronts. Small print-on-demand brands can review margin by product type before adding new lines. Side-hustle sellers get a simple record without paying for software. Sellers who need automatic order syncing, inventory from suppliers, shipping or tax calculations will need additional tools.
Real-World Use Cases
Sara compares tees and hoodies
Sara sells on two marketplaces and her own store. The Revenue vs Net Profit chart shows that a lower-volume hoodie earns more per unit than her best-selling tee, so she reviews the tee price.
James checks tiny-margin items
James sells sticker packs in high volume. Profit / Unit shows how little each unit earns after the fee, which helps him decide whether to bundle them.
A studio tracks refunds and holds
A two-person studio records a refunded batch and a supplier delay with the Status and Notes columns, and checks Orders by Status each week.
Advantages
Revenue and profit sit side by side. Formulas are visible, not a black box. Dropdowns keep platform and product names consistent. Charts update with every new order. A one-time template avoids another subscription.
Opportunities for Improvement
The sheet does not import orders from any marketplace or print provider, and it does not account for shipping, taxes, discounts, ad spend or payout timing. Net Profit is revenue minus base cost and the platform fee percentage only, so sellers with more complex costs should add columns in their own copy.
Best Practices
- Enter the base cost you actually pay per unit, not an estimate from months ago.
- Use each platform’s current fee percentage.
- Keep product type and platform names on the List tab tidy.
- Update Status promptly, especially refunds.
- Review the Revenue vs Net Profit chart before raising ad spend on a design.
- Limit access with the Google Drive sharing settings.
Explore Relevant Templates
Read the Etsy Seller Analytics Dashboard in Google Sheets guide, the Drop Shipping Dashboard walkthrough and the Side Hustle Income Tracker guide. On the store, the Seller Analytics Dashboard and Inventory Tracker support related workflows.
If you want to get comfortable building trackers like this yourself, the NextGenTemplates Academy learning paths teach the spreadsheet skills behind them, with practice files.
Frequently Asked Questions
Does it connect to my marketplace or print provider?
No. There is no API connection; orders are entered or pasted manually.
Can I add my own platforms and product types?
Yes. Add them on the List tab and they appear in the dropdowns.
Do the charts update automatically?
Yes. All four charts read the order register directly.
Can I change the currency?
Yes. Change the number format on the money columns.
Does it calculate shipping or tax?
No. Net Profit covers base cost and platform fee only.
Can several people use it?
Yes, according to the Drive permissions you set on your copy.
About the Author
Built by PK – Microsoft Certified Professional with 15+ years of Excel, Google Sheets and Power BI experience. Founder of NextGenTemplates, reaching 300K+ subscribers across YouTube channels.
Conclusion
The Print-on-Demand Sales Tracker in Google Sheets gives sellers a clear, editable view of revenue, net profit and best sellers without hiding the formulas. Keep costs and fees current, update order status as you go, and let the charts point you to the designs worth promoting.