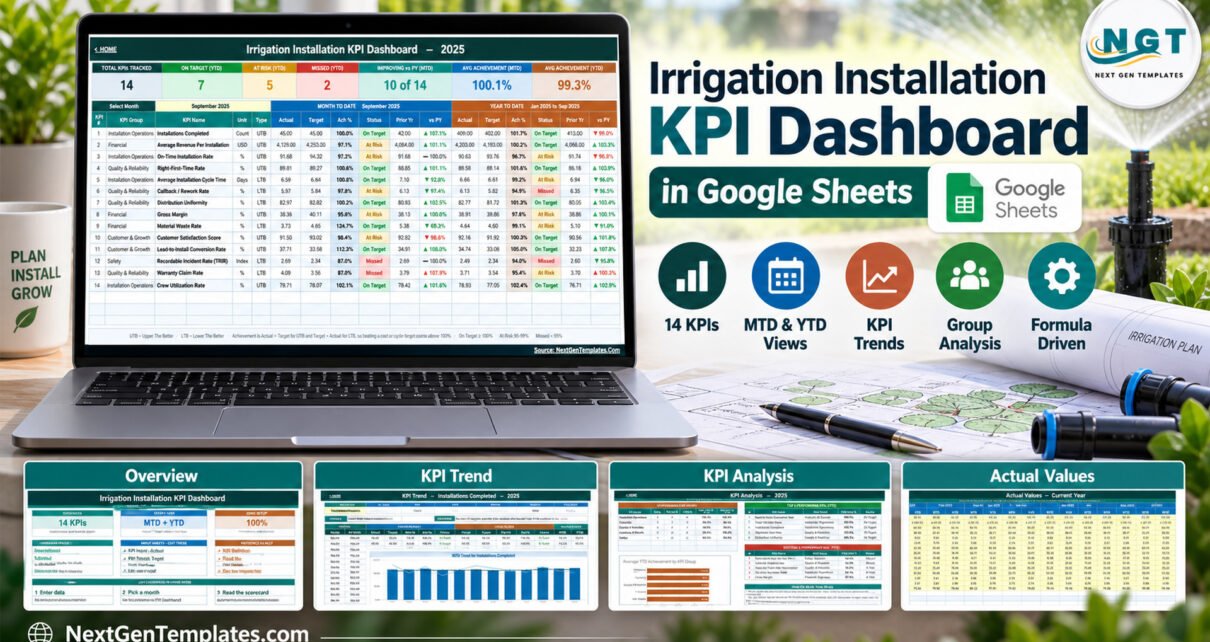
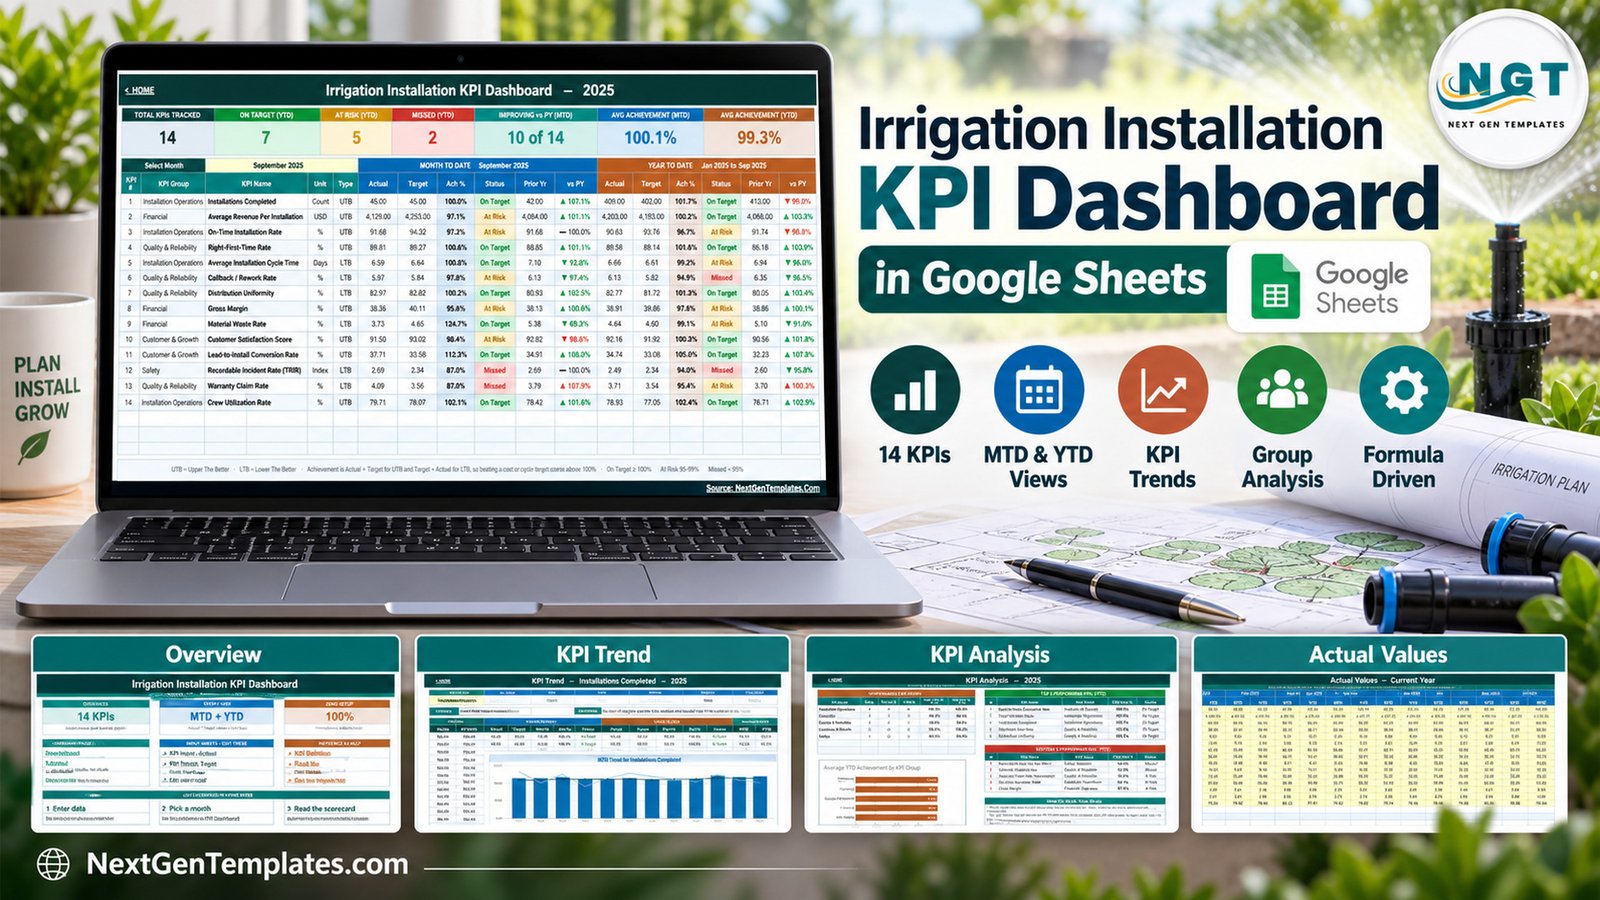
The Irrigation Installation KPI Dashboard in Google Sheets tracks 14 KPIs in five groups on one month-driven scorecard. It shows MTD and YTD actual, target, achievement %, traffic-light status and prior-year movement for every KPI, plus a KPI Trend page with two twelve-month charts and a KPI Analysis page that ranks the top 5 and bottom 5 KPIs for the year. The sheets have room for 22 KPIs, and every number is a worksheet formula with no add-on or script.Irrigation Installation KPI Dashboard in Google Sheets
Irrigation installers juggle a lot of monthly numbers: jobs completed, cycle days, callbacks, margin, waste, customer feedback and safety. Those figures usually live in separate job lists and spreadsheets, so nobody sees at a glance which ones are slipping. This Google Sheets KPI dashboard puts them on one page and scores each against its target and last year, so a monthly review starts with facts instead of a hunt for data.Irrigation Installation KPI Dashboard in Google Sheets
Get the Irrigation Installation KPI Dashboard in Google Sheets
Key Features of the Irrigation Installation KPI Dashboard in Google Sheets
- 14 KPIs in five groups: Installation Operations (4), Quality & Reliability (4), Financial (3), Customer & Growth (2) and Safety (1).Irrigation Installation KPI Dashboard in Google Sheets
- One month dropdown: the Select Month cell on the KPI Dashboard drives the scorecard, the seven summary cards and the whole KPI Analysis page.
- MTD and YTD side by side: Actual, Target, Achievement %, Status, Prior Year and vs PY for each KPI.Irrigation Installation KPI Dashboard in Google Sheets
- Direction-aware scoring: 9 upper-the-better (UTB) and 5 lower-the-better (LTB) KPIs. Achievement is Actual ÷ Target for UTB and Target ÷ Actual for LTB, so beating a cycle-time or callback target scores above 100%.
- Traffic lights: On Target from 100%, At Risk from 95%, Missed below 95%. The thresholds sit in the Status formulas and can be edited.
- Colour-coded arrows: the vs PY arrow shows the raw direction, and its colour shows whether that direction is good for the KPI.Irrigation Installation KPI Dashboard in Google Sheets
- Room for 22 KPIs: add, rename or clear KPIs on KPI Definition and every sheet follows without formula edits.Irrigation Installation KPI Dashboard in Google Sheets
Dashboard Pages Explanation
Home
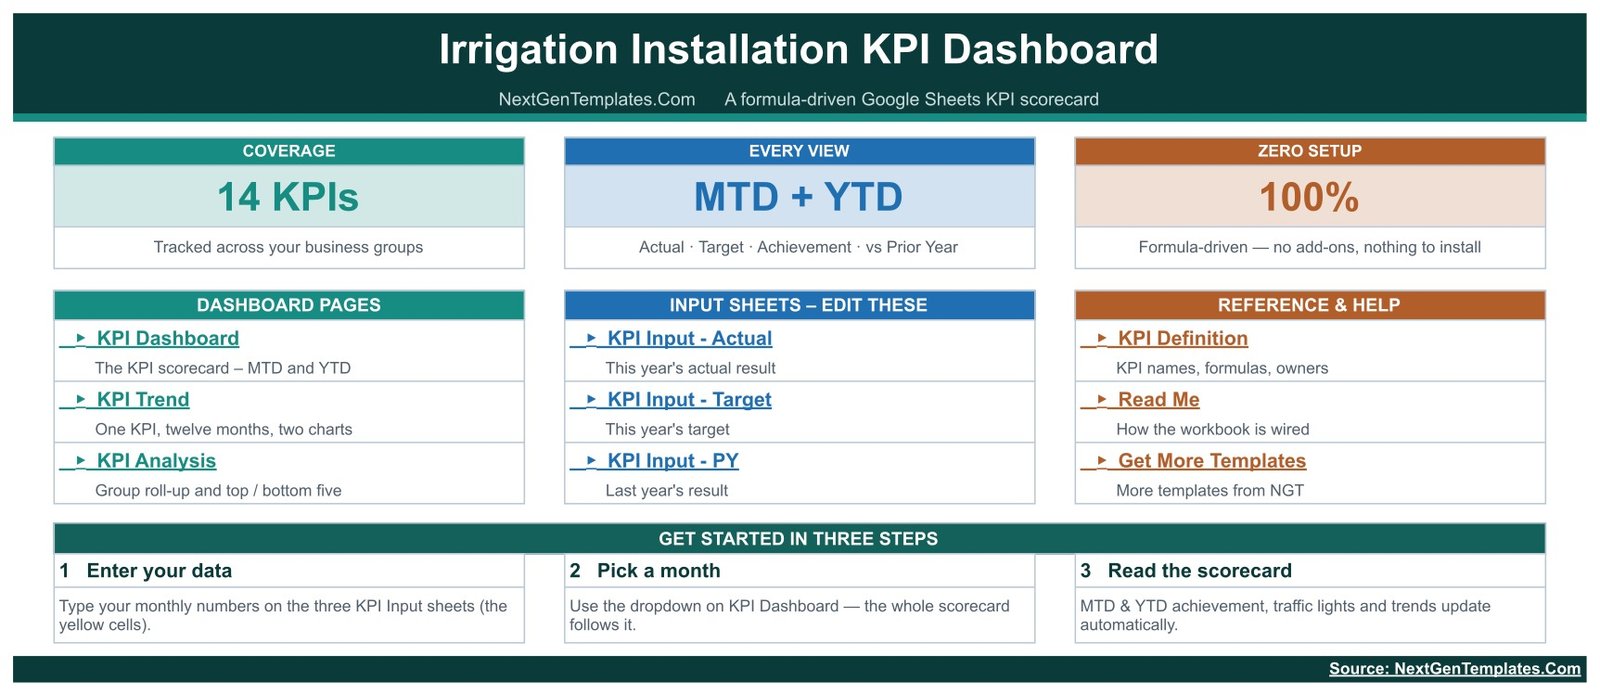
The Home page shows three headline cards (14 KPIs, MTD + YTD, zero setup), links to the three dashboard pages, the three input sheets and the reference pages, and a three-step getting-started strip: enter your data, pick a month, read the scorecard.
KPI Dashboard
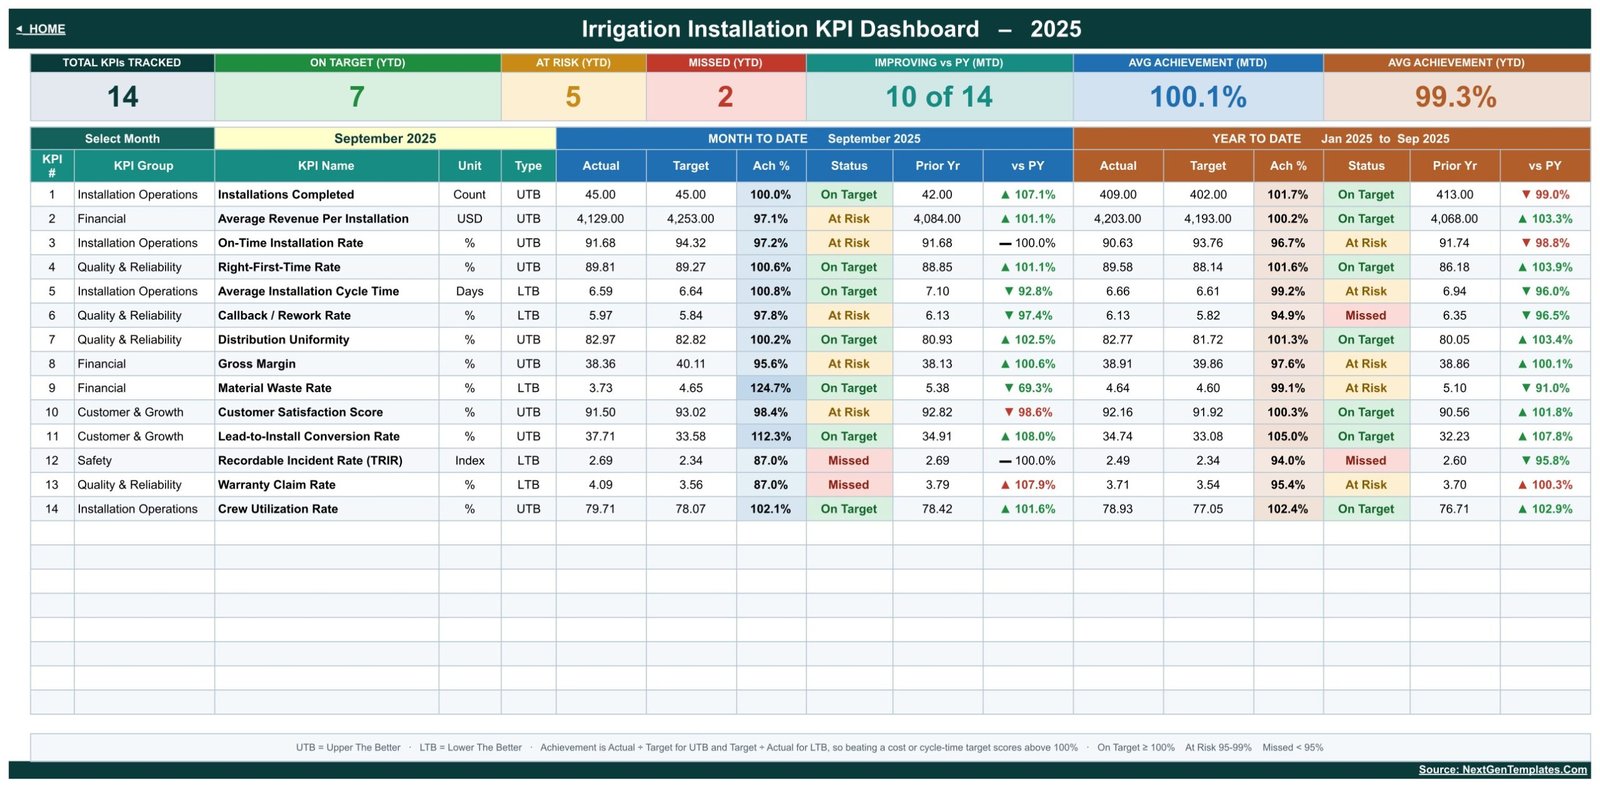
Seven summary cards sit above a 14-row scorecard: Total KPIs Tracked, On Target (YTD), At Risk (YTD), Missed (YTD), Improving vs PY (MTD), Avg Achievement (MTD) and Avg Achievement (YTD). In the September 2025 sample data, 7 KPIs are On Target, 5 are At Risk and 2 are Missed for the year to date, 10 of 14 are improving on last year, and average achievement is 100.1% MTD and 99.3% YTD.Irrigation Installation KPI Dashboard in Google Sheets
KPI Trend
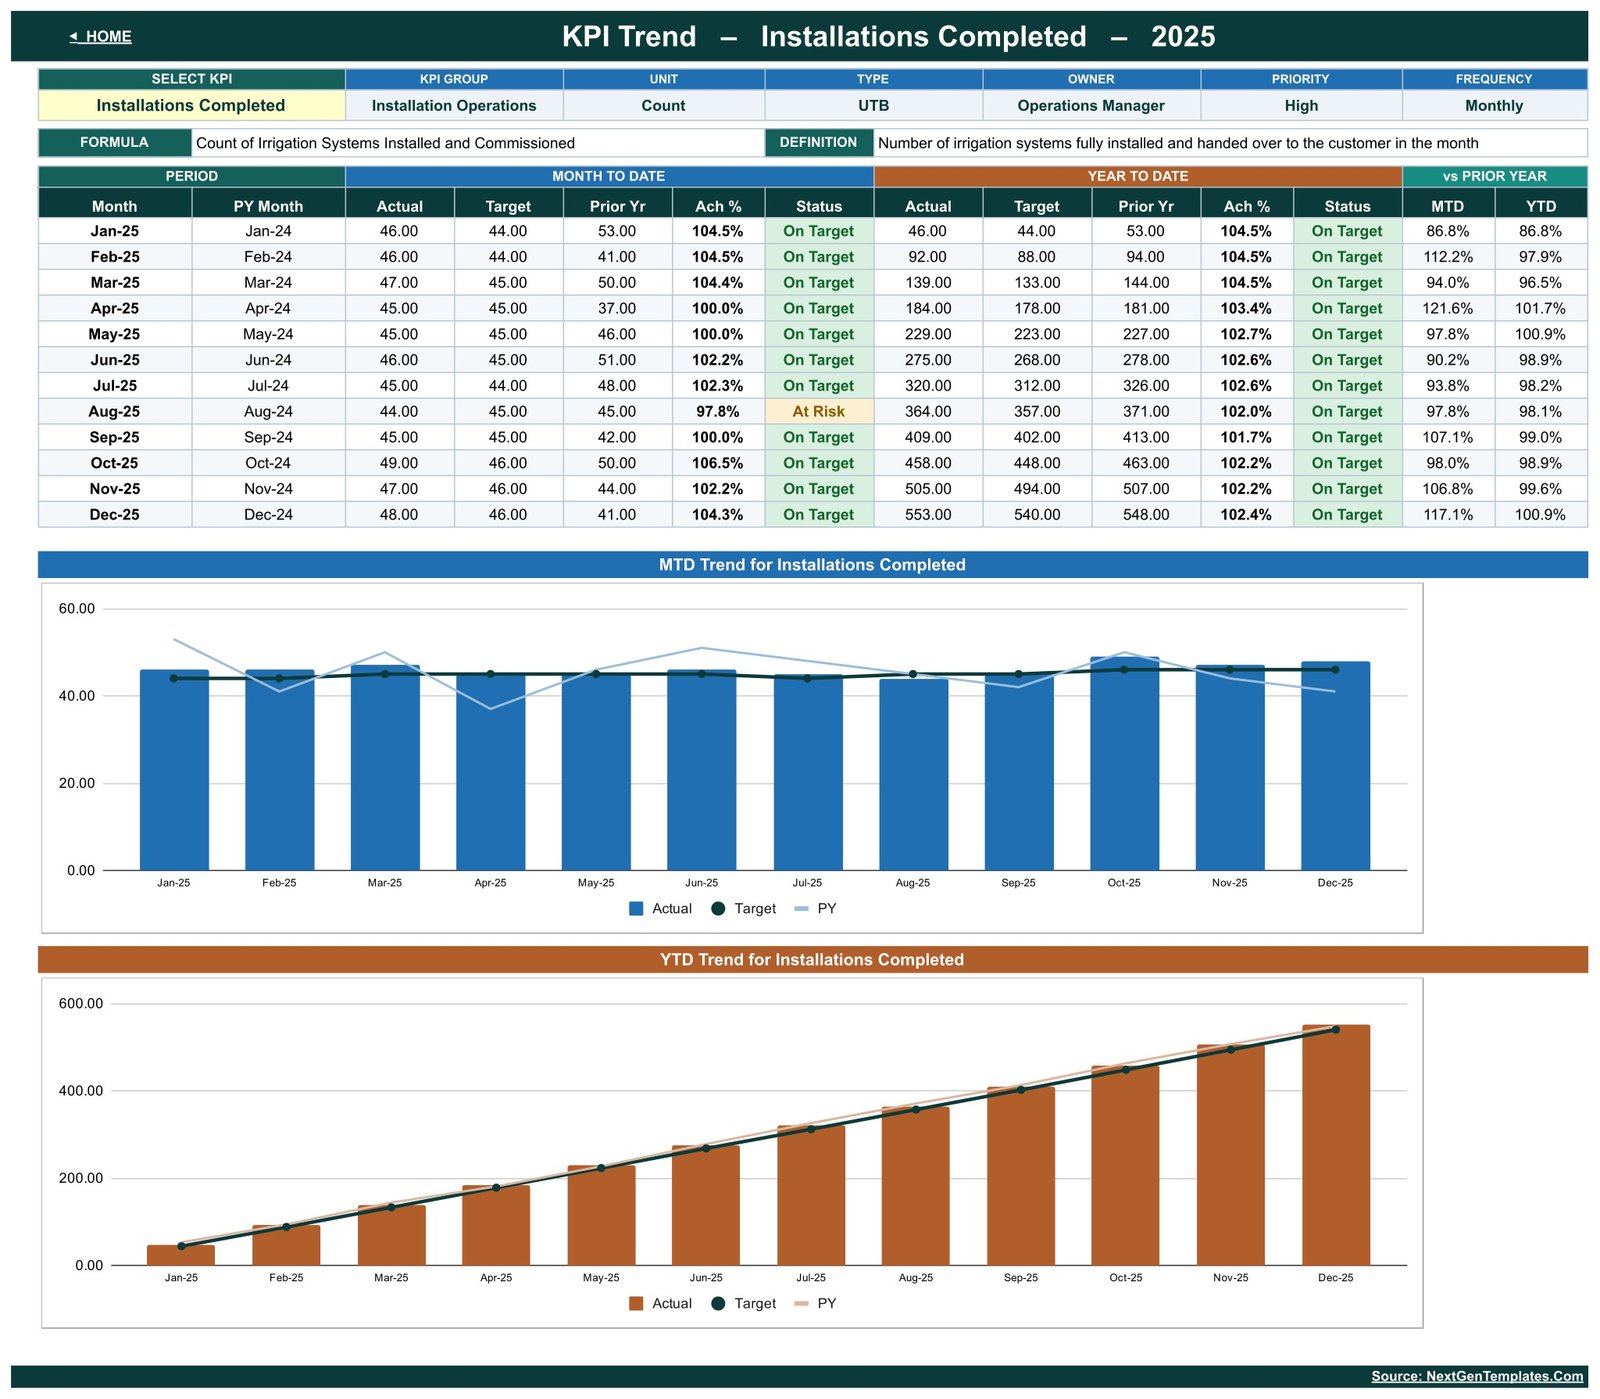
Choose a KPI from the dropdown to see its group, unit, type, owner, priority, frequency, formula and definition. A Jan-Dec table lists MTD and YTD actual, target, prior year, achievement and status, with MTD and YTD vs prior year. Two charts, MTD Trend and YTD Trend, plot Actual as columns with Target and Prior Year lines.Irrigation Installation KPI Dashboard in Google Sheets
KPI Analysis
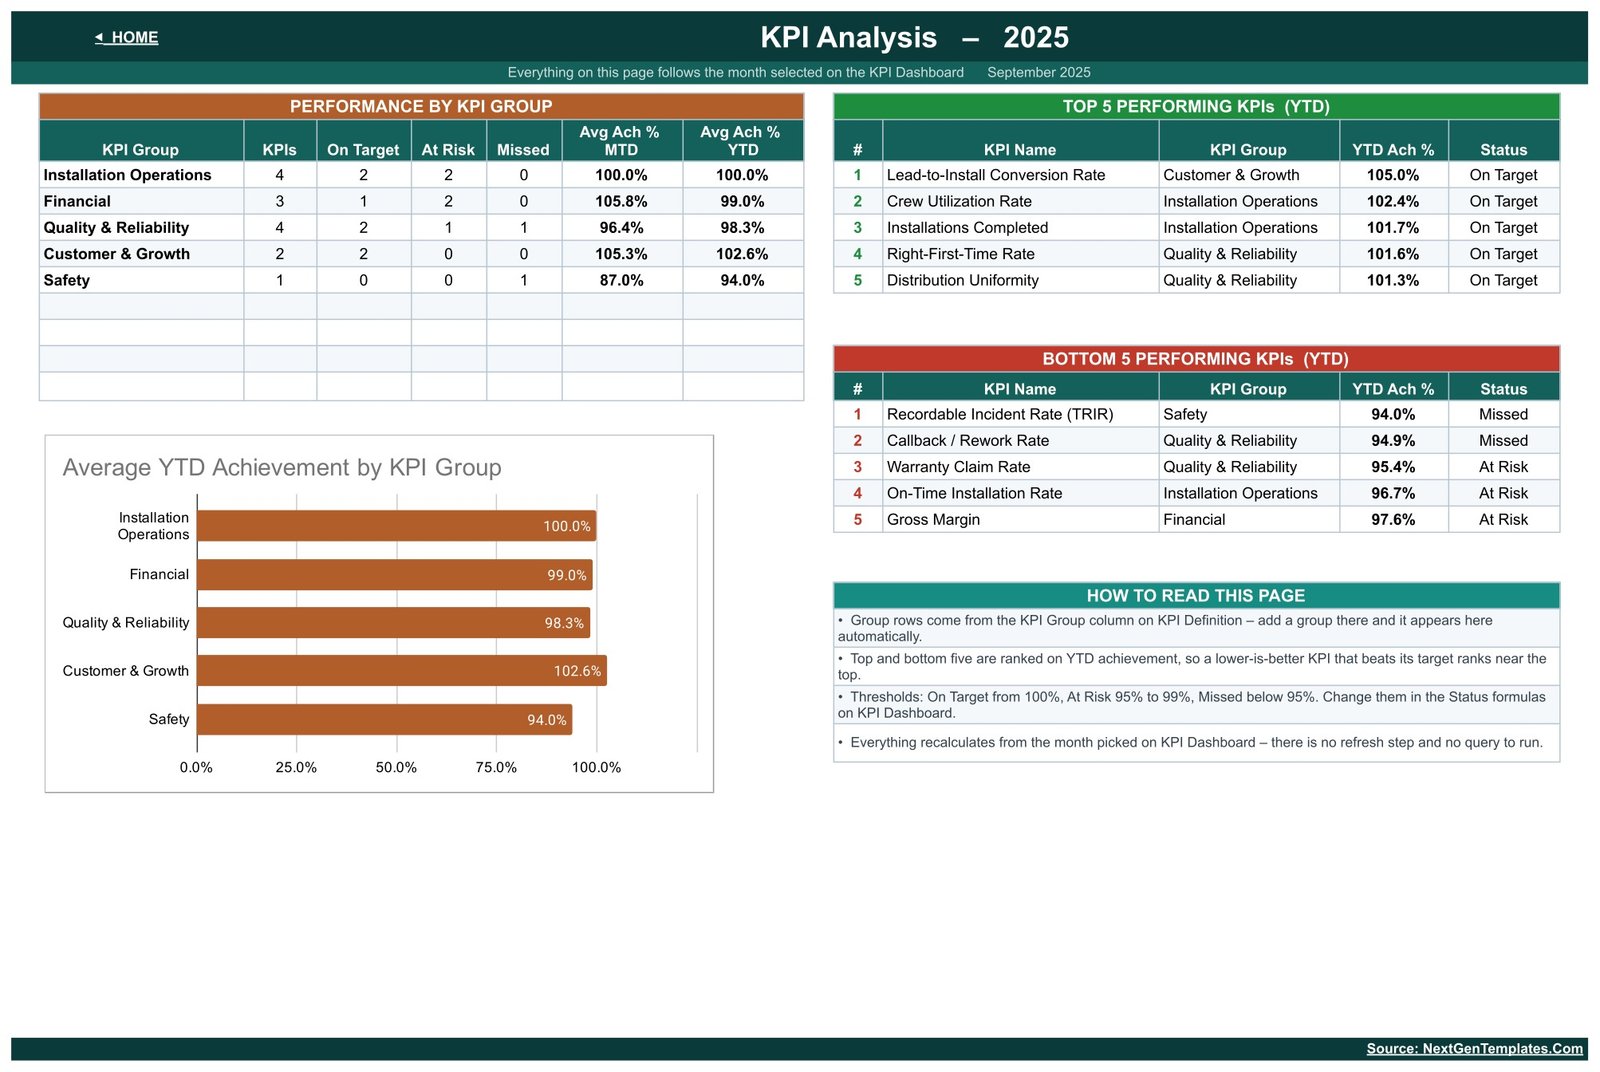
Performance by KPI Group lists each group’s KPI count, On Target, At Risk and Missed counts, and average MTD and YTD achievement. An Average YTD Achievement by KPI Group chart sits below it, and two tables rank the Top 5 and Bottom 5 KPIs on YTD achievement. In the sample, Lead-to-Install Conversion Rate leads at 105.0% and Recordable Incident Rate (TRIR) is last at 94.0%.Irrigation Installation KPI Dashboard in Google Sheets
KPI Input Sheets (Actual, Target, PY)
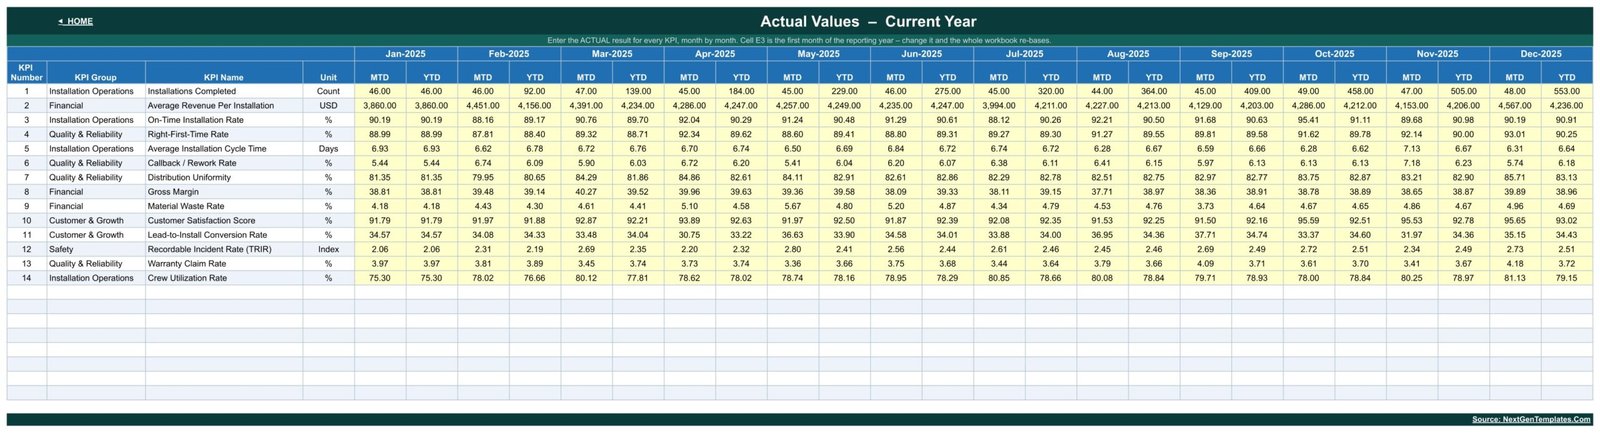
KPI Input – Actual, KPI Input – Target and KPI Input – PY each hold one row per KPI with an MTD and a YTD column for every month. Cell E3 on the Actual sheet sets the first month of the reporting year, and the other sheets, the month dropdown and the titles re-base from it.Irrigation Installation KPI Dashboard in Google Sheets
KPI Definition
The master KPI list holds number, group, name, unit, formula, definition, type, owner, priority and frequency. The 14 sample KPIs are Installations Completed, Average Revenue Per Installation, On-Time Installation Rate, Right-First-Time Rate, Average Installation Cycle Time, Callback / Rework Rate, Distribution Uniformity, Gross Margin, Material Waste Rate, Customer Satisfaction Score, Lead-to-Install Conversion Rate, Recordable Incident Rate (TRIR), Warranty Claim Rate and Crew Utilization Rate.Irrigation Installation KPI Dashboard in Google Sheets

Irrigation Installation KPI Dashboard vs. Excel KPI Workbook vs. Field Service Software — Feature Comparison
| Feature | Irrigation Installation KPI Dashboard in Google Sheets | Microsoft Excel KPI workbook | Field service software (e.g. Jobber, ServiceTitan) |
|---|---|---|---|
| Cost | ✅ $8.99 one-time | Template price plus an Excel licence | Recurring subscription |
| Platform | ✅ Browser, any Google account | Excel desktop or Excel for the web | Vendor web and mobile apps |
| Setup time | ✅ Make a copy, type your numbers | Download and enter data | Onboarding and data migration |
| Real-time team collaboration | ✅ Google Sheets sharing | Via OneDrive/SharePoint | ✅ Built in |
| Mobile access | Google Sheets app (best on desktop) | Excel mobile app | ✅ Native apps |
| Customizable KPIs | ✅ Up to 22, edit on one sheet | Depends on the build | Limited to vendor reports |
| Share with link | ✅ Yes | Yes, with Microsoft 365 | User seats required |
| Year-1 cost at 5 users | ✅ $8.99 total | Template plus licences | Per-user subscription × 12 months |
| Job scheduling, dispatch and invoicing | ❌ No (KPI reporting only) | ❌ No | ✅ Yes |
For irrigation contractors who want a monthly KPI scorecard without paying for seats in a field service platform, this Google Sheets template sits in the sweet spot.Irrigation Installation KPI Dashboard in Google Sheets
Who Should Use This Template
Perfect for:
- Owners and operations managers of residential or commercial irrigation installation businesses
- Landscape contractors with an irrigation crew who run a monthly performance review
- Consultants who build KPI packs for green-industry clients
Not a fit if:
- You need scheduling, dispatch, quoting or invoicing software
- You need irrigation design, water-use, backflow-testing or licensing records, or an OSHA injury log (TRIR here is a number you type in)Irrigation Installation KPI Dashboard in Google Sheets
- You want slicers or multi-filter analysis: the template uses one month dropdown and one KPI dropdownIrrigation Installation KPI Dashboard in Google Sheets
Real-World Use Cases
Marco runs a 12-person irrigation install company. On the first Monday of each month he pastes last month’s jobs completed, cycle days and callback percentages into the Actual sheet, picks the month and opens the Bottom 5 list. When Callback / Rework Rate turns Missed for the year, he books a crew-lead review of the jobs that needed a return visit.Irrigation Installation KPI Dashboard in Google Sheets
Dana is commercial manager at a landscape contractor. She follows the Financial group: Average Revenue Per Installation, Gross Margin and Material Waste Rate. The KPI Trend page shows her whether a weak month is a blip or a run of misses before she changes pricing or procurement.Irrigation Installation KPI Dashboard in Google Sheets
Sam consults for landscaping businesses. He renames two KPIs on KPI Definition, loads a client’s twelve months of numbers and shares a view-only link so the owner can switch months during their call. For lawn crews he uses the Lawn Care Business KPI Scorecard in Google Sheets instead.
Advantages of the Irrigation Installation KPI Dashboard
- One-time cost: $8.99 with no per-user fee, compared with a recurring subscription for field service software.Irrigation Installation KPI Dashboard in Google Sheets
- Fair scoring for cost and time KPIs: lower-the-better KPIs score above 100% when you beat the target, so group averages are not distorted by direction.
- Fast monthly review: seven summary cards and the top and bottom five lists show where to look first.Irrigation Installation KPI Dashboard in Google Sheets
- Easy to adapt: KPI names, groups, owners and formulas are edited in one place.
- No lock-in: it is a normal Google Sheet you own and can share with a link.
Opportunities for Improvement
- YTD is typed, not calculated. You enter both MTD and YTD on each input sheet. That gives control over running totals and running averages, but a typo in a YTD cell is not caught.
- Achievement is not capped. One KPI far above target lifts its group average. In the sample, Material Waste Rate scores 124.7% MTD, which pulls the Financial group’s MTD average to 105.8% even though two of its three KPIs are At Risk for the year.
- The At Risk band runs up to just below 100%. The legend reads 95-99%, but a KPI at 99.1% (Material Waste Rate YTD in the sample) is still At Risk.
- Manual data entry. The template does not connect to job management or accounting systems.
Best Practices
- Agree each KPI’s formula and owner on KPI Definition before you load any numbers.
- Decide per KPI whether YTD is a running total or a running average, and fill the YTD columns the same way every month.
- Set realistic targets on KPI Input – Target; a target nobody can reach turns the whole row red.
- Use the KPI dropdown on KPI Trend before reacting to a single Missed month.
- Share a view-only link for reviews and keep edit access to the input sheets small. Google explains how drop-down lists work in Google Sheets if you want to add more.
Explore Relevant Templates
- Landscaping Dashboard in Google Sheets, with the full walkthrough in our Landscaping Dashboard in Google Sheets post
- Tree Care Services KPI Scorecard in Google Sheets
- Equipment Rental Business KPI Dashboard in Google Sheets — see the Equipment Rental Business KPI Dashboard post
- Irrigation Systems Dashboard in Power BI, a different analytics-style build
- For farms rather than installers, read the Agriculture KPI Scorecard in Google Sheets post.
An Irrigation Installation KPI Scorecard in Google Sheets (a separate card-based template) and an Excel edition of this dashboard are being prepared.
If you would like to learn how KPI dashboards like this are built, the Excel Pivot Tables & Dashboards course on NextGenTemplates Academy covers the skills step by step, with practice files.
Get the Irrigation Installation KPI Dashboard in Google Sheets
Frequently Asked Questions
What KPIs does the Irrigation Installation KPI Dashboard in Google Sheets track?
It tracks 14 KPIs in five groups, including Installations Completed, On-Time Installation Rate, Right-First-Time Rate, Average Installation Cycle Time, Callback / Rework Rate, Distribution Uniformity, Gross Margin, Material Waste Rate, Customer Satisfaction Score, Lead-to-Install Conversion Rate, TRIR, Warranty Claim Rate and Crew Utilization Rate.
How long does setup take?
Making your copy from the PDF link takes a minute. After that, time depends on how much history you load: each KPI needs MTD and YTD values per month on the Actual, Target and Prior Year sheets, and you can paste them from your own records.
Does the dashboard calculate YTD for me?
No. The input sheets store both MTD and YTD, so you type the YTD value. The dashboard then calculates achievement, status, prior-year movement, group averages and rankings from those inputs.
How does it compare to field service software like Jobber or ServiceTitan?
Those platforms run scheduling, dispatch and invoicing on a subscription. This template only reports monthly KPIs that you enter, for a one-time $8.99, so it works alongside your job management tool rather than replacing it.
Can I add my own KPIs or change the thresholds?
Yes. The sheets are wired for 22 KPIs; fill the next empty row on KPI Definition and type its numbers. The On Target, At Risk and Missed thresholds are in the Status formulas on the KPI Dashboard.
Is it a compliance or safety record?
No. It ships with fictional sample data and is a KPI reporting template. It does not certify installations, backflow tests, licences or water use and is not an OSHA recordkeeping log.
About the Author
Built by PK — Microsoft Certified Professional with 15+ years of Excel, Google Sheets and Power BI experience. Founder of NextGenTemplates, reaching 300K+ subscribers across YouTube channels. Every template is hand-built and tested before release.
Conclusion
The Irrigation Installation KPI Dashboard in Google Sheets gives installers a clear monthly view of 14 KPIs, with fair scoring for lower-the-better measures, twelve-month trends and a group roll-up, in a sheet you own. It runs in Google Sheets in any browser.
✅ Instant download · One-time payment · No subscription
Last updated: September 2026