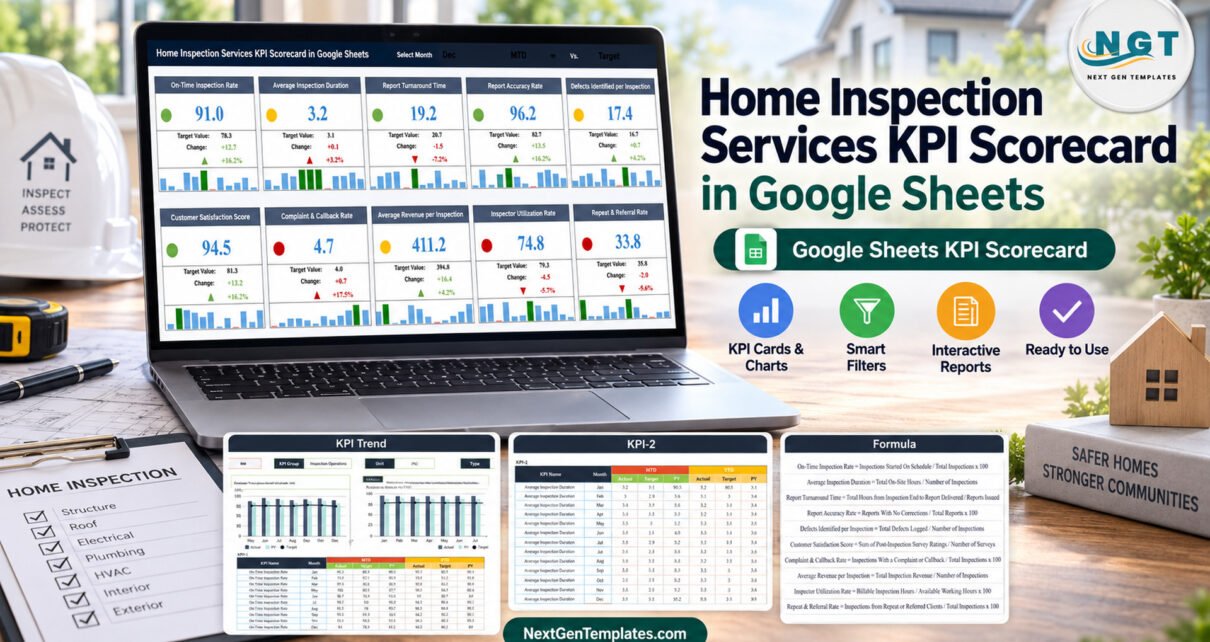
A home inspection company lives or dies on a few numbers: are inspectors arriving on time, are reports going out quickly and accurately, are clients happy enough to refer friends, and is each inspection earning what it should? The Home Inspection Services KPI Scorecard in Google Sheets puts ten of those measures on one page so a monthly review takes minutes instead of an afternoon of copying figures between tabs.Home Inspection Services KPI Scorecard in Google Sheets
This guide walks through every page of the template, explains how the traffic lights and selectors work, and shows how to load your own numbers. You can get the Home Inspection Services KPI Scorecard in Google Sheets here.
Get the Home Inspection Services KPI Scorecard in Google Sheets
What Is the Home Inspection Services KPI Scorecard?
It is a formula-driven Google Sheets workbook with four working pages: Scorecard, KPI Trend, KPI Definition and Input Data. You type monthly Actual, Target and Previous Year (PY) values for each KPI, and the scorecard does the comparison, colouring and charting. It ships with twelve months of fictional sample data.Home Inspection Services KPI Scorecard in Google Sheets
It is a management tool for the business side of an inspection company. It does not write inspection reports, book appointments, take payments, or say anything about licensing, standards of practice, or legal and real-estate questions.Home Inspection Services KPI Scorecard in Google Sheets
Key Features
- 📅 Three selectors: Select Month, MTD or YTD, and Target or PY. Every card recalculates when you change one.Home Inspection Services KPI Scorecard in Google Sheets
- 🚦 Traffic lights: a green, amber or red dot on each card compares the actual with the chosen comparison value.
- 🎯 Direction-aware KPIs: seven KPIs are Upper-the-Better (UTB) and three are Lower-the-Better (LTB), so a falling turnaround time is not treated like a falling satisfaction score.
- 📊 Change and change %: the gap to Target or PY in units and as a percentage, with an up or down arrow.Home Inspection Services KPI Scorecard in Google Sheets
- 📈 Mini charts: a 12-month bar strip under every card.
- 🔍 KPI Trend page: one KPI at a time with its formula, definition and two Actual vs Target vs PY charts.Home Inspection Services KPI Scorecard in Google Sheets
The 10 KPIs Tracked
| # | KPI Group | KPI | Unit | Type |
|---|---|---|---|---|
| 1 | Inspection Operations | On-Time Inspection Rate | % | UTB |
| 2 | Inspection Operations | Average Inspection Duration | hrs | LTB |
| 3 | Report Quality | Report Turnaround Time | hrs | LTB |
| 4 | Report Quality | Report Accuracy Rate | % | UTB |
| 5 | Report Quality | Defects Identified per Inspection | count | UTB |
| 6 | Customer Experience | Customer Satisfaction Score | score | UTB |
| 7 | Customer Experience | Complaint & Callback Rate | % | LTB |
| 8 | Financial | Average Revenue per Inspection | $ | UTB |
| 9 | Financial | Inspector Utilization Rate | % | UTB |
| 10 | Business Growth | Repeat & Referral Rate | % | UTB |
Each formula is written out on the KPI Definition page, for example Report Turnaround Time = Total Hours from Inspection End to Report Delivered / Reports Issued. Rename or redefine any KPI to match how your business already measures it.
Page-by-Page Walkthrough
1. Scorecard
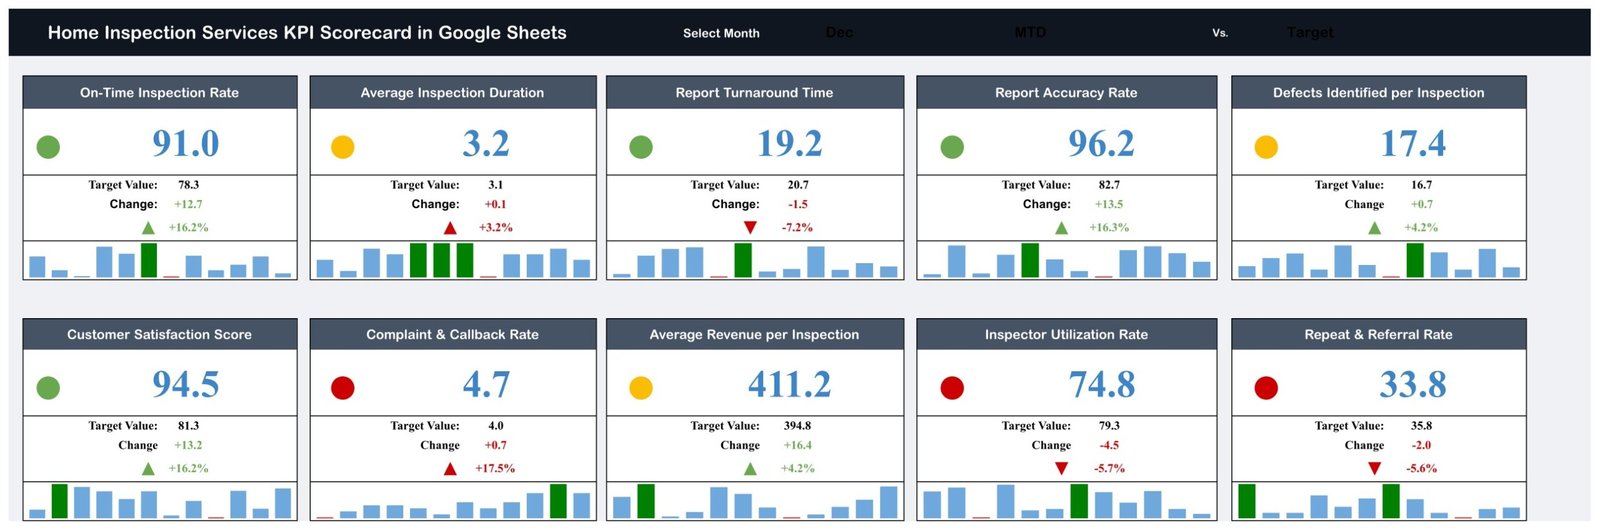
The header holds the title and the three selectors. Below it sit ten cards in two rows of five. Each card shows the KPI name, a status dot, the big actual value, the Target (or PY) value, the change, the change % with an arrow, and a twelve-month mini bar chart. In the December MTD vs Target sample, On-Time Inspection Rate reads 91.0 against a 78.3 target (+16.2%), Report Turnaround Time reads 19.2 hours against 20.7 (-7.2%, which is good for an LTB KPI), and Inspector Utilization Rate reads 74.8 against 79.3 (-5.7%). Four cards are green, three amber and three red.Home Inspection Services KPI Scorecard in Google Sheets
2. KPI Trend
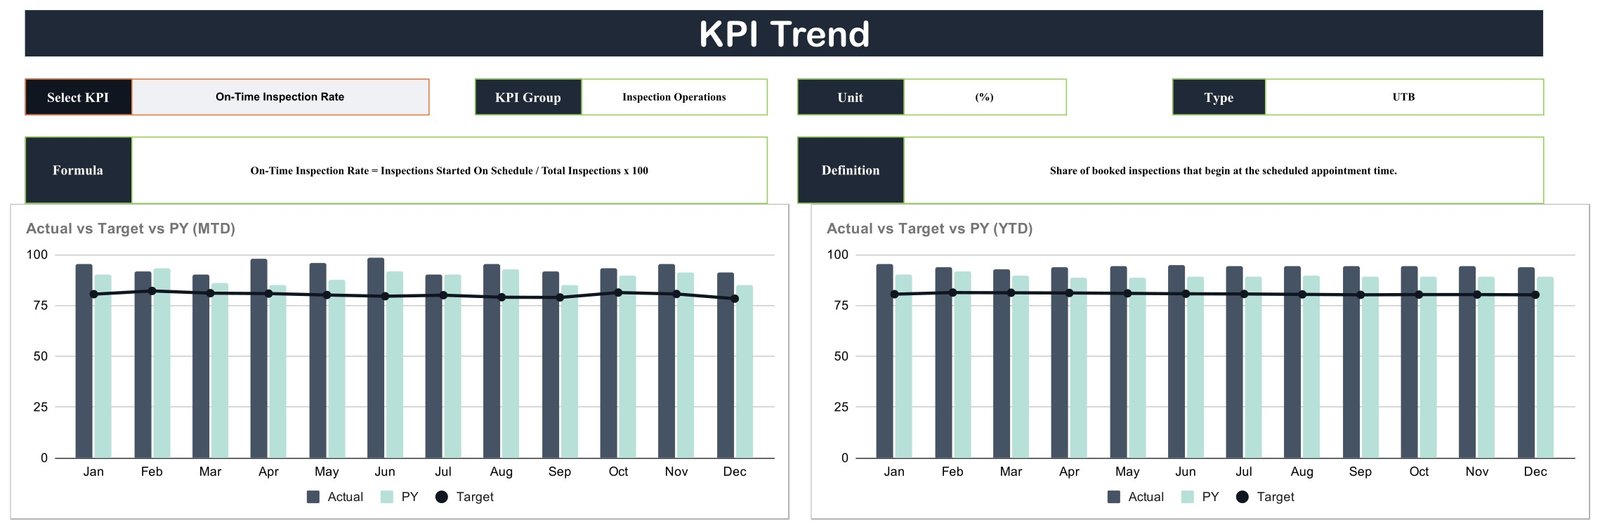
Pick a KPI from Select KPI and the page fills in its KPI Group, Unit, Type, Formula and Definition. Two column charts, Actual vs Target vs PY (MTD) and Actual vs Target vs PY (YTD), plot Actual and PY as bars and Target as a line across January to December. It is the quickest way to tell a one-off bad month from a slide that has been building.
3. KPI Definition

The master list: number, KPI Group, KPI Name, Unit, Formula, Definition and Type. The Scorecard and KPI Trend pages read names and types from here, so this is where you customise the scorecard.Home Inspection Services KPI Scorecard in Google Sheets
4. Input Data
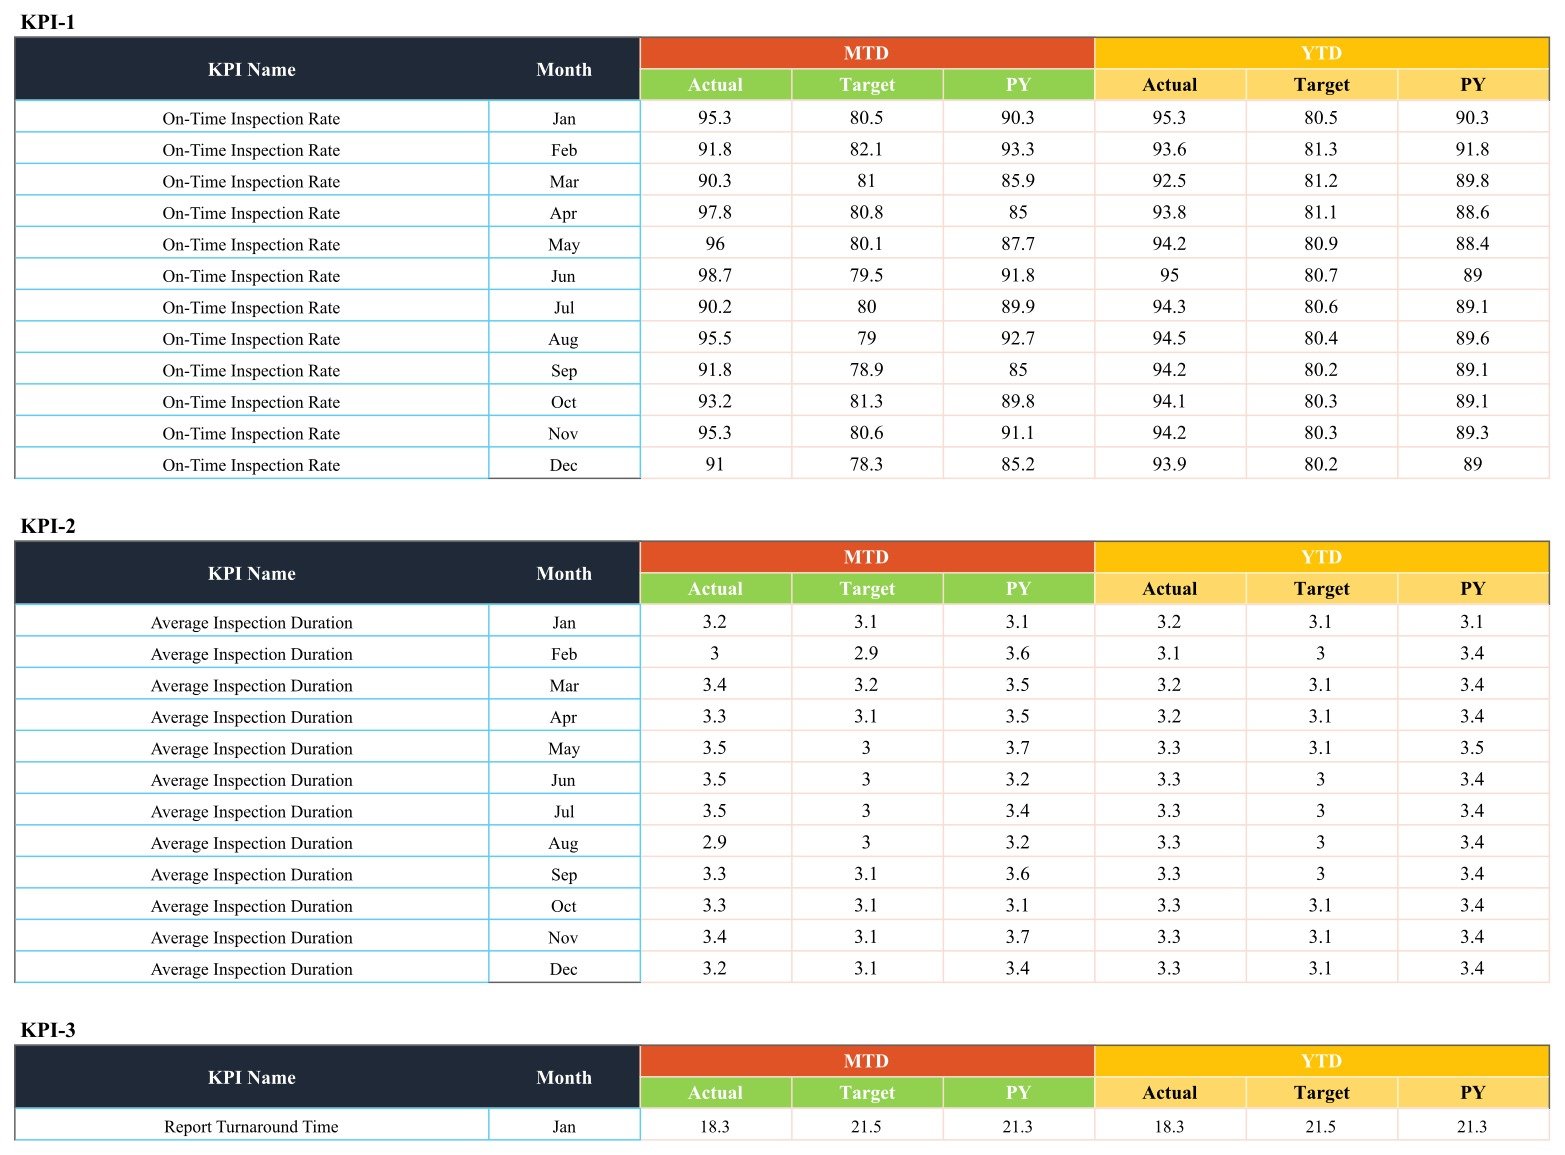
One block per KPI, KPI-1 to KPI-10, each with twelve month rows and six value columns: MTD Actual, Target and PY, then YTD Actual, Target and PY. Every value is typed; the YTD columns are not calculated from the monthly ones, so enter your year-to-date figures as your own reporting defines them.Home Inspection Services KPI Scorecard in Google Sheets
How to Set Up Your Copy
- Buy and download the template, open the PDF and click the Google Sheets link to make your own copy in Drive.
- Review the KPI Definition table and adjust any names, formulas, units or UTB/LTB types.
- Overwrite the sample numbers in Input Data with your monthly MTD and YTD Actual, Target and PY values.
- On the Scorecard, choose the month, MTD or YTD, and Target or PY.
- Share the file with your team using Google’s Google Sheets sharing options, giving edit access only to whoever maintains the data.Home Inspection Services KPI Scorecard in Google Sheets
Scorecard vs Spreadsheet vs Inspection Software
| Consideration | This scorecard | Blank spreadsheet | Inspection business software |
|---|---|---|---|
| Cost | One-time purchase | Free, build it yourself | Usually monthly subscription |
| Monthly KPI review | Ready: cards, lights, trends | Whatever you build | Varies by plan |
| Report writing and booking | Not included | Not included | Often included |
| Data entry | Manual monthly values | Manual | Often automatic from jobs |
Who Should Use This Home Inspection Services KPI Scorecard
Owners of one- or multi-inspector firms who want a monthly scoreboard, office or operations managers preparing a review meeting, and consultants helping an inspection business settle on consistent definitions. If you need report-writing, scheduling or payment software, this is not a replacement for it; it sits beside those tools and summarises the numbers they produce.
Related Google Sheets Templates
- Home Inspection Dashboard in Google Sheets – a different build: an analytics dashboard with slicers over inspection records.
- Home Renovation Contractor KPI Scorecard in Google Sheets
- Elevator Maintenance KPI Scorecard in Google Sheets
If you want to build KPI reports like this yourself, the Excel Pivot Tables & Dashboards course on NextGenTemplates Academy teaches the skills step by step, with practice files.
Get the Home Inspection Services KPI Scorecard in Google Sheets
Frequently Asked Questions
Does the scorecard create inspection reports?
No. It only summarises KPI values that you type in.
Is YTD calculated for me?
No. YTD Actual, Target and PY are entered in Input Data next to the MTD values.
Can I compare against last year instead of target?
Yes. Switch the Vs. selector from Target to PY and the cards, lights and change figures use the prior-year values.
Can I use my own KPIs?
Yes. Edit the KPI Definition table and the matching blocks in Input Data. The Scorecard has ten card positions.
What do I need to run it?
A Google account and a browser. There are no add-ons or macros.
Get the Template
Ready to run your monthly review from one page? Download the Home Inspection Services KPI Scorecard in Google Sheets from NextGenTemplates.