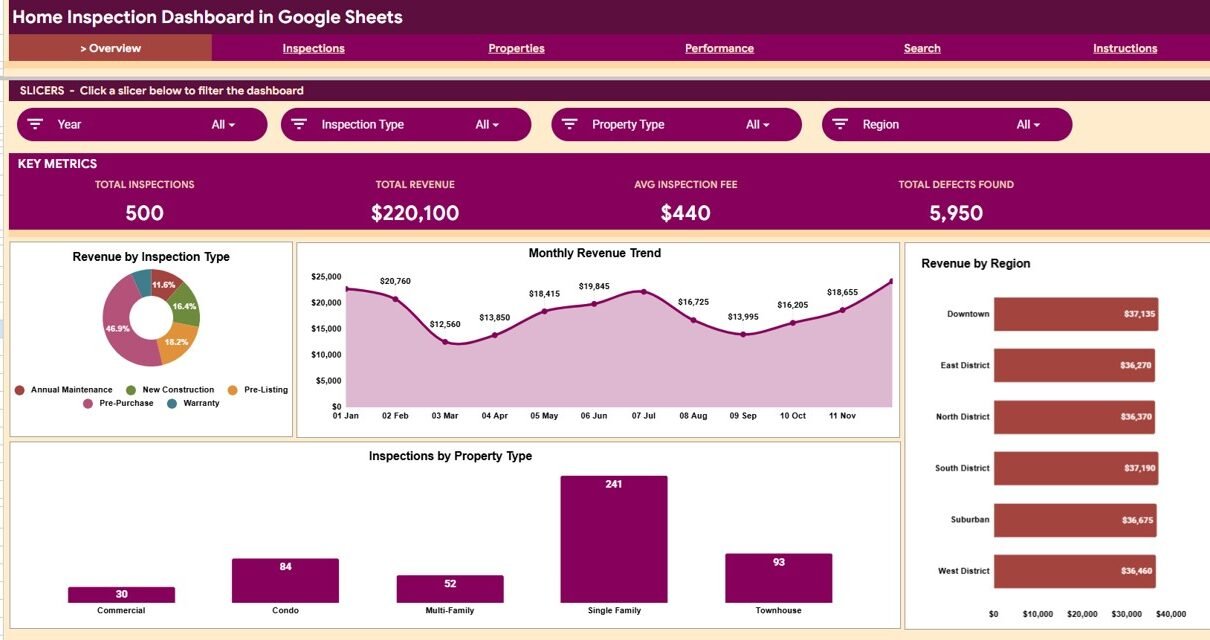
The Home Inspection Dashboard in Google Sheets turns raw inspection logs into a live reporting system. It tracks 4 headline KPIs and 15 charts across 4 analysis pages, plus a searchable Inspection ID lookup and a single Data tab. Setup takes under 10 minutes: paste your records and every chart updates automatically.
Most home inspectors record jobs in a flat spreadsheet and never see the patterns inside it: which property types produce the most defects, which referral sources bring the most jobs, or how revenue trends month to month. This dashboard closes that gap with a one-time, subscription-free reporting layer that runs entirely in your browser.
Get the Home Inspection Dashboard
Key Features of the Home Inspection Dashboard in Google Sheets
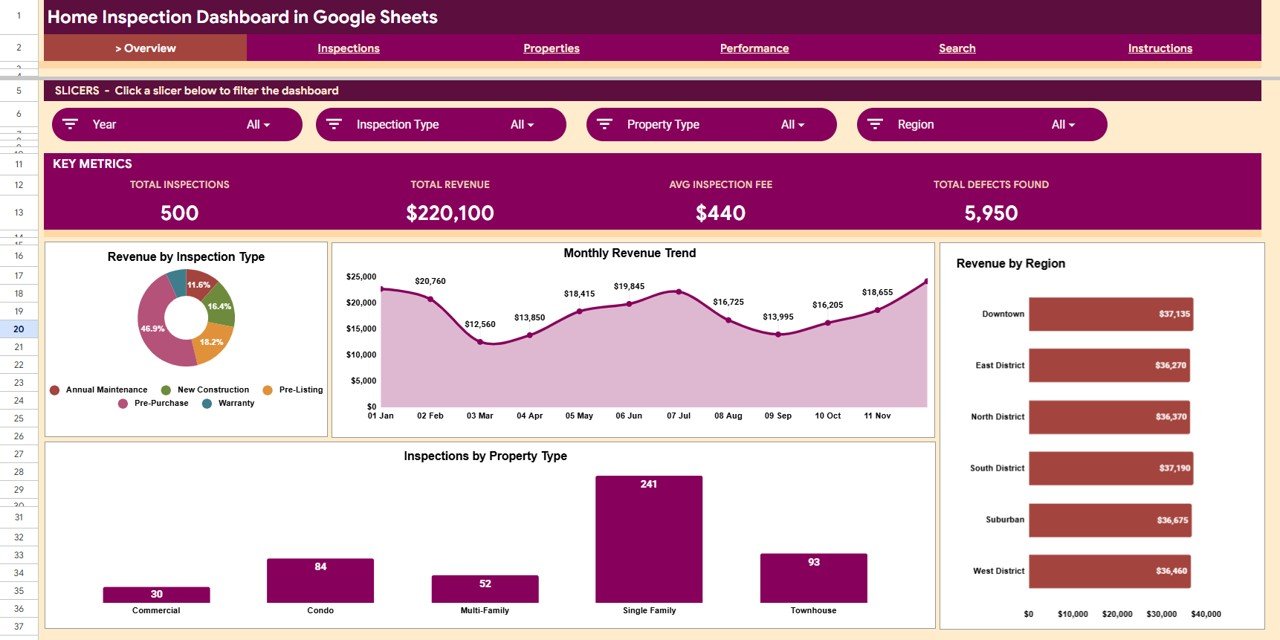
The dashboard is built around four headline KPI cards (Total Inspections, Total Revenue, Avg Inspection Fee, and Total Defects Found) at the top of the Overview page. With the 500 sample inspections they read 500, $220,100, $440, and 5,950. Below them, 15 charts split the data by inspection type, property type, region, inspector, referral source, result, and severity level.
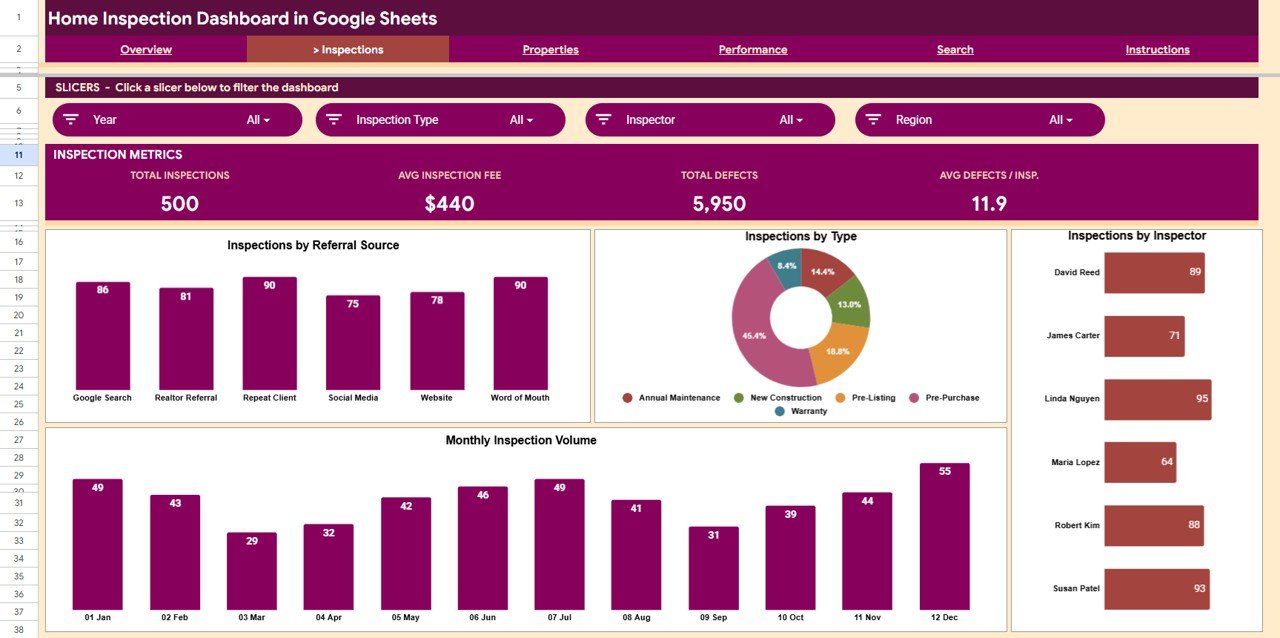
- Slicer-driven filtering: slicers on each page (Year, Inspection Type, Property Type, and Region on the Overview) filter every chart in one click.
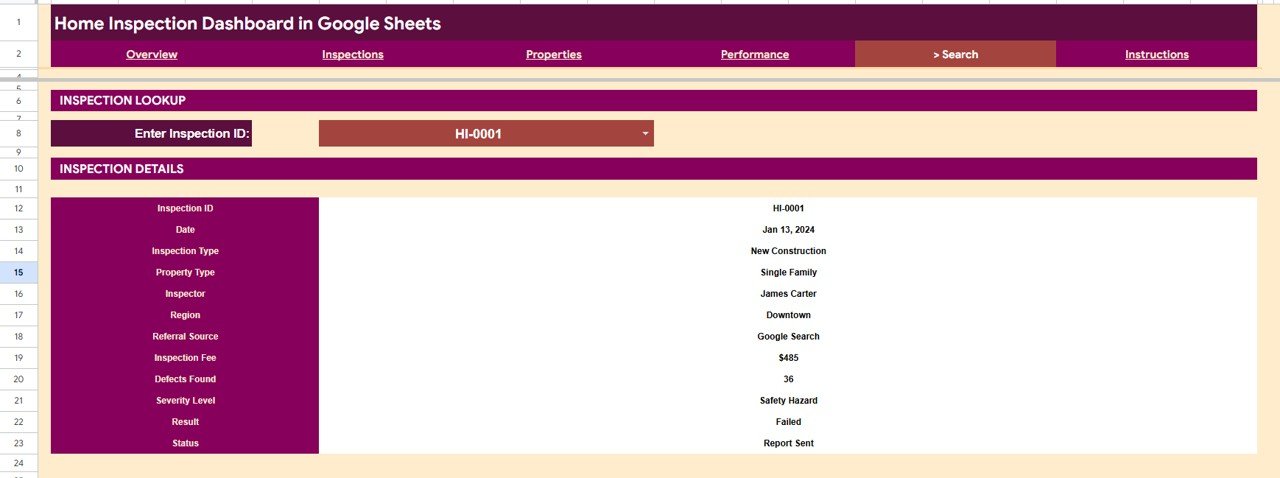
- Inspection ID search: the Search tab returns a complete record, including date, inspector, fee, defects, severity, result, and status, for any Inspection ID you pick from the dropdown.
- Auto-expanding data: add new inspections to the Data tab in the same column format and all four analysis pages refresh without formula edits.
- Page-level metrics: each analysis page adds its own cards, such as Pass Rate, Failed Inspections, Safety Hazards, and Active Inspectors.
Dashboard Pages Explanation
The workbook is organized into six working tabs plus an Instructions tab. Here is what each one does.
Overview Page
The Overview page leads with the four KPI cards, then presents Revenue by Inspection Type (Pre-Purchase, Pre-Listing, New Construction, Annual Maintenance, Warranty), a Monthly Revenue Trend, Revenue by Region (Downtown, East District, North District, South District, Suburban, West District), and Inspections by Property Type (Commercial, Condo, Multi-Family, Single Family, Townhouse). Slicers across the top filter every chart at once.
Inspections Page
This page analyzes inspection activity with Inspections by Referral Source (Google Search, Realtor Referral, Repeat Client, Social Media, Website, Word of Mouth), Inspections by Type, Inspections by Inspector, and Monthly Inspection Volume. Its cards add Avg Defects per Inspection, which is 11.9 in the sample data.
Properties Page
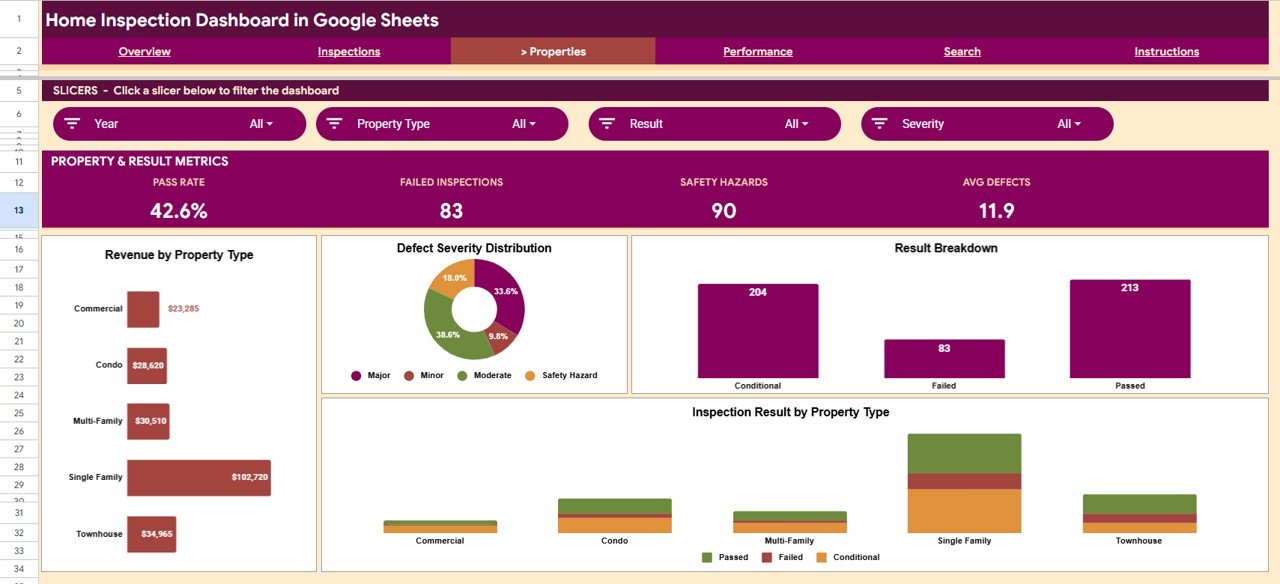
The Properties page covers Revenue by Property Type, Defect Severity Distribution (Minor, Moderate, Major, Safety Hazard), a Result Breakdown (Passed, Conditional, Failed), and Inspection Result by Property Type. Its cards show Pass Rate, Failed Inspections, Safety Hazards, and Avg Defects, helping you spot which property types carry the highest defect rates.
Performance Page
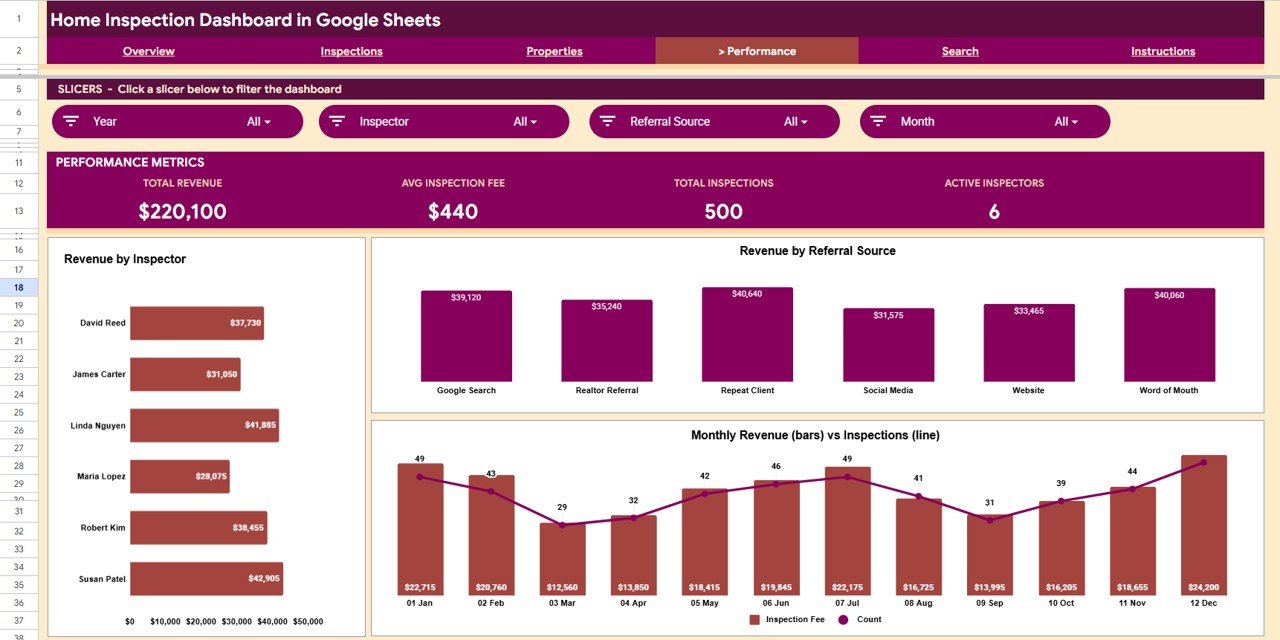
This page measures Revenue by Inspector, Revenue by Referral Source, and a combined Monthly Revenue (bars) vs Inspections (line) view, so you can compare output against earnings and judge which lead channels are worth the spend.
Search Sheet
Pick any Inspection ID from the dropdown and the Search tab displays the full record: Date, Inspection Type, Property Type, Inspector, Region, Referral Source, Inspection Fee, Defects Found, Severity Level, Result, and Status. It is a single-screen lookup for any past job.
Data Sheet
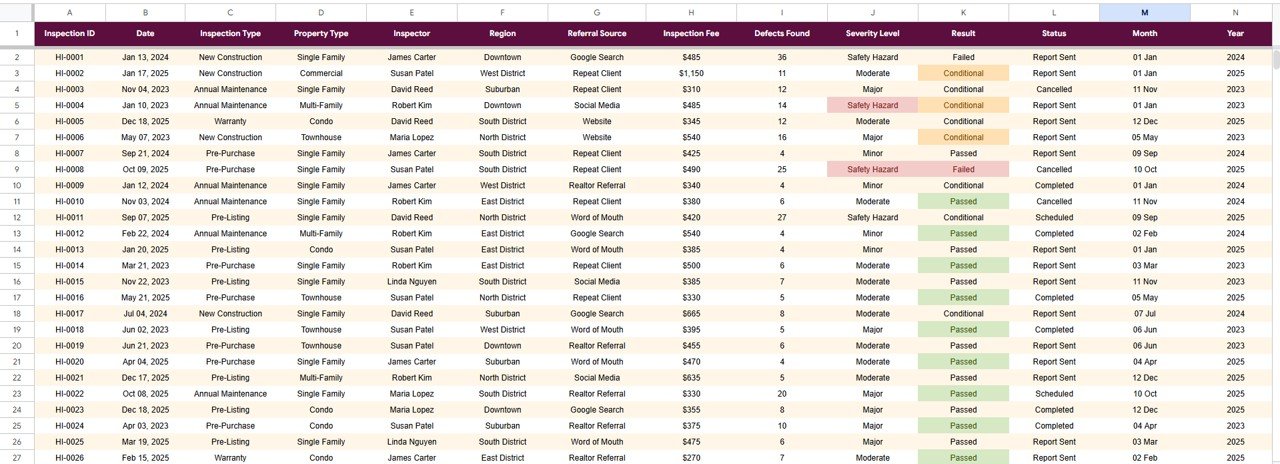
The Data tab holds every inspection record, one row per job, with the columns Inspection ID, Date, Inspection Type, Property Type, Inspector, Region, Referral Source, Inspection Fee, Defects Found, Severity Level, Result, Status, Month, and Year. Add new rows in the same format and the entire dashboard recalculates without touching formulas or chart ranges. This is the only tab you edit day to day.
Home Inspection Dashboard in Google Sheets vs. Excel vs. Paid Inspection Software: Feature Comparison
| Feature | Home Inspection Dashboard (Google Sheets) | Microsoft Excel Dashboard | Spectora / HomeGauge / ISN |
|---|---|---|---|
| Cost | One-time purchase | One-time template price | Monthly subscription |
| Platform | Browser, any device, Google Drive | Desktop Excel | Cloud SaaS |
| Setup time | Under 10 minutes | Under 10 minutes | Hours of onboarding |
| Real-time collaboration | Built-in sharing | Limited | Yes |
| Mobile access | Google Sheets app | Limited | Yes |
| Customizable charts and fields | Fully editable | Fully editable | Vendor-locked |
| Share with a link | Yes | File send only | Yes |
| On-site reports with photos | No (reporting only) | No | Yes |
For inspectors who want clear revenue and defect analytics without paying monthly per-seat fees, the Home Inspection Dashboard in Google Sheets sits in the sweet spot.
Who Should Use This Template
Perfect for:
- Independent home inspectors tracking inspections, fees, and defects across multiple regions
- Small inspection firms with a few inspectors who want shared, real-time reporting in Google Drive
- Property service businesses billing per inspection that need revenue split by type, inspector, and referral source
Not a fit if:
- You need on-site report generation with photos and signatures; that is a dedicated inspection-software job
- You are a large franchise needing role-based permissions, audit logs, and client portals
Real-World Use Cases
Dave runs a solo home inspection business across three counties. He uses the Home Inspection Dashboard in Google Sheets to track monthly revenue by region and identify which property types generate the most defects, without paying for a platform he would only use for reporting.
Maria manages four inspectors at a regional firm. She shares the dashboard through a Google Drive link so the team sees Revenue by Inspector and Inspections by Referral Source in real time, guiding where she invests in lead generation.
Sam coordinates inspections for a property management group. He uses the Search tab to pull any inspection record by ID during client calls, and the Properties page to flag which property types show recurring safety-hazard defects.
Advantages of the Home Inspection Dashboard in Google Sheets
The biggest advantage is cost: a single one-time purchase covers your reporting with no recurring per-seat fees. Because it runs in Google Sheets, your whole team can open it on any device, and updates are instant for everyone with the link. The auto-expanding ranges mean you spend time inspecting, not maintaining spreadsheets. If you want to learn how pivot-driven dashboards like this are built, the Pivot Tables and Dashboards course on NextGenTemplates Academy is a structured place to start.
Opportunities for Improvement
The template is a reporting layer, not a field-inspection app. It does not capture site photos, generate client-ready PDF reports, or handle e-signatures. Very large firms running thousands of inspections per month may eventually want a database-backed system with permissions. For most independents and small teams, those are not day-to-day needs.
Best Practices
Keep your Data tab clean: use consistent labels for inspection type, region, and result so the slicers and charts group correctly. Add records promptly after each job so the month-over-month trends stay accurate. For shared use, give edit access only to inspectors who enter data and view access to everyone else. See the official Google Sheets help center for sharing and protection options.
Explore Relevant Templates
If you manage property or service businesses, these related Google Sheets dashboards pair well with this one:
- Property Management Dashboard in Google Sheets
- Real Estate Dashboard in Google Sheets
- HVAC Service Dashboard in Google Sheets
- Pest Control Dashboard in Google Sheets
Prefer a different platform? The same analysis is also available as the Home Inspection Dashboard in Excel and the Home Inspection Dashboard in Power BI.
Frequently Asked Questions
What KPIs does the Home Inspection Dashboard in Google Sheets track?
It tracks four headline KPIs (Total Inspections, Total Revenue, Average Inspection Fee, and Total Defects Found) alongside 15 charts covering inspection type, property type, region, inspector, referral source, result, and severity level.
How long does setup take?
Under 10 minutes. Make your own copy, paste your inspection records into the Data tab in the existing format, and every KPI card, chart, and slicer updates automatically.
How does this compare to Spectora or HomeGauge?
Spectora and HomeGauge are full inspection-software platforms billed by subscription. The Home Inspection Dashboard in Google Sheets is a one-time-purchase reporting layer. It will not generate on-site reports, but it delivers revenue and defect analytics without any subscription.
Can multiple inspectors use it at the same time?
Yes. Because it runs in Google Sheets, you can share it with your team via a Drive link and everyone sees the same live data, charts, and KPIs on any device.
Do I need to rebuild formulas when I add inspections?
No. Add new rows to the Data tab in the same format and the charts and KPIs expand automatically. You never edit formulas or chart ranges.
About the Author
Built by PK, Microsoft Certified Professional with 15+ years of Excel, Google Sheets, and Power BI experience. Founder of NextGenTemplates. Every template is hand-built and tested before release.
Wrapping Up
The Home Inspection Dashboard in Google Sheets gives independent inspectors and small firms a clear, shareable view of revenue, inspection volume, results, and defects without monthly software fees. Copy it, paste in your last quarter of inspections, and check the Performance page to see which referral sources deserve more of your marketing budget.
Get the Home Inspection Dashboard in Google Sheets
Instant download. One-time payment. No subscription.
📅 Last updated: October 2026