The Housekeeping Service Analytics Dashboard in Google Sheets gives cleaning companies, hotel housekeeping teams, janitorial supervisors, and facility service managers a fast way to review 4 KPI cards, 14 charts, 6 working tabs, and Job ID lookup from one Google Sheets file. The top-level metrics are Total Revenue, Completed Jobs, Avg Rating, and Avg Job Value, so a manager can check income, service volume, customer satisfaction, and job value before opening the raw data.Housekeeping Service Analytics Dashboard in Google Sheets
For teams still reporting from manual job logs, this template removes a lot of weekly reporting friction. Enter housekeeping records in the Data sheet, use slicers to filter the dashboard, and review performance across services, staff, clients, service areas, payment methods, and monthly trends. Download the Housekeeping Service Analytics Dashboard in Google Sheets from NextGenTemplates.
Key Features of Housekeeping Service Analytics Dashboard in Google Sheets
- 4 KPI cards on the Overview page: Total Revenue, Completed Jobs, Avg Rating, and Avg Job Value.
- 14 pre-built charts: Track revenue, job counts, ratings, duration, service areas, services, staff, client types, payment methods, and top clients.
- Multiple dashboard pages: Overview, Services, Staff, Clients, Search Sheet, and Data Sheet tabs keep analysis organized.
- Interactive slicers: Filter the dashboard quickly by available fields and review the selected business segment.
- Job ID search: Enter a Job ID and instantly view all details for that housekeeping job.
- Editable data structure: Replace sample rows in the same format and the dashboard updates from your own records.
- Google Sheets collaboration: Share through Google Drive with managers, supervisors, or reporting teams.
The file uses native Google Sheets behavior, so teams can also adapt filters and slicers using Google’s own guidance for filters and slicers in Google Sheets.
Dashboard Pages Explanation
Download the Housekeeping Service Analytics Dashboard in Google Sheets today.
1. Overview Page
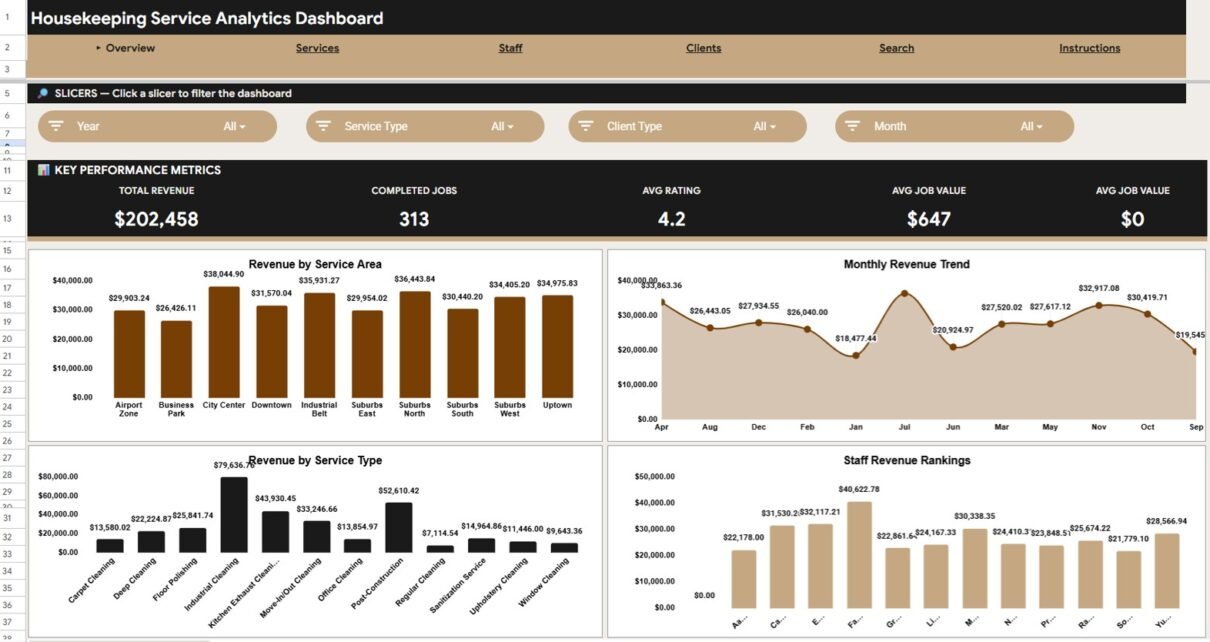
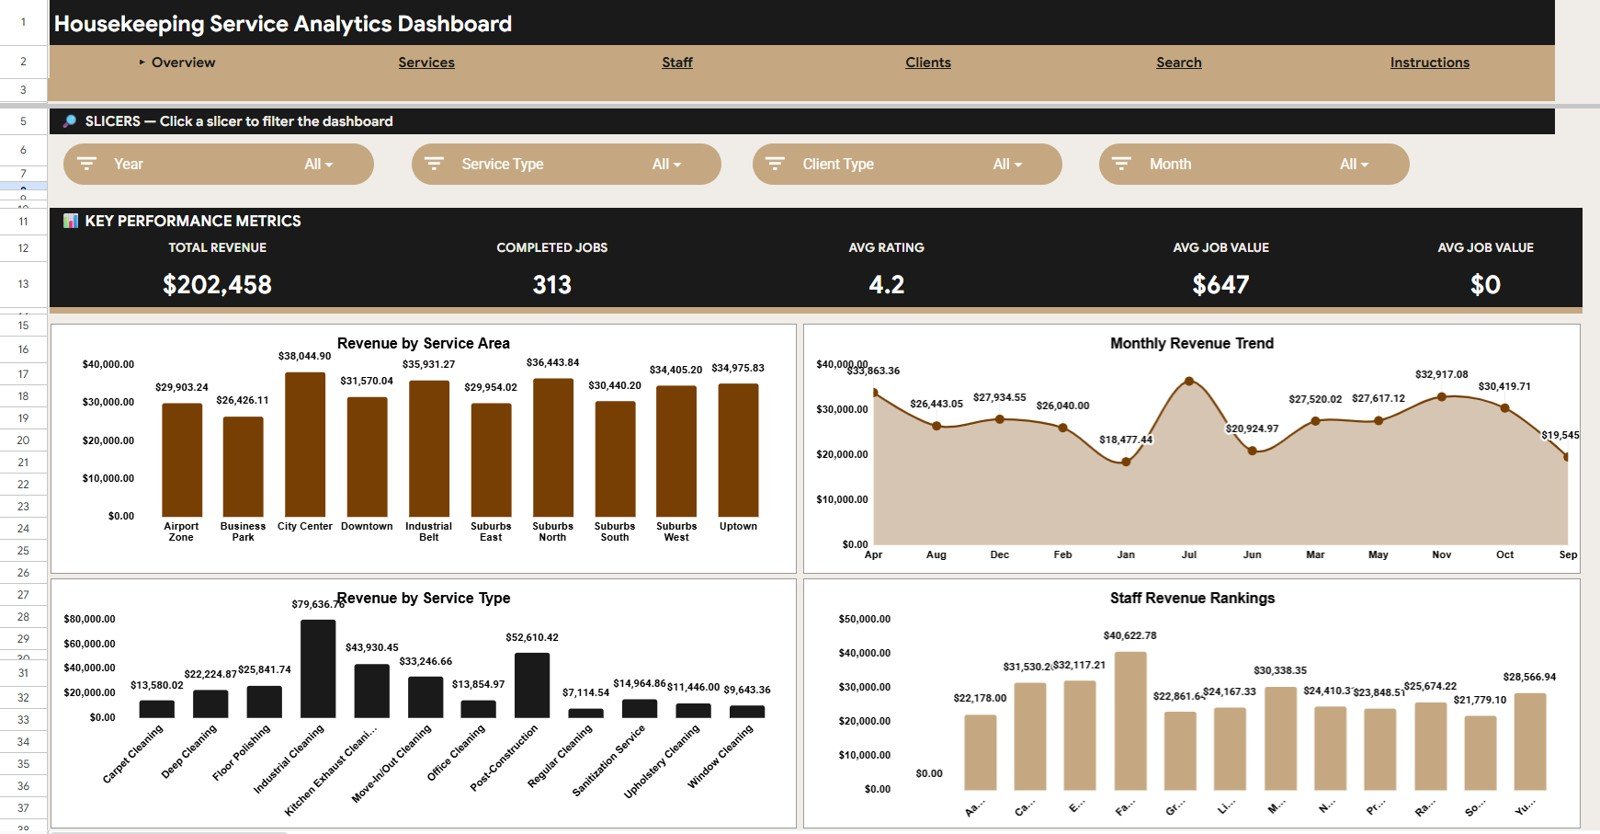
The Overview page is the executive summary for the housekeeping operation. It shows Total Revenue, Completed Jobs, Avg Rating, and Avg Job Value at the top, then uses slicers and charts to explain where performance is coming from.
Revenue by Service Area: This chart compares revenue across the different service areas covered by your housekeeping team. It helps identify which locations, zones, properties, or branches are generating the strongest income.
Revenue by Month: This chart shows monthly revenue movement so managers can spot seasonal patterns and slow periods. It is useful for planning staff coverage, promotions, and recurring service contracts.
Revenue by Service Type: This chart compares income across service categories such as regular cleaning, deep cleaning, room turnover, move-out cleaning, or similar service lines. It helps managers decide which services deserve more sales focus or operational attention.
Revenue by Staff: This chart shows how revenue is distributed across assigned staff members. It supports workload review, staff productivity discussion, and branch-level performance checks.
2. Services
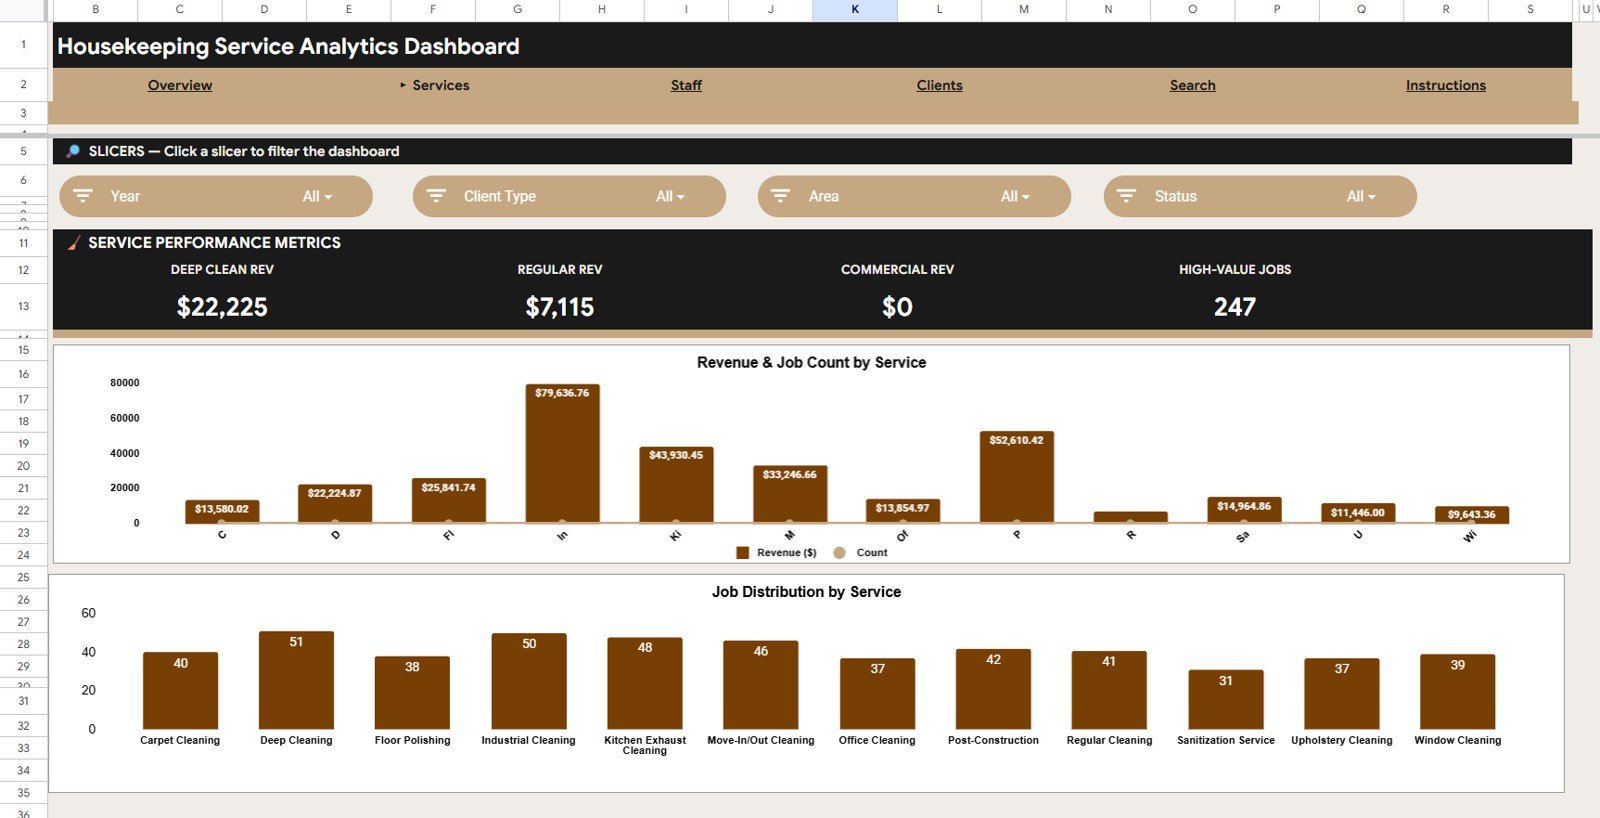
The Services tab focuses on service mix and job demand. It helps teams understand whether revenue is coming from a small number of high-value services or from high-volume recurring work.
Revenue and Job Count by Service: This chart pairs income and volume by service so managers can compare value and workload together. A service with high job count but lower revenue may need pricing review, while a lower-volume service with high revenue may deserve more promotion.
Job Count by Service: This chart shows which housekeeping services are requested most often. It helps operations teams plan supplies, assign trained staff, and prepare for peak service categories.Housekeeping Service Analytics Dashboard in Google Sheets
Download the Housekeeping Service Analytics Dashboard in Google Sheets today.
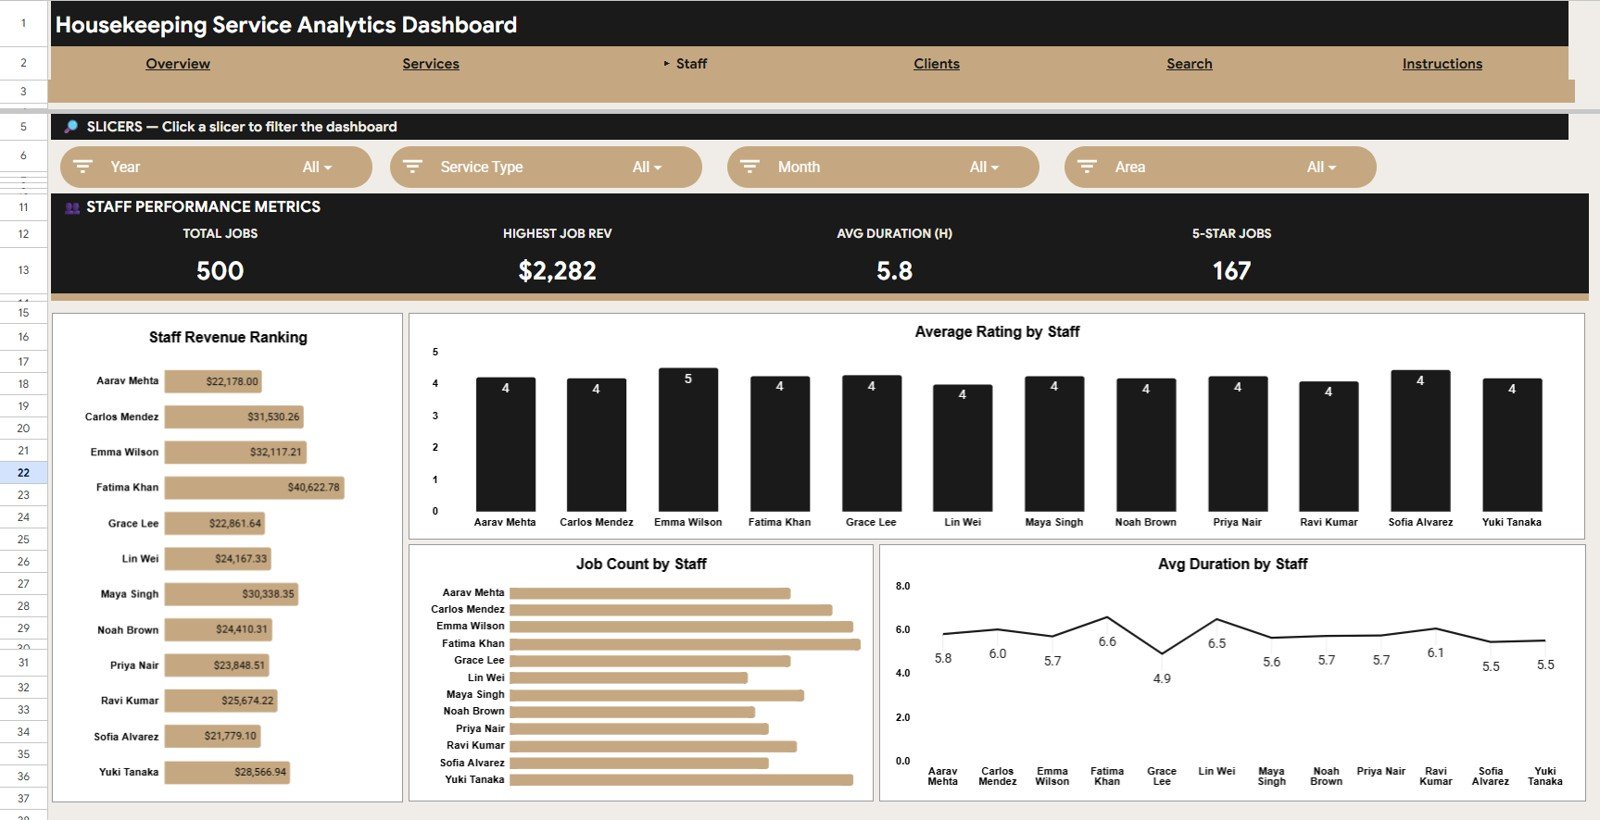
3. Staff
The Staff tab compares individual team output and service quality. It is useful for daily supervisors, hotel operations managers, and cleaning business owners who need a balanced view of revenue, ratings, volume, and duration.Housekeeping Service Analytics Dashboard in Google Sheets
Revenue by Staff: This chart shows how much revenue is linked to each staff member. It helps managers review team contribution while remembering that assignments, service type, and area mix can affect the numbers.Housekeeping Service Analytics Dashboard in Google Sheets
Average Rating by Staff: This chart compares customer or internal service ratings by staff member. It is useful for coaching, recognition, and spotting quality trends before they become repeated service issues.
Job Count by Staff: This chart shows the number of jobs completed or assigned per staff member. It helps identify workload balance and whether a few people are carrying most operational volume.
Avg Duration by Staff: This chart compares average job duration by staff member. It can highlight efficiency differences, training needs, or jobs that consistently take longer than expected.Housekeeping Service Analytics Dashboard in Google Sheets
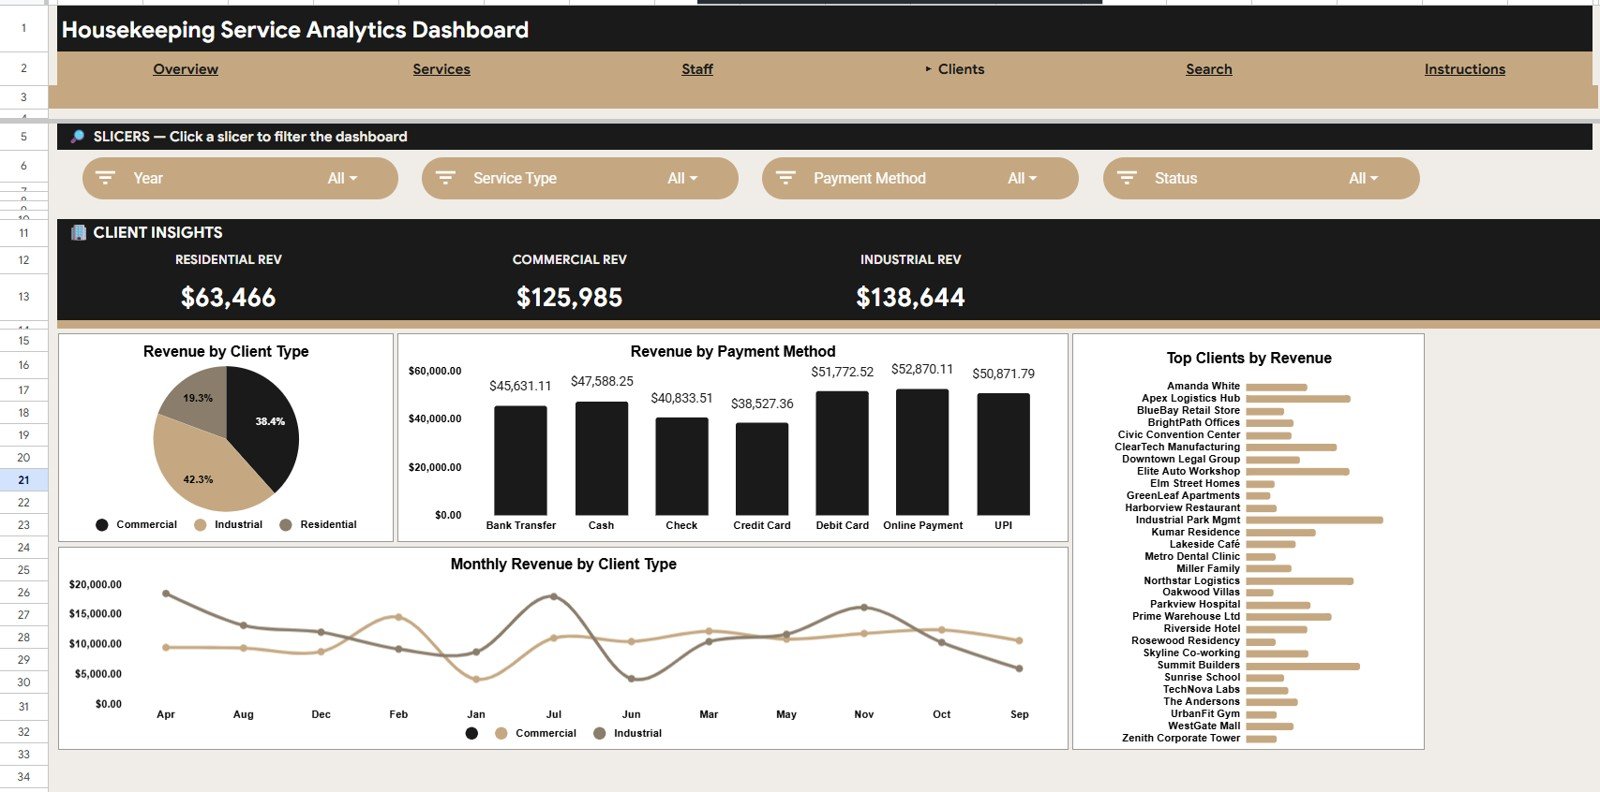
4. Clients
The Clients tab turns housekeeping revenue into customer and payment insight. It helps teams see which client segments, payment methods, and top customers are shaping the business.
Revenue by Client Type: This chart compares revenue across client groups such as residential, commercial, hotel, facility, or contract clients. It helps owners understand which customer type contributes the most to income.
Revenue by Payment Method: This chart shows revenue by the way clients pay. It helps finance and operations teams understand cash, card, online, invoice, or other payment patterns.Housekeeping Service Analytics Dashboard in Google Sheets
Revenue by Top Clients: This chart highlights the largest revenue-contributing clients. It supports account management, retention planning, and follow-up with key customers.Housekeeping Service Analytics Dashboard in Google Sheets
Monthly Revenue by Client Type: This chart shows how client-type revenue changes month by month. It is useful for spotting contract seasonality, campaign results, or client segment changes over time.
Download the Housekeeping Service Analytics Dashboard in Google Sheets today.
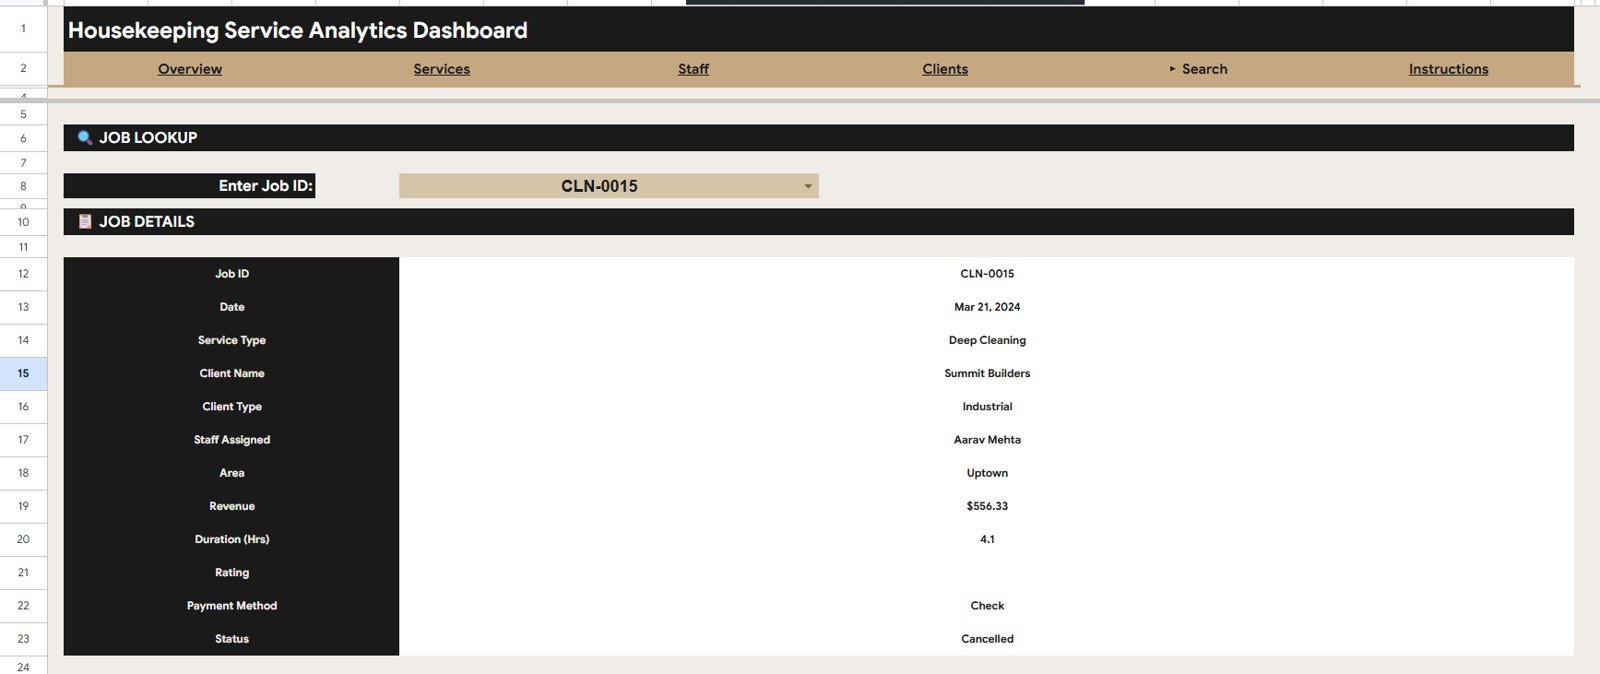
5. Search Sheet
The Search Sheet is built for fast lookup. Enter a Job ID and it displays the related date, service type, client name, client type, assigned staff, area, revenue, duration, rating, payment method, and status.Housekeeping Service Analytics Dashboard in Google Sheets
This tab is helpful when a supervisor needs to answer a client question, review a complaint, confirm a payment method, or check who handled a specific job without scrolling through the full Data sheet.Housekeeping Service Analytics Dashboard in Google Sheets
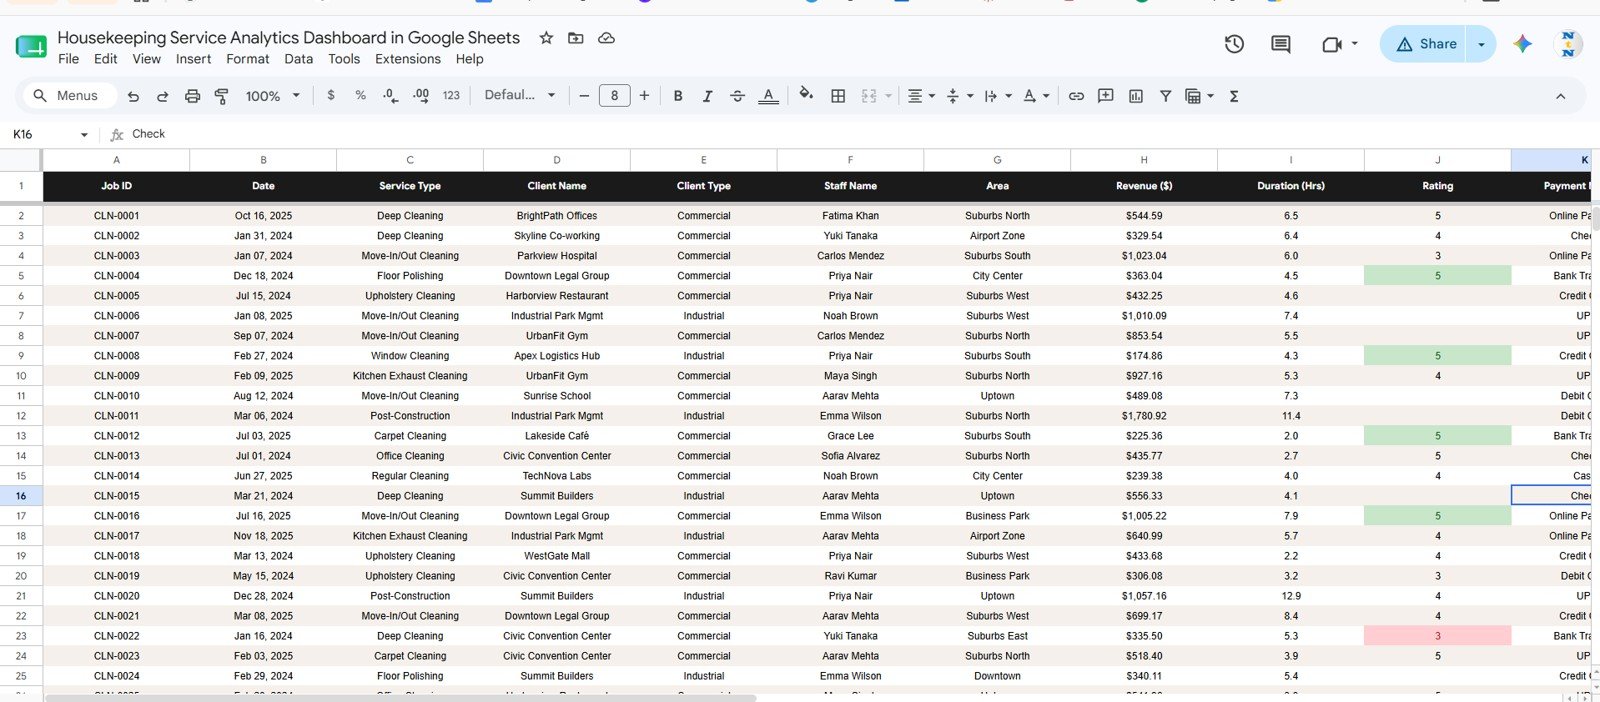
6. Data Sheet Tab
The Data Sheet is the source table for the dashboard. Add your records in the same format and keep the columns consistent so all KPI cards, charts, slicers, and search results continue to work correctly.
Typical fields include job date, service type, client details, staff assigned, service area, revenue, duration, rating, payment method, and status. This makes it easy to move from daily job records into management reporting.
Housekeeping Service Analytics Dashboard in Google Sheets vs. Microsoft Excel vs. Paid Field Service SaaS – Feature Comparison
| Feature | Housekeeping Dashboard in Google Sheets | Microsoft Excel Dashboard | Paid Housekeeping SaaS |
|---|---|---|---|
| Cost | $9.99 one-time | Template cost plus Microsoft access | Monthly or annual subscription |
| Platform | Google Sheets in browser | Excel desktop or web | Vendor cloud platform |
| Setup time | Copy the file and replace data | Open workbook and replace data | Configuration and staff onboarding |
| Real-time team collaboration | Native Google Drive sharing | Possible with OneDrive | Usually included |
| Mobile access | Google Sheets mobile app | Excel mobile app | Vendor mobile app |
| Customizable fields | Editable sheet columns and charts | Editable workbook | Depends on plan and admin rights |
| Share with link | Yes, through Google Drive | Possible through cloud storage | Role-based access |
| Year-1 cost at 5 users | $9.99 total | Template cost plus licenses | Often hundreds or thousands of dollars |
| Job ID lookup | Included | Depends on workbook design | Usually included |
| Service and staff analytics | Included across Services and Staff tabs | Depends on workbook design | Often included in higher plans |
Who Should Use This Template
Download the Housekeeping Service Analytics Dashboard in Google Sheets today.
- Housekeeping business owners who need weekly revenue, job count, staff, and client reporting.
- Hotel housekeeping managers tracking team performance, ratings, and service duration.
- Janitorial and facility service supervisors comparing service demand and completed work.
- Property managers who receive housekeeping records from multiple locations.
- Google Sheets users who want a shareable dashboard before investing in a full SaaS platform.
This template is not a full booking, scheduling, payroll, billing, route planning, or employee time tracking system. It is an analytics dashboard for teams that already have job records and want clearer reporting.
Real-World Use Cases
Maria runs a residential housekeeping company. She updates the Data sheet every Friday and checks Revenue by Service Type to decide whether deep cleaning packages should be promoted again next month.
James manages housekeeping for a boutique hotel. He reviews Average Rating by Staff and Avg Duration by Staff to coach team members and understand why certain room turnover jobs take longer.
Anika supports facility services reporting. She uses Revenue by Top Clients and Monthly Revenue by Client Type to prepare a simple client performance review for the operations director.
Advantages of Housekeeping Service Analytics Dashboard in Google Sheets
- Fast reporting: KPI cards and charts are ready once your data is entered in the same format.
- Low ownership cost: The template is a one-time purchase instead of a recurring subscription.
- Team-friendly format: Google Sheets makes the file easy to share with supervisors and managers.
- Practical job lookup: The Search Sheet helps users find one job record quickly by Job ID.
- Operational visibility: Services, Staff, and Clients tabs support common housekeeping review workflows.
Click here to purchase the Housekeeping Service Analytics Dashboard in Google Sheets.
Opportunities for Improvement
The dashboard depends on manual or pasted data entry, so it does not automatically sync from booking apps, staff scheduling systems, payment processors, or hotel PMS tools. If your business needs live dispatching, GPS location, employee check-in, client reminders, route optimization, or invoice generation, you may need a dedicated field service system or a custom Google Apps Script web app. The dashboard can still be useful as a reporting layer beside those tools.
Best Practices
- Keep the Data sheet column headers intact so connected charts and formulas continue to work.
- Use consistent Job IDs so the Search Sheet returns the correct record.
- Update status values consistently, such as Completed, Pending, Cancelled, or In Progress.
- Review staff ratings with context, because service area, job type, and client difficulty can affect results.
- Protect formula and dashboard areas before sharing editor access with a wider team.
- Make a monthly backup copy in Google Drive before large data updates.
Explore Relevant Templates
- Cleaning Services KPI Dashboard in Excel – KPI tracking for cleaning and facility service teams.
- Hotel Hospitality Revenue Dashboard in Google Sheets – hotel revenue, booking, occupancy, and guest rating reporting.
- Bed and Breakfast Dashboard in Google Sheets – booking and guest analytics for small hospitality businesses.
- Airbnb Host Dashboard in Google Sheets – short-term rental revenue and booking performance.
- Browse all Google Sheets Dashboard templates.
Frequently Asked Questions
Download the Housekeeping Service Analytics Dashboard in Google Sheets today.
Is the Housekeeping Service Analytics Dashboard built in Google Sheets?
Yes. It is built for Google Sheets and can be copied to your own Google Drive after purchase.
What KPI cards are shown on the Overview page?
The Overview page shows Total Revenue, Completed Jobs, Avg Rating, and Avg Job Value.
What pages are included in the template?
The template includes Overview, Services, Staff, Clients, Search Sheet, and Data Sheet tabs.
Can I search for a specific housekeeping job?
Yes. Enter a Job ID in the Search Sheet and it displays the job date, service type, client, staff, area, revenue, duration, rating, payment method, and status.
Can this dashboard be shared with multiple users?
Yes. Because it is a Google Sheets file, you can share it through Google Drive with viewer or editor permissions.
Does this replace field service software?
No. It is an analytics dashboard, not a scheduling, dispatching, payroll, invoicing, or route management system.
About the Author
Built by PK – Microsoft Certified Professional with 15+ years of Excel, Google Sheets, and Power BI experience. Founder of NextGenTemplates, reaching 300K+ subscribers across YouTube channels. Every template is hand-built and tested before release.
Conclusion
The Housekeeping Service Analytics Dashboard in Google Sheets is a practical reporting template for teams that want revenue, jobs, ratings, staff, services, clients, and payment insights without building a dashboard from scratch. It is especially useful for housekeeping businesses, hotel operations teams, janitorial supervisors, and facility managers who already collect job records and want a clearer way to review them.
Download the Housekeeping Service Analytics Dashboard in Google Sheets today.
For step-by-step tutorials and dashboard walkthroughs, visit YouTube.com/@NeoTechNavigators.
Last updated: June 14, 2026