ESG reporting is moving from a yearly documentation exercise into a repeatable operating rhythm. The International Sustainability Standards Board’s IFRS S1 and IFRS S2 standards apply for annual reporting periods beginning on or after January 1, 2024, while the European Commission notes that the first companies covered by new CSRD reporting rules began reporting in 2025 for the 2024 financial year. That shift means ESG teams need more than static tables. They need a quick way to collect records, filter by department or facility, review performance against targets, and explain trends clearly.
The Sustainability and ESG Dashboard in Google Sheets is built for that workflow. It organizes environmental, social, and governance records into a practical dashboard system with overview metrics, slicer-based analysis, dedicated ESG category tabs, lookup search, and a structured data sheet. Because it is built in Google Sheets, teams can collaborate, update records, and share dashboard views without adding heavy software.
🎥 Watch the Video Tutorial
Get the Sustainability and ESG Dashboard
Key Features
This template gives sustainability managers, operations teams, ESG consultants, and reporting coordinators a ready-made structure for tracking ESG records across months, quarters, facilities, departments, metric types, and status categories. It is especially useful when a team wants the flexibility of a spreadsheet but still needs presentation-ready charts and summary cards.
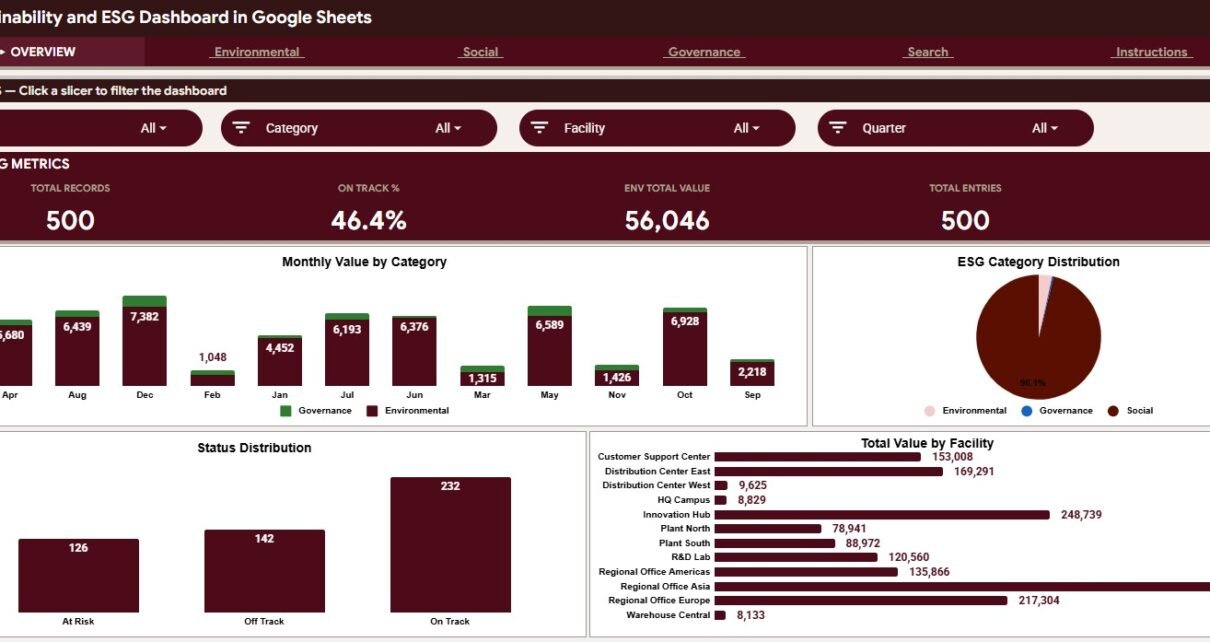
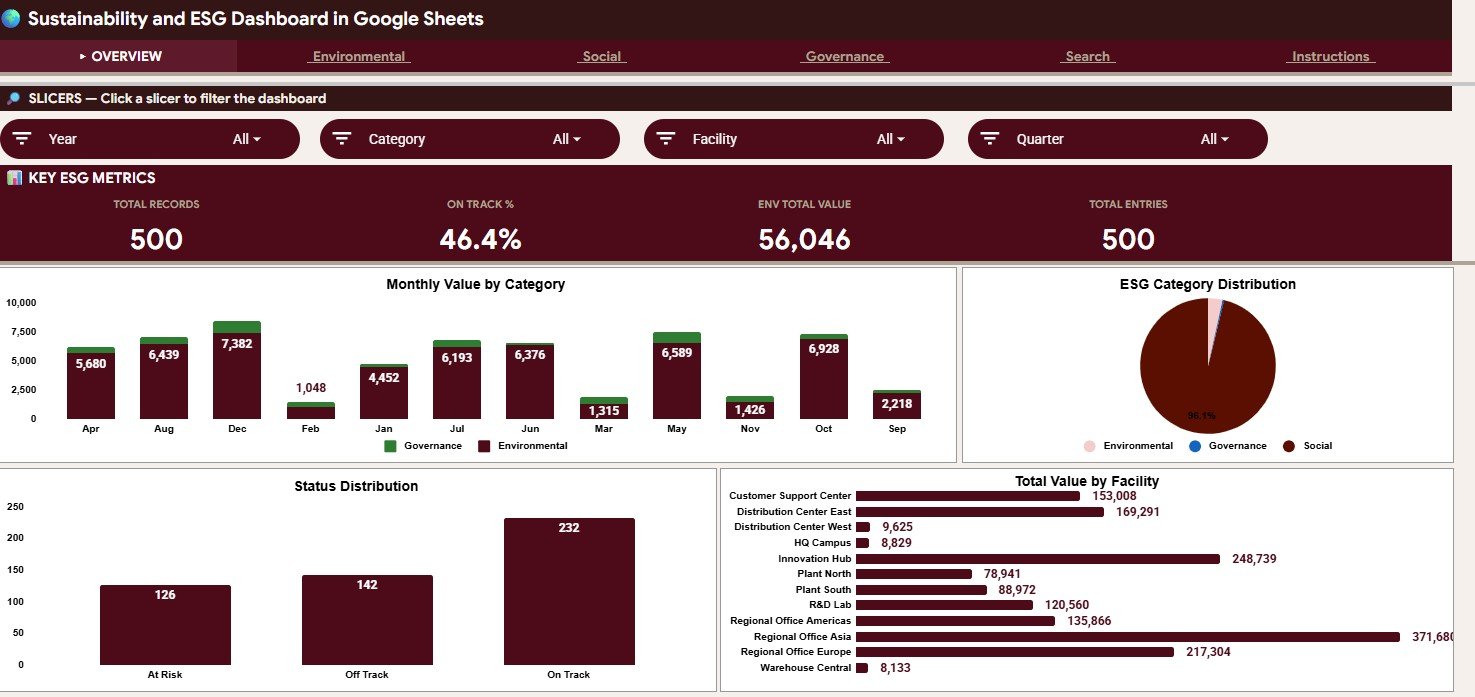
The overview page includes high-level cards for Total Records, On Track %, Env Total Value, and Total Entries. These cards are designed to give decision-makers a fast read on data volume, target alignment, environmental contribution, and the overall record base.
The dashboard uses charts for month-by-category value trends, ESG category value share, status mix, and facility performance. Google also supports dashboard-style work through Sheets charts and embedded chart views, as outlined in its Google Sheets chart documentation. In this template, charts and slicers work together so users can filter the analysis quickly and focus on a specific period, facility, department, category, or status.
The workbook also includes separate Environmental, Social, and Governance tabs, plus a Record Lookup Search sheet and a Data sheet. That structure keeps the file easy to audit: raw entries stay in one consistent table, while analysis pages stay clean and focused.
Dashboard Pages Explanation
Overview Page
The Overview page brings the full ESG dataset into one executive-style view. The top cards show Total Records, On Track %, Env Total Value, and Total Entries so users can quickly understand how many ESG activities have been captured and whether performance is aligned with targets.
The Monthly Value by Category chart stacks Environmental and Governance values month by month (Social values are much larger and sit on their own tab). It helps teams spot seasonal movements, rising activity, or months that need deeper review.
The ESG Category Distribution pie shows each category’s share of total value. In the sample data Social takes 96.1% because Community Investment is recorded in USD, which is why it is worth comparing like-for-like metric types on the category tabs as well.
The Status Distribution chart breaks records into three status groups: On Track, Off Track and At Risk (232, 142 and 126 records in the sample data, which is where the 46.4% On Track figure comes from). It gives managers a practical checkpoint for follow-up and accountability.
The Total Value by Facility chart compares ESG value across facilities. Teams can use it to identify locations that contribute strongly, need support, or require further investigation.
Environmental
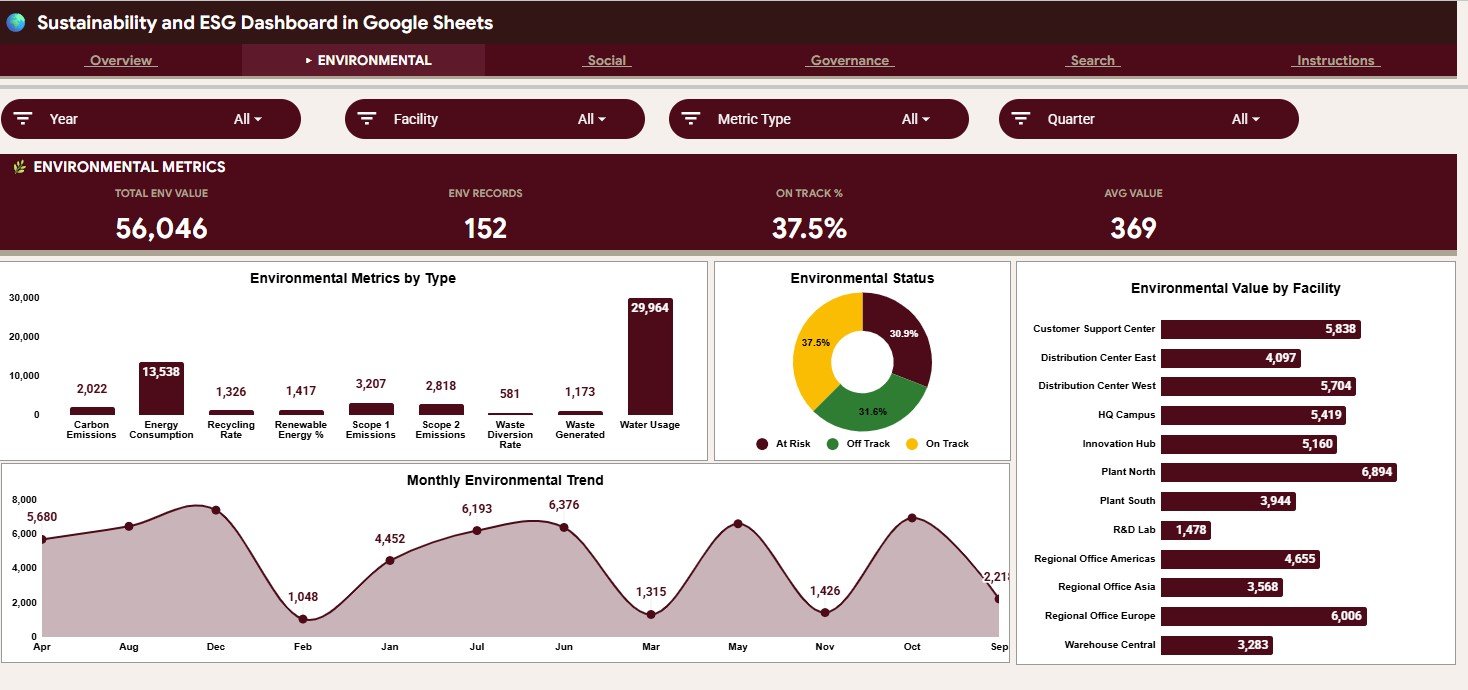
The Environmental tab covers nine metric types in the sample data: Carbon Emissions, Energy Consumption, Recycling Rate, Renewable Energy %, Scope 1 Emissions, Scope 2 Emissions, Waste Diversion Rate, Waste Generated and Water Usage. Environmental Value by Metric Type helps users understand which metric categories contribute the most value.
Environmental Records by Status shows whether environmental actions are on track or need attention. Environmental Value by Facility compares facility-level performance, while Environmental Value by Month shows how environmental impact changes over time.
Social
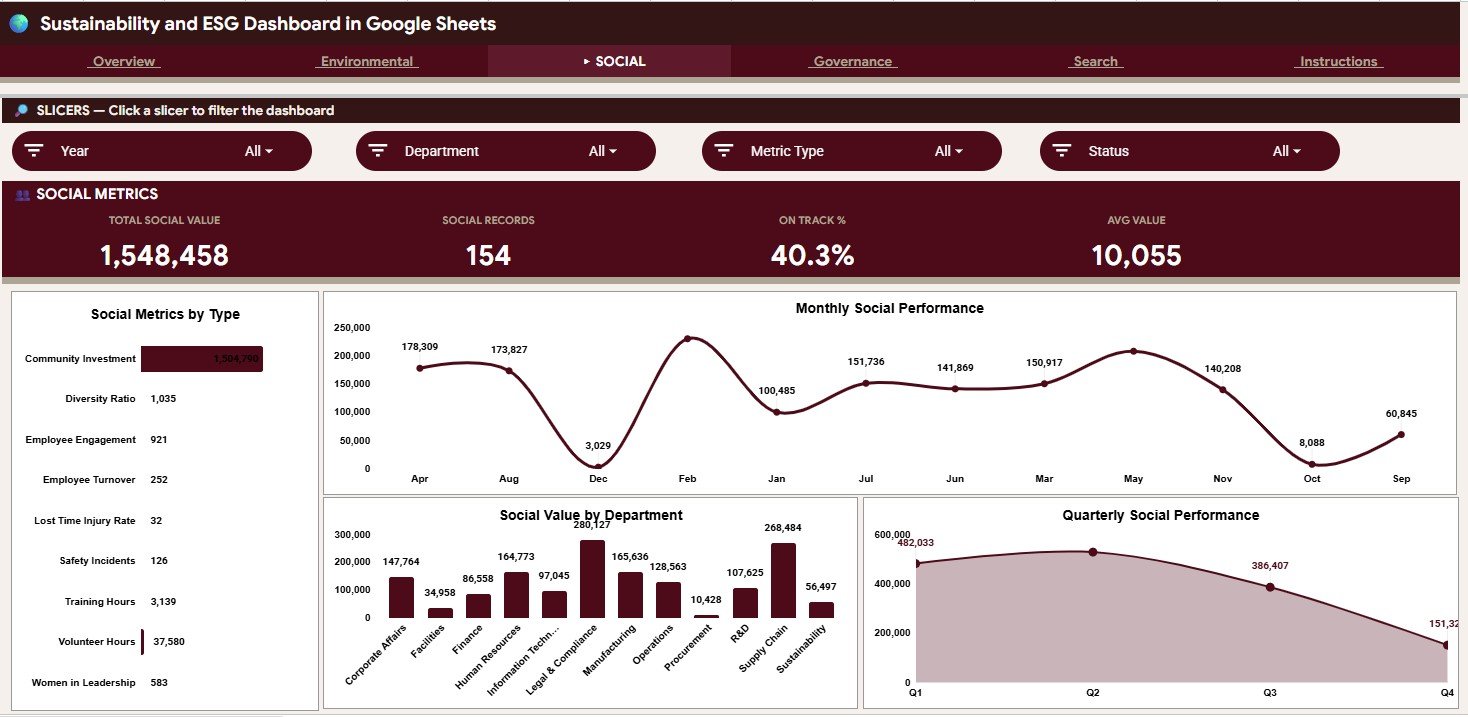
The Social tab is designed for people-focused records such as Community Investment, Diversity Ratio, Employee Engagement, Employee Turnover, Lost Time Injury Rate, Safety Incidents, Training Hours, Volunteer Hours and Women in Leadership. Social Value by Metric Type shows which social initiatives or metrics carry the most weight.
Social Value by Month helps teams monitor progress over time, while Social Value by Department highlights where social initiatives are happening inside the organization. Social Value by Quarter gives a cleaner reporting view for quarterly reviews and leadership updates.
Governance
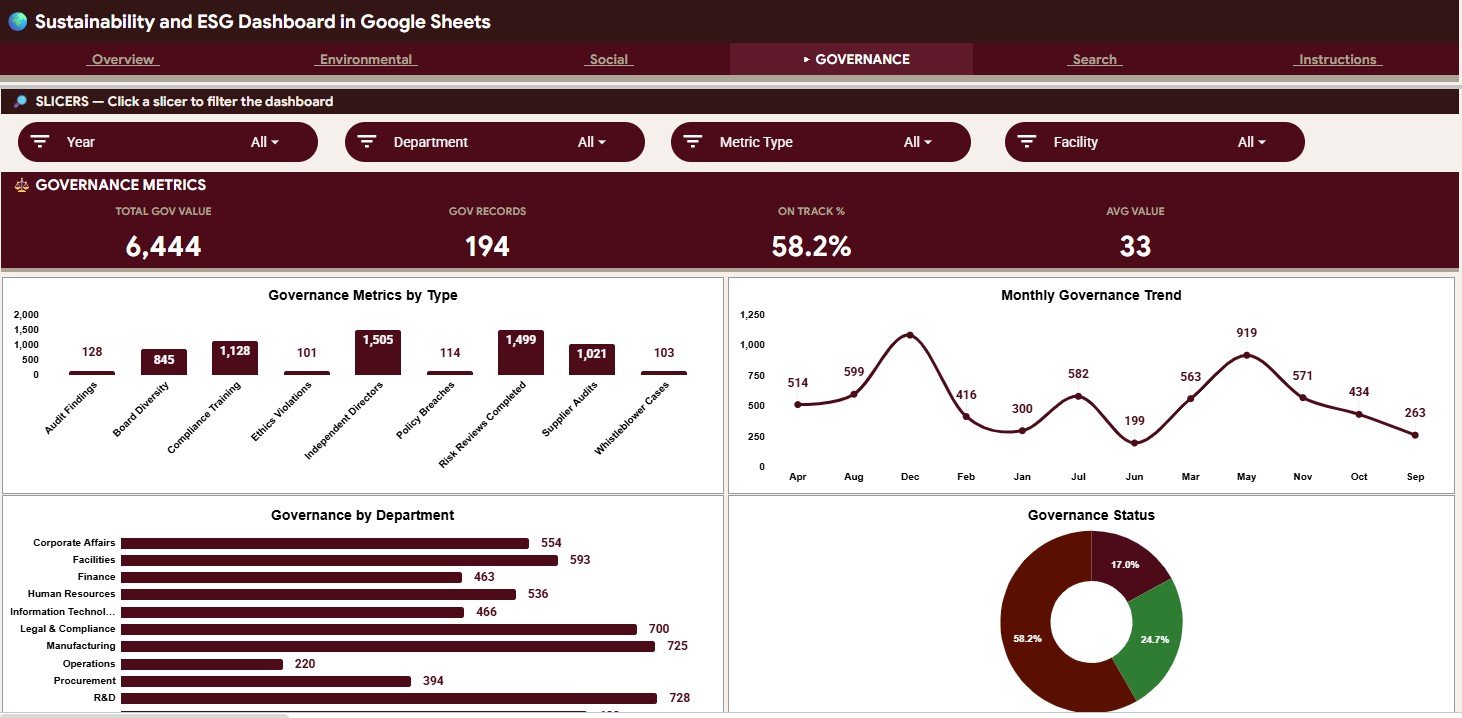
The Governance tab supports records such as Audit Findings, Board Diversity, Compliance Training, Ethics Violations, Independent Directors, Policy Breaches, Risk Reviews Completed, Supplier Audits and Whistleblower Cases. Governance Value by Metric Type shows which governance metrics are most active or important.
Governance Value by Month tracks activity trends, Governance Value by Department compares internal ownership, and Governance Records by Status gives a clear view of follow-up needs. This helps turn governance reporting into a repeatable management process.
ESG Record Lookup Search Sheet
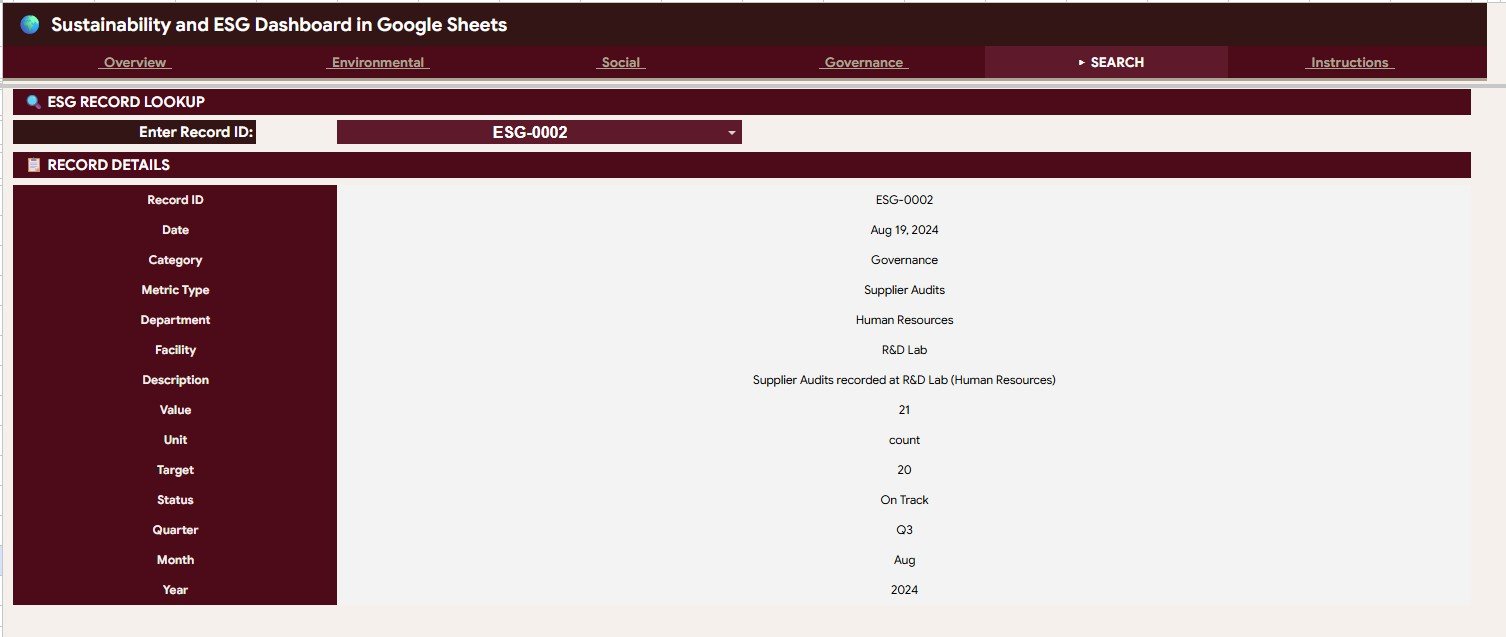
The lookup sheet is useful when a user needs to inspect one record without scrolling through the full dataset. By selecting a Record ID, the sheet displays the full ESG record, including date, category, metric type, department, facility, description, value, unit, target, status, quarter, month, and year.
This is helpful during internal reviews, management meetings, audit preparation, and data correction. Instead of filtering a large table manually, users can search one record and verify its details in a clean format.
Data Sheet Tab
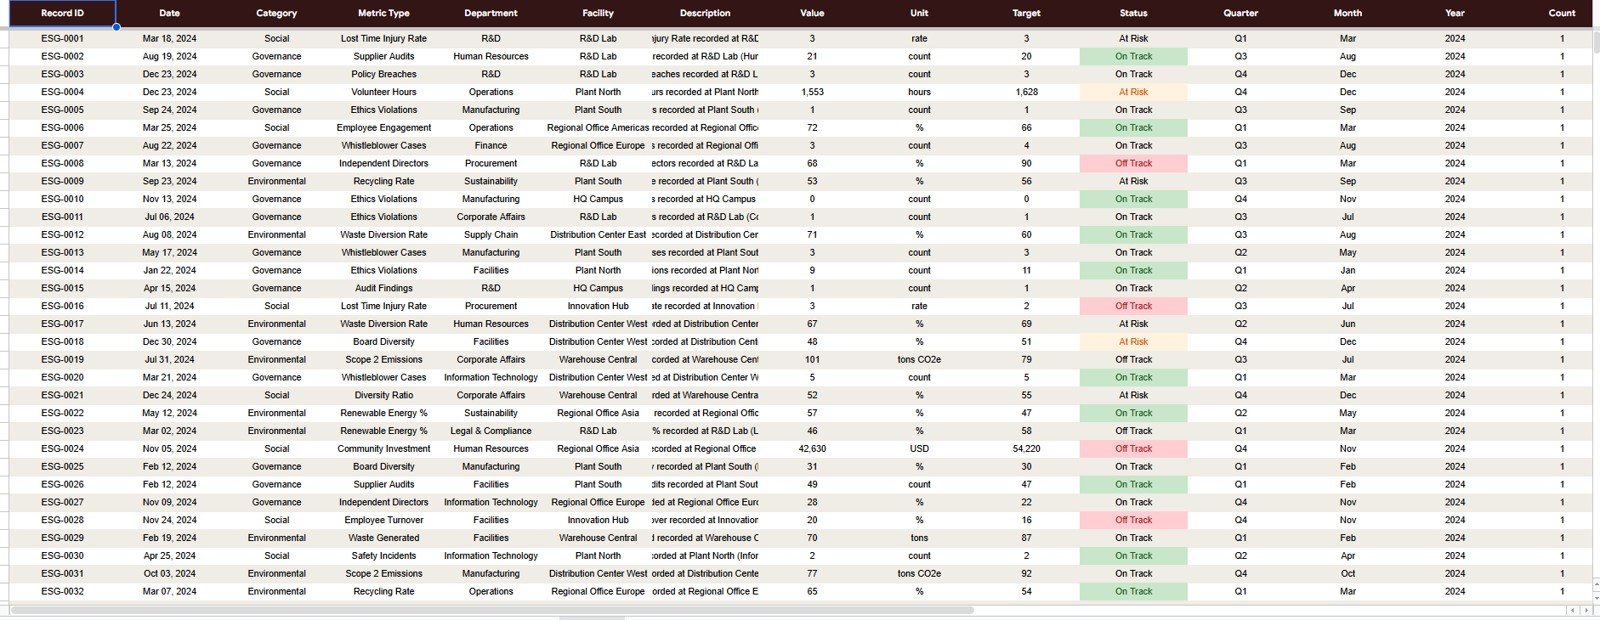
The Data sheet is where users add ESG records in the same structured format used by the dashboard. Consistent columns make it easier to maintain clean reporting data, refresh charts, and compare performance across categories and periods.
Because the dashboard depends on a structured data table, teams should use consistent naming for facilities, departments, status values, metric types, and units. That discipline keeps slicers reliable and makes reporting easier to explain.
KPI Cards on Each Page
Every dashboard page opens with four KPI cards. The figures below are from the sample data in the screenshots, so you can see how each card relates to the records.
| Page | KPI cards | Sample values | How they relate |
|---|---|---|---|
| Overview | Total Records, On Track %, Env Total Value, Total Entries | 500 · 46.4% · 56,046 · 500 | On Track % = On Track records ÷ all records (232 ÷ 500) |
| Environmental | Total Env Value, Env Records, On Track %, Avg Value | 56,046 · 152 · 37.5% · 369 | Avg Value = Total Env Value ÷ Env Records |
| Social | Total Social Value, Social Records, On Track %, Avg Value | 1,548,458 · 154 · 40.3% · 10,055 | Avg Value = Total Social Value ÷ Social Records |
| Governance | Total Gov Value, Gov Records, On Track %, Avg Value | 6,444 · 194 · 58.2% · 33 | Avg Value = Total Gov Value ÷ Gov Records |
Slicers differ by page: the Overview filters by Year, Category, Facility and Quarter; Environmental by Year, Facility, Metric Type and Quarter; Social by Year, Department, Metric Type and Status; and Governance by Year, Department, Metric Type and Facility.
Comparison Table
| Option | Best For | Limitations |
|---|---|---|
| Basic spreadsheet tracker | Small lists of ESG records | Usually lacks visual dashboards, slicers, and lookup views |
| Enterprise ESG platform | Large organizations with complex reporting programs | Can be expensive and slower to customize |
| Sustainability and ESG Dashboard in Google Sheets | Teams that need fast setup, editable reporting, and clear charts | Requires disciplined data entry and periodic review |
Who Should Use This Dashboard
This Google Sheets ESG dashboard is a strong fit for sustainability managers, ESG reporting leads, small business owners, operations teams, compliance coordinators, nonprofit administrators, consultants, and analysts who need a practical reporting structure. It is also useful for organizations preparing ESG updates for leadership, investors, clients, grant providers, or internal committees.
Real-World Use Cases
A manufacturing company can use the dashboard to compare environmental metrics by facility and monitor whether energy, waste, or emissions actions are on track. A consulting firm can use it as a client-ready ESG reporting tracker for recurring status meetings.
A nonprofit can use the Social tab to track community initiatives, staff training, program activity, and quarterly progress. A corporate governance team can use the Governance tab to monitor policy updates, audits, compliance tasks, and departmental ownership.
Advantages
The biggest advantage is speed. Users can start with a ready-made ESG dashboard instead of building charts, cards, slicers, and lookup logic from scratch. The spreadsheet format also keeps the system familiar for teams that already use Google Workspace.
The dedicated ESG tabs improve clarity. Instead of forcing all metrics into one generic dashboard, the template separates environmental, social, and governance analysis while preserving an executive overview. The search sheet adds another layer of usability by making individual records easy to inspect.
Limitations to Know
Like any spreadsheet-based system, the dashboard depends on clean source data. Teams should assign ownership for data entry, define status values clearly, and review new records before monthly or quarterly reporting. Also note that the value totals add up records with different units (tonnes, kWh, hours, percentages, counts), so read them as activity indicators and compare like-for-like metric types when you need exact figures.
Organizations with formal assurance requirements may also need additional documentation outside the dashboard, such as approval notes, evidence files, policy references, and audit trails. The dashboard can support those workflows, but it should be paired with the right governance process.
Best Practices
Start by agreeing on ESG categories, metric types, units, status names, departments, and facility labels. Keep those values consistent so filters and charts remain accurate.
Update the Data sheet on a regular schedule, such as weekly or monthly, instead of waiting until a reporting deadline. Before presenting the dashboard, check unusual spikes, blank fields, duplicate records, and records without targets.
Use the Overview page for leadership summaries, then move into the Environmental, Social, or Governance tabs when someone asks for detail. For individual questions, use the Record Lookup Search sheet to verify the exact source record.
Explore Relevant Templates
If you want to go deeper on one part of ESG reporting, these related guides on NeoTech Navigators cover narrower dashboards:
- ESG Environmental Dashboard in Google Sheets for environment-only tracking.
- Carbon Footprint KPI Dashboard in Google Sheets for emissions KPIs.
- Sustainability Reporting KPI Dashboard in Google Sheets for KPI-style sustainability reports.
- CSR & Sustainability Performance Tracker in Google Sheets for CSR programmes.
Related products on NextGenTemplates include the Energy Consumption Analysis Dashboard and the Renewable Energy KPI Dashboard. If you want to learn how dashboards like this are built, the Excel Pivot Tables & Dashboards course on NextGenTemplates Academy walks through the pivot-and-chart method step by step.
Frequently Asked Questions
Can I edit the dashboard?
Yes. The template is built in Google Sheets, so you can edit the data, labels, formulas, and charts after making your own copy.
Does it include separate ESG category pages?
Yes. The workbook includes Overview, Environmental, Social, Governance, Search (record lookup) and Data tabs, plus an Instructions tab.
Can I filter the dashboard?
Yes. Each dashboard page has four slicers, using combinations of Year, Category, Facility, Quarter, Department, Metric Type and Status.
Is this a formal ESG compliance filing tool?
No. It is a practical dashboard and tracking template. Organizations should still review applicable reporting standards, assurance needs, and disclosure requirements with qualified advisors.
What status values does it use?
Records are marked On Track, Off Track or At Risk against their target. The On Track % cards count the share of records with an On Track status.
Can I use it for quarterly reporting?
Yes. The Social tab includes quarter-level analysis, and the structured data fields support month, quarter, and year reporting views.
About the Author
NeoTech Navigators creates practical tutorials, templates, and digital tools for spreadsheets, dashboards, automation, analytics, and business reporting. Our goal is to help teams turn everyday data into clear decisions without unnecessary complexity.
Wrapping Up
The Sustainability and ESG Dashboard in Google Sheets gives teams a simple, editable, and presentation-ready way to manage ESG records. With overview cards, category-specific tabs, slicers, lookup search, and a structured Data sheet, it helps users track sustainability activity and explain results with confidence. Paste your own ESG records into the Data tab, keep the category, metric and status names consistent, and the dashboard pages refresh with them.
Get the Sustainability and ESG Dashboard
📅 Last updated: October 2026