The Plumbing Contractor Dashboard in Google Sheets turns a simple job log into a live business report, tracking 4 headline KPIs and 13 interactive charts across 6 working tabs. Setup takes under 10 minutes: replace the sample rows in the Data tab and every KPI card, chart and slicer redraws on its own.
Click here to Purchase the Plumbing Contractor Dashboard in Google Sheets.
Most plumbing businesses still track jobs in scattered notebooks or basic spreadsheets, then guess at month-end how much they actually earned and which technician carried the load. This Google Sheets plumbing dashboard fixes that with a single, shareable file — no monthly software fees and nothing new to learn for a team already using Google Workspace.
Key Features of the Plumbing Contractor Dashboard in Google Sheets
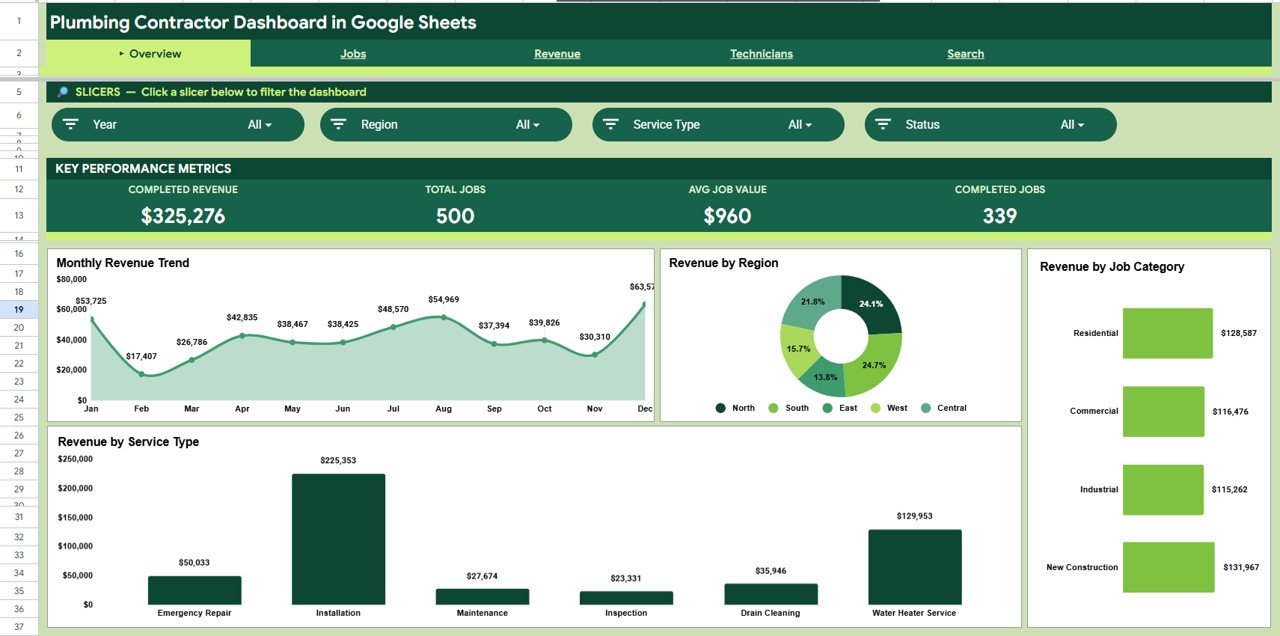
The dashboard tracks 4 KPIs — Completed Revenue, Total Jobs, Average Job Value and Completed Jobs — on the Overview tab, giving you the state of the business at a glance. Across the analysis tabs it builds 13 charts spanning revenue, jobs, material cost and technician performance.
Slicers on the Overview let you filter by region, service type and job category with a single click, refiltering every chart instantly. A dedicated Search tab acts as a Job Record Lookup, returning any job’s full detail from one Job ID. Because it lives in Google Drive, the whole crew can open the same link on any device.
- 4 live KPI cards that recalculate as you add jobs
- 13 charts across Overview, Jobs, Revenue and Technicians tabs
- Slicer filters for region, service type and job category
- Job Record Lookup by Job ID on the Search tab
- Data tab with a fixed column format that feeds everything
Dashboard Pages Explanation
Overview Page
The Overview tab shows the four KPI cards above four charts — Revenue by Month, Revenue by Region, Revenue by Job Category and Revenue by Service Type — with slicers across the top to filter the entire page instantly.
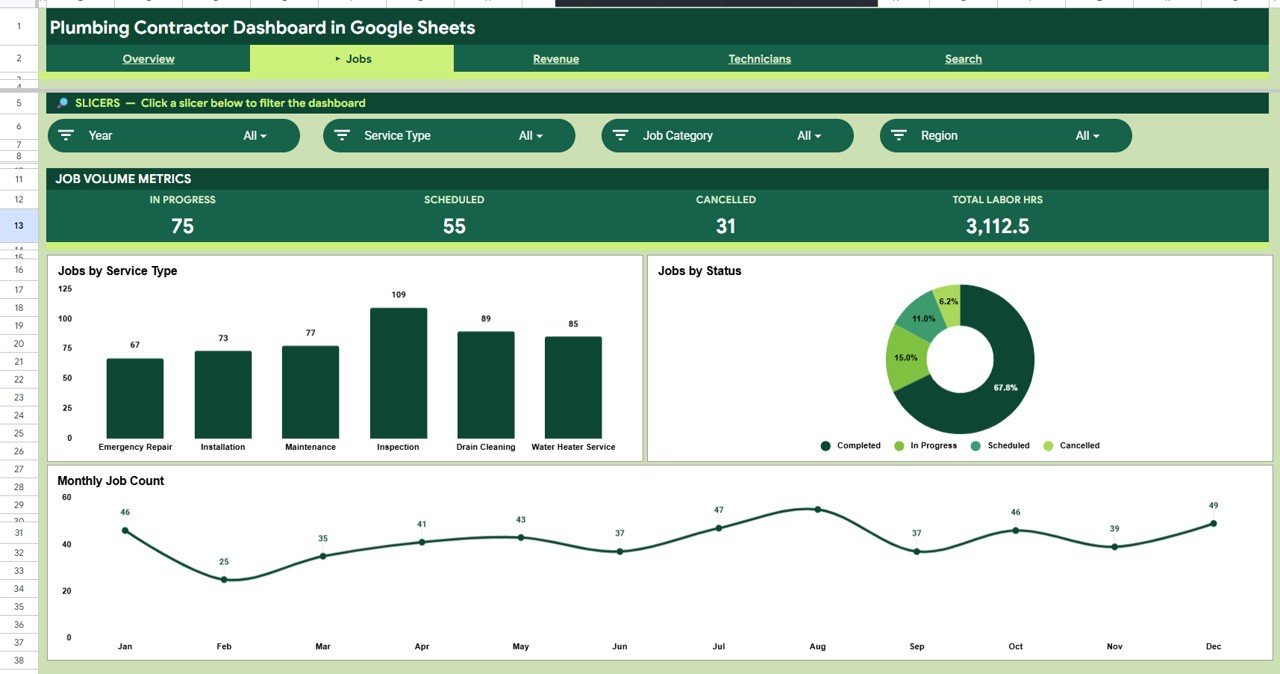
Jobs Page
Click here to Purchase the Plumbing Contractor Dashboard in Google Sheets.
The Jobs tab analyses your workload with Jobs by Service Type, Jobs by Status and Job Count by Month, so you can see the balance of repairs, installs and maintenance and how completed versus pending jobs trend over the year.
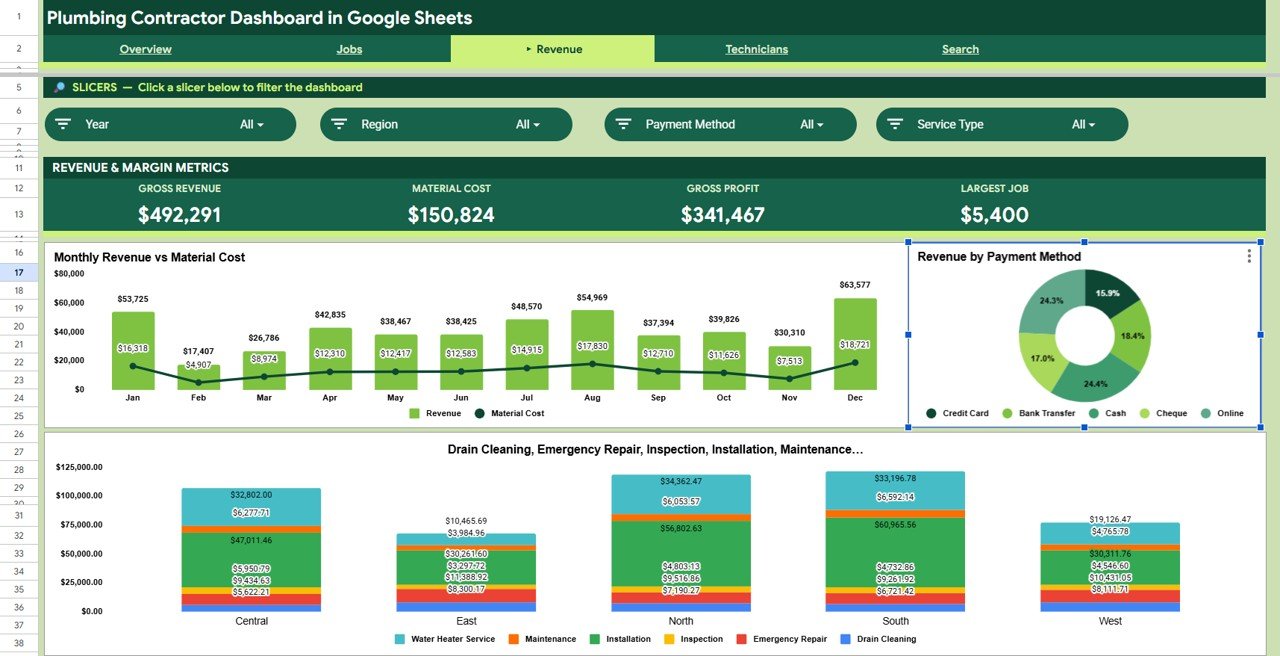
Revenue Page
The Revenue tab compares Revenue vs Material Cost by Month, then breaks income down by Revenue by Payment Method and Revenue by Region and Service Type, helping you find your most profitable work and protect margins.
Technicians Page
Click here to Purchase the Plumbing Contractor Dashboard in Google Sheets.
The Technicians tab ranks the crew with Revenue by Technician, Jobs by Technician and Total Labor Hours by Technician, making it simple to see who drives income and how the workload is shared.

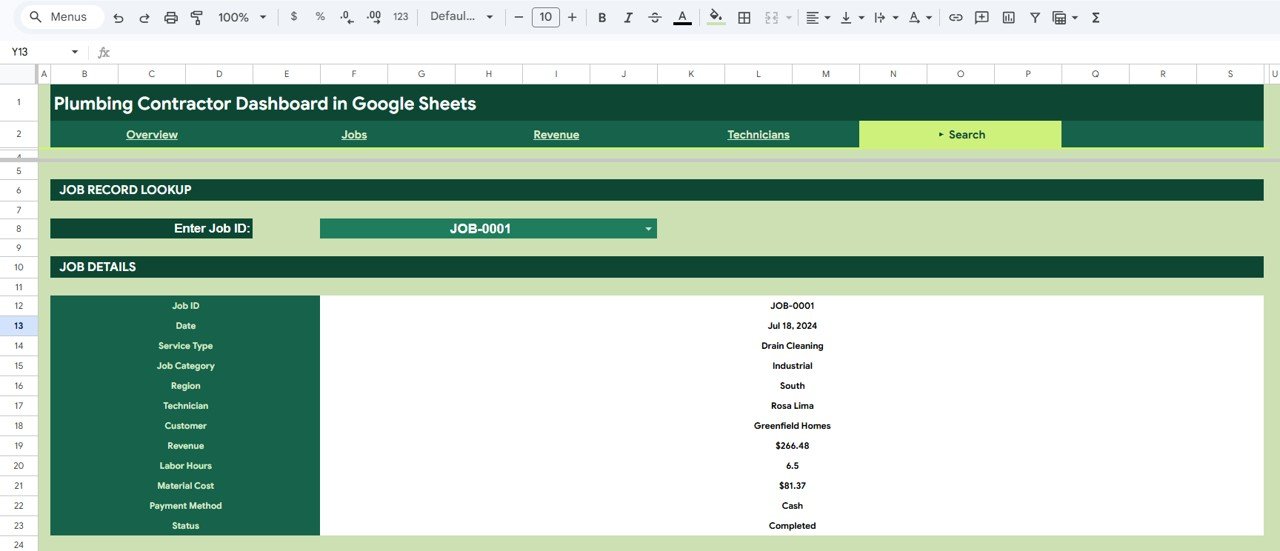
Search Sheet
The Search tab is a Job Record Lookup. Enter any Job ID and it returns the Date, Service Type, Job Category, Region, Technician, Customer, Revenue, Labor Hours, Material Cost, Payment Method and Status for that job.
Data Sheet
Click here to Purchase the Plumbing Contractor Dashboard in Google Sheets.
The Data tab is your single source of truth. Add each job in the same column format and every KPI, chart and slicer across the dashboard updates automatically.

Plumbing Contractor Dashboard in Google Sheets vs. Excel Dashboard vs. Field-Service SaaS — Feature Comparison
| Feature | Plumbing Contractor Dashboard (Google Sheets) | Microsoft Excel Dashboard | ServiceTitan / Jobber / Housecall Pro |
|---|---|---|---|
| Cost | $9.99 one-time | $17.99 one-time | $49-300 / user / month |
| Platform | Google Sheets (cloud) | Desktop Excel file | Proprietary web + app |
| Setup time | Under 10 minutes | Under 10 minutes | Days to weeks of onboarding |
| Real-time team collaboration | Built-in (Google Drive) | Limited / needs OneDrive | Yes |
| Mobile access | Sheets app, any device | Excel mobile only | Native app |
| Customizable fields | Fully editable | Fully editable | Limited to vendor schema |
| Share with a link | One Drive link | Send file attachment | Account logins |
| Year-1 cost at 5 users | $9.99 total | $17.99 total | $2,940-18,000 |
| Owns your data | Your Google account | Your file | Stored on vendor servers |
For plumbing contractors who want live job and revenue tracking without paying $49+ per user every month for field-service software, the Plumbing Contractor Dashboard in Google Sheets sits in the sweet spot.
Who Should Use This Template
Perfect for:
- Independent plumbers and small plumbing companies (1-25 technicians)
- Owners tracking service calls, repairs, installs and maintenance in one place
- Office managers reporting monthly revenue, job counts and technician output
- Teams already in Google Workspace who want no new software to learn
Not a fit if:
- You need automated dispatch, GPS routing or live customer SMS
- You want invoicing, payment processing and inventory inside one system
- You expect automatic call-booking — this is a tracking and reporting dashboard, not a CRM
Real-World Use Cases
Mike runs a 6-technician plumbing company. He uses the Plumbing Contractor Dashboard in Google Sheets to track monthly completed revenue, see which regions bring the most installs, and review revenue per technician at his Friday team meeting — without paying $99 per user per month for field-service software.
Dana manages the office for a family plumbing business. Each month she filters the Overview by service type to separate emergency call-outs from scheduled maintenance, then uses the Revenue tab to compare income against material cost and keep margins healthy.
Sam is a solo plumber. He logs each job from his phone in the Data tab and uses the Search sheet to instantly pull a customer’s past job details when they call back about a repeat issue.
Advantages of the Plumbing Contractor Dashboard in Google Sheets
Click here to Purchase the Plumbing Contractor Dashboard in Google Sheets.
The biggest advantage is cost certainty: one $9.99 payment replaces a recurring per-seat subscription that can run into thousands of dollars a year for a small crew. Because everything sits in Google Sheets, there is no install, no licence renewal and no vendor lock-in — your data stays in your own Google account.
The slicer-driven design also saves real time. Instead of rebuilding pivot reports each month, you click a region or service type and the whole Overview refilters, so a monthly review that used to take an hour becomes a five-minute glance.
Opportunities for Improvement
This template is built for reporting, not operations, so it does not schedule jobs, send customer reminders or process payments — large plumbing firms that need dispatch and invoicing in one place will still want dedicated field-service software. Very high data volumes (tens of thousands of rows) can also slow any Google Sheets file, so businesses logging thousands of jobs per month may eventually want a database-backed tool. For most independent and small plumbing contractors, though, these limits rarely bite.
Best Practices
Enter every job in the Data tab using the exact column format provided so the charts and Search lookup keep working. Use consistent spelling for regions, technicians and service types — “North” and “North Zone” will split into two slicer values. Keep one master copy in a shared Drive folder and give technicians edit access so the dashboard stays current in real time. Review the Revenue vs Material Cost chart monthly to catch jobs where material spend is eating your margin.
Explore Relevant Templates
If you run a related service business, NextGenTemplates has matching Google Sheets dashboards: the Landscaping Dashboard in Google Sheets, the Pest Control Dashboard in Google Sheets, the Security Company Dashboard in Google Sheets, the Home Inspection Dashboard in Google Sheets and the Tutoring Business Dashboard in Google Sheets. Prefer Microsoft tools? The same template is available as a Plumbing Contractor Dashboard in Excel and a Plumbing Contractor Dashboard in Power BI. To learn how the filtering works under the hood, see Google’s guide to slicers in Google Sheets.
Frequently Asked Questions
Click here to Purchase the Plumbing Contractor Dashboard in Google Sheets.
What KPIs does the Plumbing Contractor Dashboard in Google Sheets track?
The Plumbing Contractor Dashboard in Google Sheets tracks 4 headline KPIs — Completed Revenue, Total Jobs, Average Job Value and Completed Jobs — plus 13 charts covering revenue, jobs, material cost and technician performance. Every metric updates automatically when you replace the sample data.
How long does setup take?
Setup takes under 10 minutes. Make your own copy of the Plumbing Contractor Dashboard in Google Sheets, paste your jobs into the Data tab using the existing column format, and the KPI cards, charts and slicers redraw on their own.
How does this compare to field-service software like Jobber or ServiceTitan?
Those platforms cost $49-300 per user each month and bundle dispatch and invoicing. The Plumbing Contractor Dashboard in Google Sheets is a one-time $9.99 reporting tool — ideal if you want clear job and revenue analytics without an ongoing subscription.
Do I need Excel or special software?
No. The Plumbing Contractor Dashboard in Google Sheets runs entirely in Google Sheets with a free Google account, so it opens on any desktop, tablet or phone with nothing to install.
Can I filter the dashboard by region or service type?
Yes. The Overview tab includes slicers for region, service type and job category. Click any value and the Plumbing Contractor Dashboard in Google Sheets refilters every KPI and chart instantly.
Can my whole team use it at once?
Yes. Because the Plumbing Contractor Dashboard in Google Sheets lives in Google Drive, you can share one link so technicians and office staff view or edit together in real time.
About the Author
Built by PK — Microsoft Certified Professional with 15+ years of Excel, Google Sheets, and Power BI experience. Founder of NextGenTemplates, reaching 300K+ subscribers across YouTube channels. Every template is hand-built and tested before release.
Conclusion
If you want a clear, shareable view of your plumbing business without another monthly bill, the Plumbing Contractor Dashboard in Google Sheets gives you live KPIs, 13 charts and an instant job lookup in one file. Click here to Purchase the Plumbing Contractor Dashboard in Google Sheets.
Instant download · One-time payment · No subscription. For step-by-step video tutorials, visit YouTube.com/@NeoTechNavigators.
Last updated: June 2026