Running a landscaping company means juggling dozens of jobs, multiple crews, several regions, and a mix of residential and commercial clients — and most owners try to track it all in scattered spreadsheets or expensive field-service software. The Landscaping Dashboard in Google Sheets replaces that mess with one connected workbook that tracks 4 headline KPIs, 15+ charts, and 6 interactive sheets, all updating automatically the moment you add a new job.
👉 Click here to Purchase the Landscaping Dashboard in Google Sheets
Built entirely in Google Sheets, this dashboard needs no add-ons, no macros, and no monthly subscription. Setup takes under 10 minutes: paste your jobs into the Data sheet, and the cards, charts, pivot tables, and project Search page refresh on their own. In this post we’ll walk through every sheet, compare it to Excel and paid SaaS tools, and show who gets the most value from it.

Key Features of the Landscaping Dashboard in Google Sheets
The Landscaping Dashboard in Google Sheets tracks 4 headline KPIs — Total Revenue, Total Projects, Avg Project Value, and Completed Projects — across 6 connected sheets. Every metric recalculates automatically when you add a job row, so the dashboard is always current.
- 4 live KPI cards sit at the top of the Overview sheet and update instantly.
- 15+ pre-built charts break revenue down by region, service type, client type, crew, project size, payment method, and month.
- Native slicers filter the whole dashboard by region, service, or client in a single click, because they are bound directly to the underlying pivot tables.
- A project Search page lets you pick any Project ID and see that job’s full record on one screen.
- 100% Google Sheets — share it with a link, open it on mobile, or export to PDF and Excel.
Dashboard Pages Explanation
👉 Click here to Purchase the Landscaping Dashboard in Google Sheets
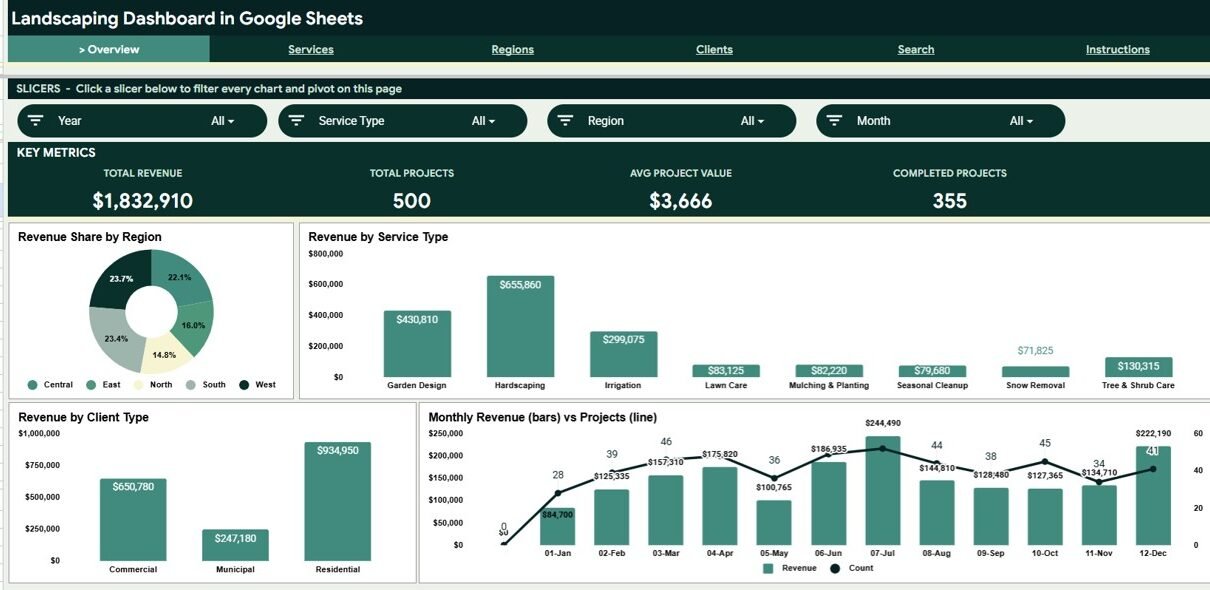
Page 1: Overview
The Overview sheet leads with the four KPI cards — Total Revenue, Total Projects, Avg Project Value, and Completed Projects — followed by four charts and a slicer row. Each chart is explained below:
- Revenue by Region — Compares total revenue across each service region. It shows which territories drive the most income and where coverage is thin.
- Revenue by Service Type — Splits revenue across services like lawn care, hardscaping, and maintenance. It reveals which offerings are most profitable.
- Revenue by Client Type — Breaks revenue into residential, commercial, and other categories. It highlights which client segment contributes the most sales.
- Revenue and Projects by Month — Plots monthly revenue alongside project counts on one timeline. It exposes seasonal peaks so you can plan crews and cash flow.
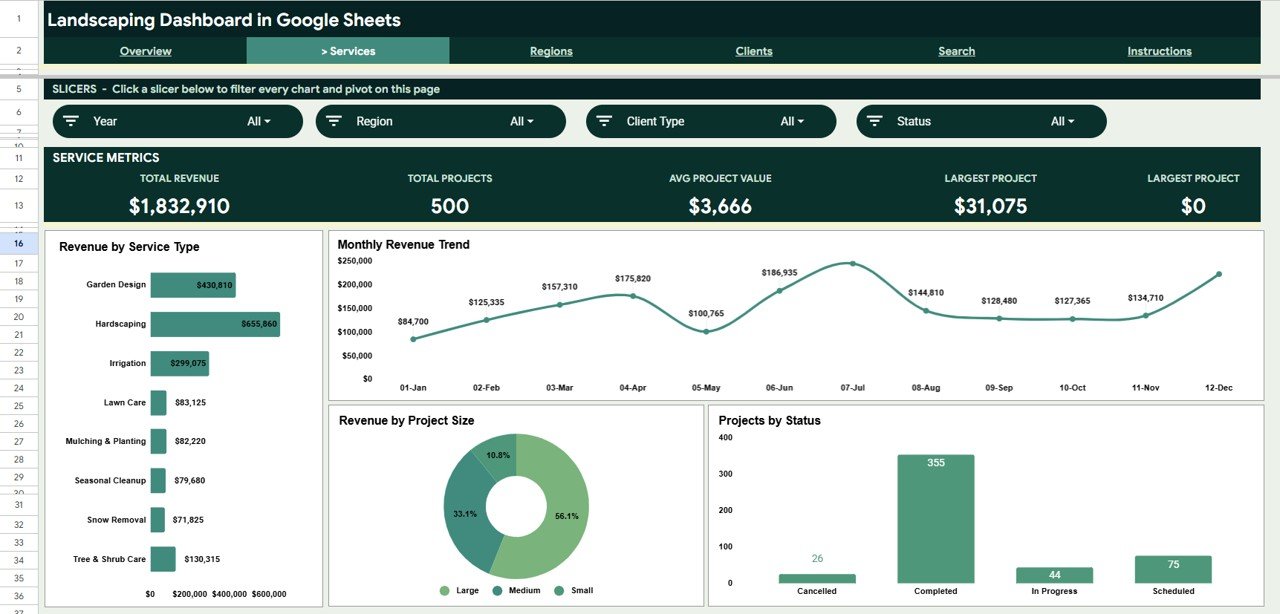
Page 2: Services
The Services sheet drills into what you sell, charting Revenue by Service Type, Revenue by Month, Revenue by Project Size, and Projects by Status. It helps you see which services earn the most and how jobs move from quoted to completed.
 Services
Page 3: Regions
The Regions sheet maps performance across territories, charting Revenue by Region, Revenue by Client Type, Revenue by Crew, and Revenue by Month. Use it to compare territories and assign crews where demand is highest.
 Regions
👉 Click here to Purchase the Landscaping Dashboard in Google Sheets
Page 4: Clients
The Clients sheet focuses on who pays you, charting Revenue by Client Type, Revenue by Payment Method, Projects by Size, and Revenue by Month. It surfaces your most valuable client segments and preferred payment channels.
 Clients
Search Sheet tab
The Search sheet is a single-project lookup. Select any Project ID from the dropdown and the page instantly displays that job’s date, service type, client type, region, crew, client name, revenue, payment method, project size, crew lead, and status — ideal for answering a client call on the spot.
 Search Sheet tab
👉 Click here to Purchase the Landscaping Dashboard in Google Sheets
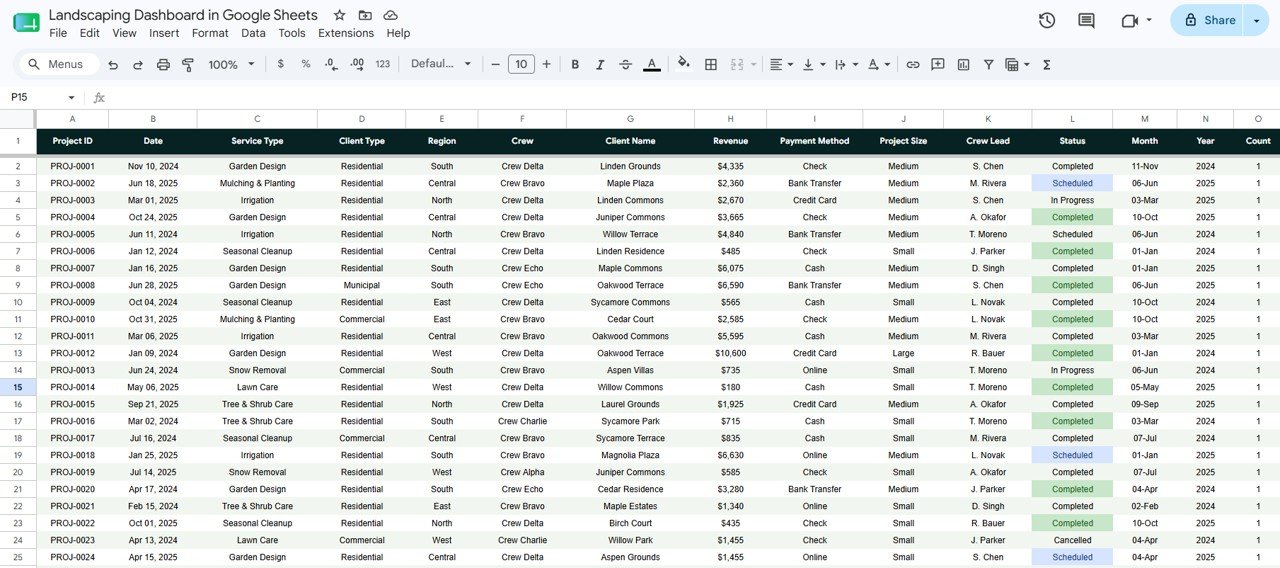
Data Sheet tab
The Data sheet is the engine. Add your jobs in the same column format provided and every card, chart, pivot, and the Search page update automatically — no formula edits needed. Google’s own guide to pivot tables in Google Sheets explains the underlying mechanism if you want to extend it further.
 Data Sheet tab
Landscaping Dashboard in Google Sheets vs. Microsoft Excel Dashboard vs. Paid Field-Service SaaS — Feature Comparison
| Feature | Landscaping Dashboard in Google Sheets | Microsoft Excel Dashboard | Jobber / Yardbook / Aspire |
|---|---|---|---|
| Cost | $9.99 one-time ✅ | $10–$20 one-time | $29–$199 / month |
| Platform | Google Sheets (cloud, any browser) ✅ | Desktop Excel | Web + mobile app |
| Setup time | Under 10 minutes ✅ | Under 10 minutes | Hours to onboard |
| Real-time team collaboration | Yes — built-in ✅ | Limited | Yes |
| Mobile access | Yes — Sheets app ✅ | Excel app needed | Yes |
| Customizable fields | Fully editable ✅ | Fully editable | Restricted to vendor schema |
| Share with link | Yes ✅ | No | Account login required |
| Crew & project-status tracking | Yes ✅ | Yes | Yes |
| Year-1 cost at 5 users | $9.99 total ✅ | $10–$20 total | $1,740–$11,940 |
For landscaping and lawn-care firms that want crew, revenue, and client analytics without paying monthly per-seat fees, the Landscaping Dashboard in Google Sheets sits in the sweet spot.
Who Should Use This Template
Perfect for:
- Owners of landscaping, lawn-care, and grounds-maintenance businesses with 1–50 crews.
- Operations managers comparing revenue by region, crew, and service type each month.
- Solo landscapers who want professional reporting without paying for Jobber or Aspire.
Not a fit if:
- You need live GPS dispatch, route optimization, and automated invoicing.
- You require role-based permissions, audit logs, or SOC 2 compliance inside the tool.
Real-World Use Cases
Marcus owns a 12-crew landscaping company in Texas. He uses the Landscaping Dashboard in Google Sheets to compare revenue by region each month, spot which crews bring in the most work, and decide where to hire next — without paying $199 a month for Aspire.
Priya runs a residential lawn-care startup. By tracking Revenue by Service Type and Revenue by Payment Method, she sees that maintenance contracts and card payments drive most of her cash flow, then leans into recurring plans.
Dan, an operations manager, answers client calls fast. When a customer asks about a job, he opens the Search sheet, selects the Project ID, and reads back the date, crew, revenue, and status in seconds.
Advantages of the Landscaping Dashboard in Google Sheets
👉 Click here to Purchase the Landscaping Dashboard in Google Sheets
- Saves money: a one-time $9.99 purchase versus $348–$2,388 per year for field-service SaaS at entry tiers.
- Saves time: automatic pivots and charts mean no manual report-building each month.
- Always accessible: cloud-based, so any crew lead or partner can view it from a phone or laptop.
- Fully yours: edit services, regions, crews, and client types freely — nothing is locked to a vendor schema.
Opportunities for Improvement
The Landscaping Dashboard in Google Sheets is a reporting and analytics tool, not an operations platform. It does not include live GPS tracking, automated invoicing, or customer scheduling — for those you would still need dedicated software. Very large datasets (tens of thousands of rows) can also slow down Google Sheets, so high-volume operators may want to archive older seasons into separate files.
Best Practices
- Keep the Data sheet column order intact so the pivots and Search page keep working.
- Enter consistent labels for regions, services, and crews so charts group cleanly.
- Duplicate the file each year to keep performance fast and seasons separated.
- Use the slicers to brief crews — filter to one region before a weekly meeting.
Explore Relevant Templates
If you run a service business, these companion dashboards share the same slicer-driven layout:
- Pest Control Dashboard in Google Sheets
- Moving Company Dashboard in Google Sheets
- Photography Business Dashboard in Google Sheets
- Tutoring Business Dashboard in Google Sheets
You can also browse the full Google Sheets Dashboards collection on NextGenTemplates.
Frequently Asked Questions
👉 Click here to Purchase the Landscaping Dashboard in Google Sheets
What KPIs does the Landscaping Dashboard in Google Sheets track?
The Landscaping Dashboard in Google Sheets tracks 4 headline KPIs — Total Revenue, Total Projects, Avg Project Value, and Completed Projects — plus 15+ charts covering revenue by region, service type, client type, crew, project size, payment method, and month.
How long does setup take?
Setup takes under 10 minutes. Copy the Landscaping Dashboard in Google Sheets to your Drive, paste your jobs into the Data sheet in the same column order, and every card, chart, and pivot updates automatically.
How does this compare to Jobber or Aspire?
Jobber and Aspire charge $29–$199 per month, while the Landscaping Dashboard in Google Sheets is a $9.99 one-time purchase. It focuses on reporting and analytics rather than live dispatch, making it ideal for small firms that mainly need clear revenue and crew insights.
Can I use it on my phone?
Yes. Because the Landscaping Dashboard in Google Sheets runs entirely in Google Sheets, you can open it in the free Sheets mobile app, apply slicers, and check the Search sheet from any job site.
Do I need to know formulas or coding?
No. The Landscaping Dashboard in Google Sheets is built with pivot tables, slicers, and charts. You only add data on the Data sheet — everything else recalculates on its own.
Can I customize the services, regions, or crews?
Yes. Every field in the Landscaping Dashboard in Google Sheets is editable. Update the service types, regions, crews, and client types on the Data sheet and the pivots and charts adapt to your own categories.
About the Author
Built by PK — Microsoft Certified Professional with 15+ years of Excel, Google Sheets, and Power BI experience. Founder of NextGenTemplates, reaching 300K+ subscribers across YouTube channels. Every template is hand-built and tested before release. Subscribe at YouTube.com/@NeoTechNavigators for step-by-step video tutorials.
Conclusion
The Landscaping Dashboard in Google Sheets turns scattered job records into clear revenue, crew, and client insights for a one-time $9.99 — no subscription, no per-user fees. If you want professional reporting without the cost of field-service SaaS, this template is the fastest way to get there.
👉 Click here to Purchase the Landscaping Dashboard in Google Sheets
Instant download · One-time payment · No subscription
Last updated: June 2026