Moving Company Dashboard in Google Sheets is a ready-to-use reporting template for moving-company owners, dispatch managers, relocation teams, and operations analysts who need to track revenue, move volume, service mix, customer ratings, and individual move details in one collaborative spreadsheet. The template includes 6 sheet tabs, 4 executive KPI cards, 20+ analysis views, slicers for quick filtering, and a Move ID search page. Instead of paying $99-$399 per user per month for a specialized moving CRM just to review basic performance data, this dashboard gives small teams a one-time $9.99 reporting layer that can be copied into Google Drive and used immediately.
The dashboard is built in Google Sheets, so your team can share access, review updates in the browser, and work from the same source file. You can view the Moving Company Dashboard in Google Sheets product page on NextGenTemplates.
Click here to purchase the Moving Company Dashboard in Google Sheets.
Key Features of Moving Company Dashboard in Google Sheets
- 6 connected sheet tabs: Overview, Operations, Revenue, Customers, Search, and Data.
- 4 high-level KPI cards: Total Revenue, Total Moves, Avg Revenue, and Avg Rating.
- Revenue analysis: Compare sales by move type, service type, move size, and month.
- Operations analysis: Review move status, truck size, move volume, and monthly job mix.
- Customer analysis: Track rating distribution, origin-city demand, and rating by move type.
- Move ID search: Select a move and review date, service, cities, distance, revenue, crew, truck, status, rating, and month.
- Editable source data: Replace the sample records with your own moving job data.
- Google Sheets sharing: Use Drive permissions to share the dashboard with owners, dispatchers, finance, or consultants.
Dashboard Pages Explanation
Click here to purchase the Moving Company Dashboard in Google Sheets.
1. Overview Page
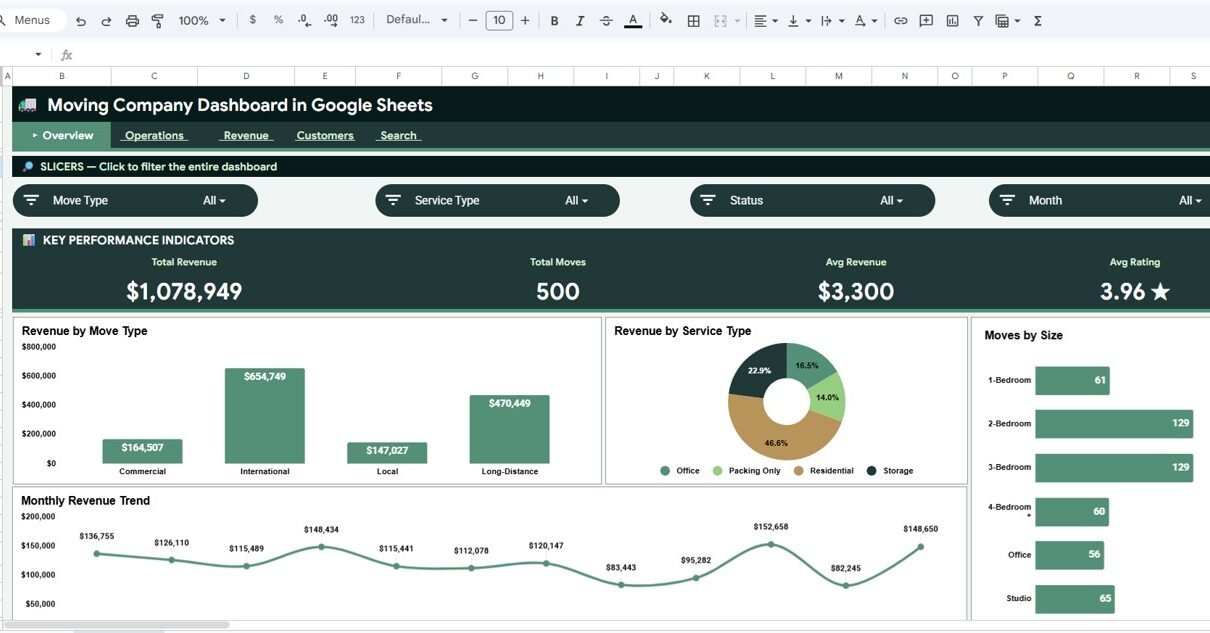
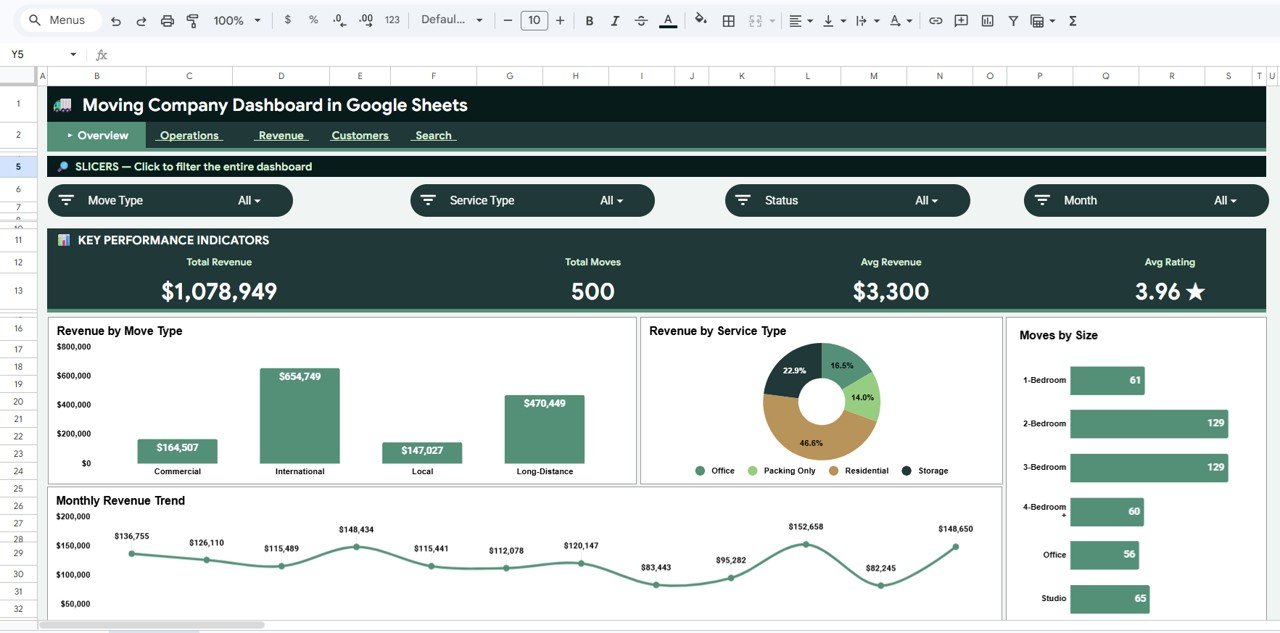
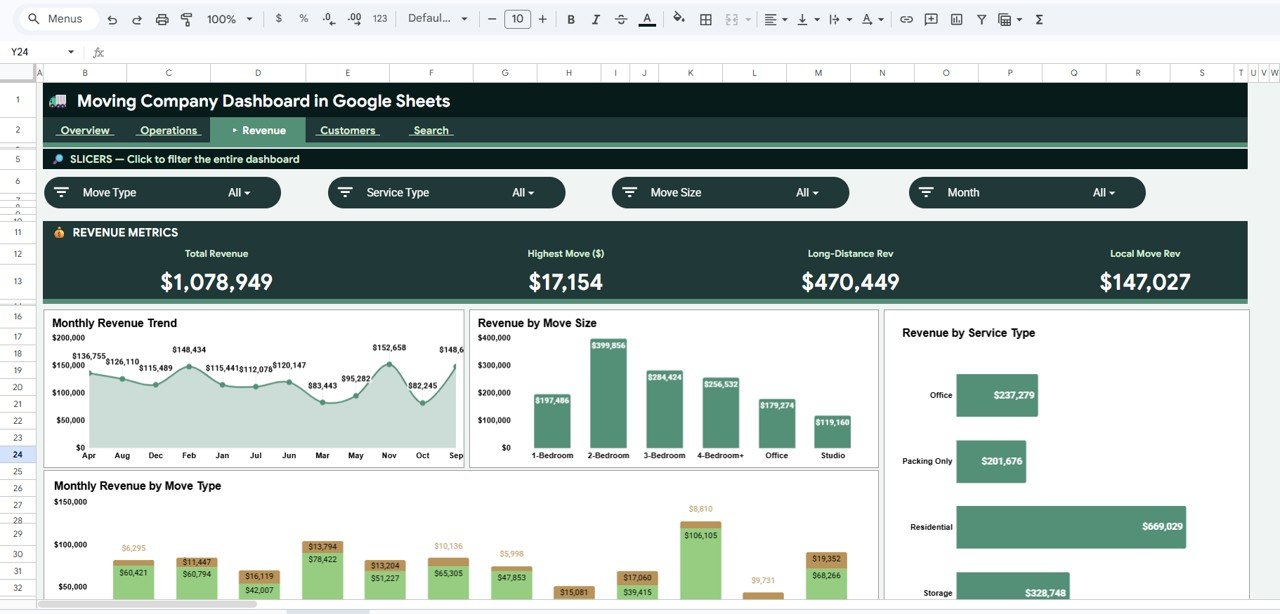
The Overview page is the executive summary. At the top, the KPI cards show Total Revenue, Total Moves, Avg Revenue, and Avg Rating, giving owners a fast read on sales volume, job count, average job value, and customer satisfaction.
Revenue by Move Type: This chart compares revenue across move categories such as local, long-distance, residential, commercial, or similar groups. It helps managers see which move types are producing the most revenue and deserve more marketing attention.
Revenue by Service Type: This chart shows revenue by service category. It helps compare packing, loading, full-service, transport, or storage-related work so the team can understand which services contribute the most sales.
Moves by Size: This chart breaks move count by move size. It helps dispatchers anticipate crew needs, vehicle demand, and workload balance.
Monthly Revenue by Month: This chart tracks revenue across months. It helps reveal seasonality, growth trends, and slow periods that may need extra sales activity.
2. Operations Page
Click here to purchase the Moving Company Dashboard in Google Sheets.
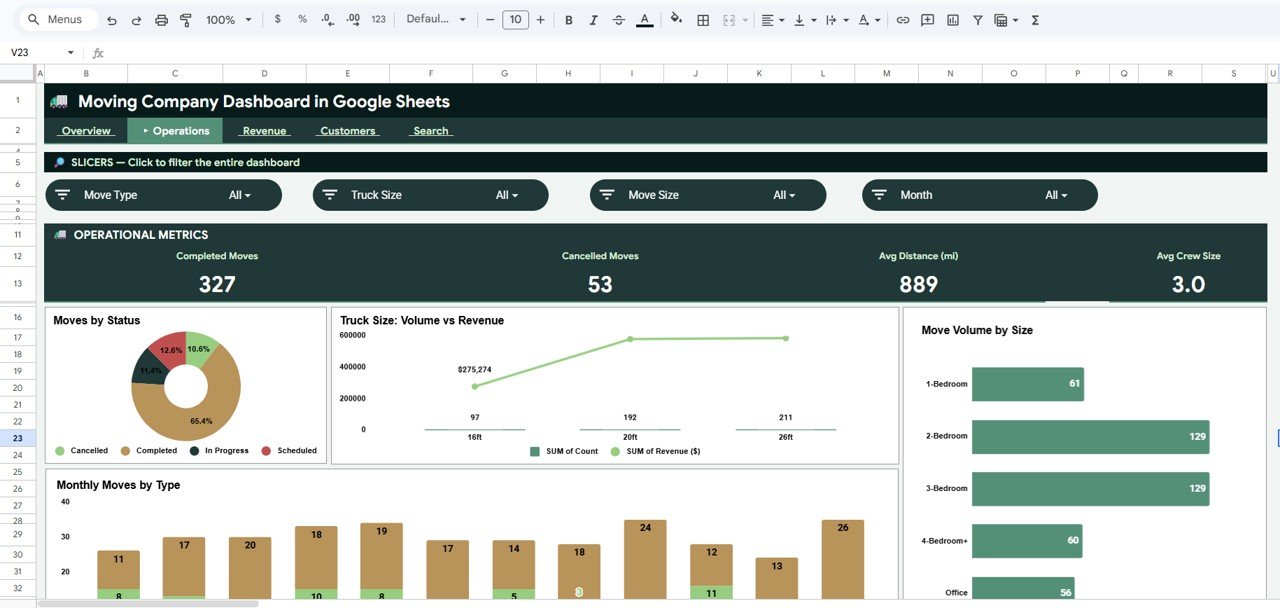
The Operations page is designed for job flow, status review, truck planning, and volume analysis. Dispatchers and operations managers can use this tab during daily or weekly reviews.
Moves by Status: This chart shows how jobs are distributed across statuses such as booked, completed, pending, or cancelled. It helps identify backlog, missed jobs, and completion patterns.
Move Volume and Revenue by Truck Size: This chart compares move count and revenue by truck size. It helps managers see which vehicle categories are driving revenue and whether fleet capacity aligns with demand.
Move Volume by Move Size: This chart shows how many jobs fall into each move-size group. It supports crew scheduling, truck assignment, and workload planning.
Monthly Moves by Move Type: This chart shows how job mix changes month by month. It helps moving companies plan staffing and marketing around seasonal service demand.
3. Revenue Page
The Revenue page focuses on financial performance and service mix. It is useful for owners, finance teams, and managers who want to understand where revenue is coming from.
Revenue by Month: This chart tracks sales over time. It helps compare current performance against earlier months and spot recurring peaks.
Revenue by Move Size: This chart shows whether small, medium, large, or custom move sizes produce the most revenue. It can support pricing decisions and resource allocation.
Revenue by Service Type: This chart compares service categories by revenue contribution. It helps identify profitable offerings and underused services.
Monthly Revenue by Move Type: This chart adds a monthly trend to move-type revenue. It helps managers see whether a specific move category is growing, declining, or seasonal.
Click here to purchase the Moving Company Dashboard in Google Sheets.
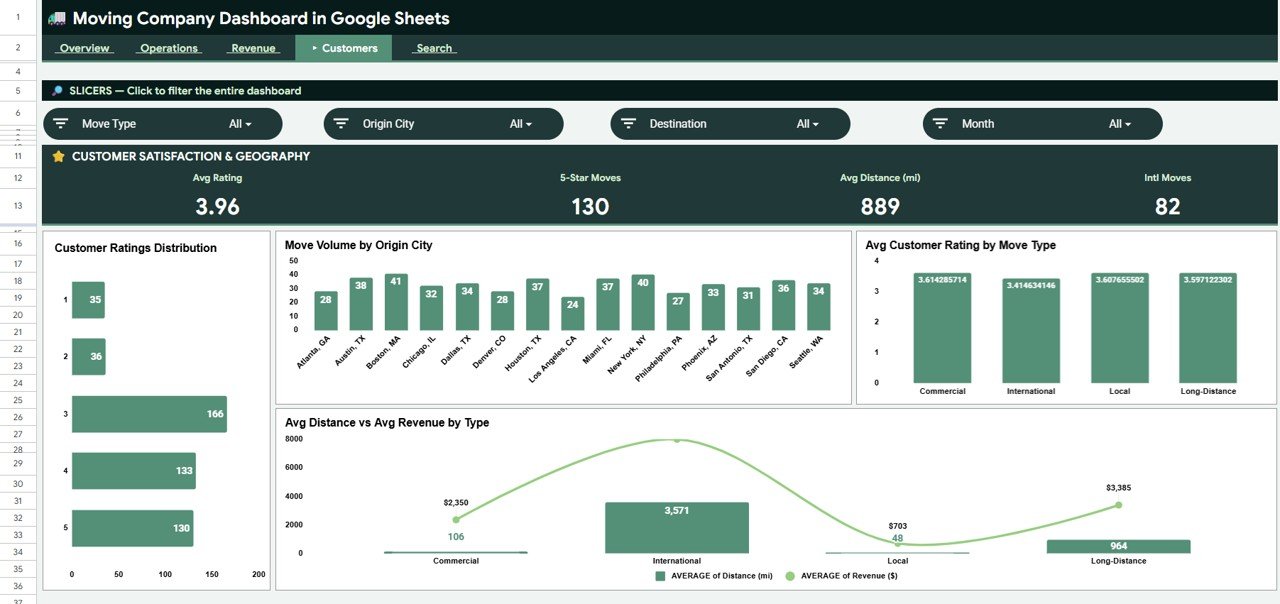
4. Customers Page
The Customers page connects service quality with demand patterns. It helps the business understand where customers are coming from and which move types are linked with stronger or weaker ratings.
Customer Ratings Distribution by Rating: This chart shows how ratings are distributed across the customer base. It gives a quick signal of service consistency and customer satisfaction.
Move Volume by Origin City: This chart shows which origin cities generate the most moves. It is useful for local marketing, territory planning, and branch-level analysis.
Average Customer Rating by Move Type: This chart compares satisfaction across move categories. It can reveal service types that need better process controls or crew training.
Average Distance and Average Revenue by Move Type: This chart compares distance and revenue by move type. It helps evaluate whether longer or more complex jobs are priced appropriately.
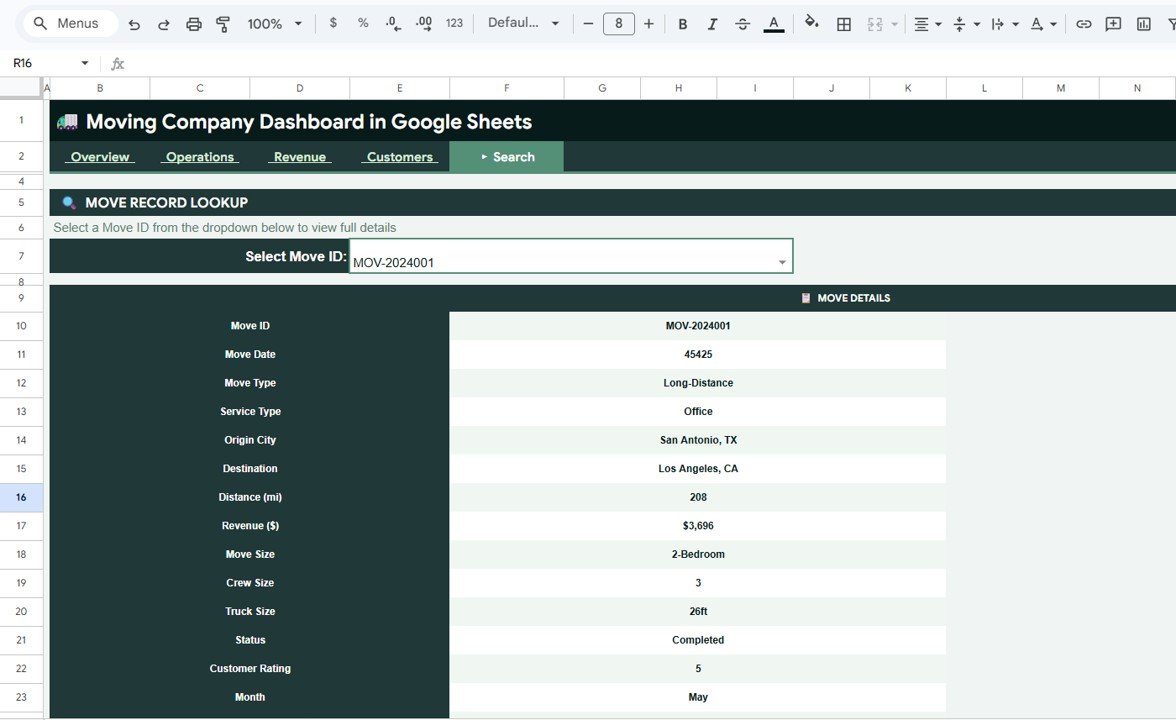
5. Search Sheet Tab
The Search sheet lets users review one move at a time by Move ID. Instead of filtering the full data table manually, the lookup page displays the selected move in a clean record format.
The fields include Move Details by Move ID, Move Date, Move Type, Service Type, Origin City, Destination, Distance, Revenue, Move Size, Crew Size, Truck Size, Status, Customer Rating, and Month. This makes the tab useful for customer callbacks, internal reviews, job audits, and quick dispatch questions.
Click here to purchase the Moving Company Dashboard in Google Sheets.
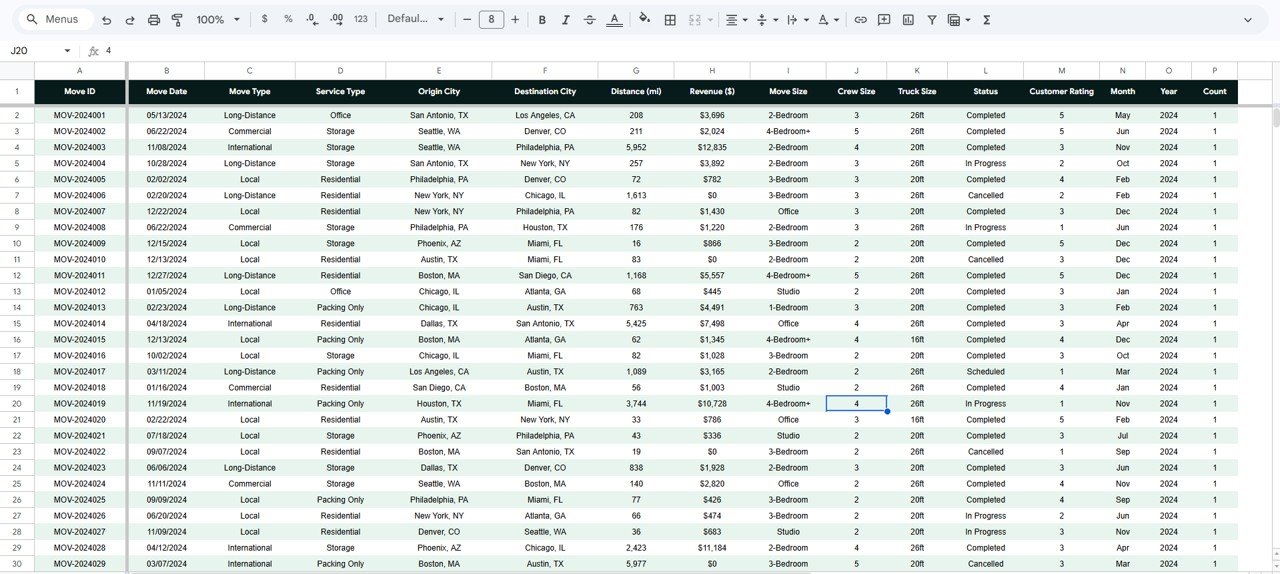
6. Data Sheet Tab
The Data sheet is where the source records are stored. Add your own moving job data in the same format so the KPI cards, slicers, charts, and lookup fields continue to work correctly.
For best results, keep field names consistent and use clean labels for move type, service type, origin city, destination, move size, truck size, status, and month. Consistent labels make slicers and charts easier to read.
Moving Company Dashboard in Google Sheets vs. Excel vs. Paid Moving Software – Feature Comparison
| Feature | This Google Sheets Dashboard | Excel Dashboard | Paid Moving SaaS |
|---|---|---|---|
| Cost | $9.99 one-time | One-time template cost | $99-$399/user/month |
| Platform | Google Sheets | Microsoft Excel | Vendor cloud platform |
| Setup time | Under 10 minutes after copying | Fast after opening the workbook | Often requires onboarding |
| Real-time team collaboration | Yes, through Google Drive | Limited unless using Microsoft 365 | Usually yes |
| Mobile access | Yes, through browser or Sheets app | Limited for full editing | Usually yes |
| Customizable fields | Fully editable | Fully editable | Often restricted by plan |
| Share with link | Yes | File sharing or OneDrive | Account-based access |
| Year-1 cost at 5 users | $9.99 total | Template cost plus setup time | Often $5,000+ |
| Move ID lookup | Built in | Requires workbook setup | Usually included |
| Best fit | Simple shared reporting | Offline spreadsheet reporting | Full booking and dispatch workflow |
If your team works in Google Workspace, Google explains sharing and permission options in its official guide to sharing files from Google Drive.
Who Should Use This Template
Click here to purchase the Moving Company Dashboard in Google Sheets.
- Moving-company owners who want a weekly performance dashboard.
- Dispatch managers tracking status, truck size, and move volume.
- Operations managers reviewing crew planning, service mix, and seasonal volume.
- Finance teams monitoring revenue by month, move type, service type, and move size.
- Customer service teams checking rating patterns and individual move records.
- Consultants creating simple reporting packs for small moving businesses.
Real-World Use Cases
Olivia runs a local moving company with 7 trucks. She reviews the Overview page every Monday to compare Total Revenue, Total Moves, Avg Revenue, and Avg Rating before assigning sales and crew priorities for the week.
Ravi manages dispatch for a regional relocation company. He uses the Operations page to watch Moves by Status and Move Volume by Move Size, helping him catch backlogs before weekend demand spikes.
Maya advises moving companies on customer experience. She uses the Customers page to compare ratings by move type and origin city, then recommends training or process changes for weaker segments.
Advantages of Moving Company Dashboard in Google Sheets
- Low cost: One-time $9.99 instead of another recurring software subscription.
- Easy sharing: Google Sheets works well for teams that already use Drive.
- Fast setup: Copy the file, replace the sample data, and start reviewing the dashboard.
- Editable structure: Change labels, charts, formulas, and fields as your reporting needs grow.
- Operational focus: The template covers status, truck size, move size, service type, ratings, and Move ID lookup.
Opportunities for Improvement
Click here to purchase the Moving Company Dashboard in Google Sheets.
This template is intentionally spreadsheet-based. Teams with higher move volume may want to add automated imports from booking software, protected ranges for formula areas, Apps Script alerts for low ratings, or a Looker Studio report connected to the Data sheet.
Larger companies may also want role-based permissions, live dispatch integrations, GPS tracking, customer portals, automated invoicing, and claims management. Those requirements belong in a full moving-company software stack, with this dashboard serving as a reporting layer.
Best Practices
- Keep the Data sheet structure stable. Rename fields only if you also update formulas and charts.
- Use consistent labels. Standardize move type, service type, status, move size, truck size, and city names.
- Update weekly. Fresh data keeps month-to-month trends useful.
- Protect formula cells. Use protected ranges so accidental edits do not break dashboard logic.
- Review revenue and ratings together. High revenue is less useful if a service type creates poor customer experience.
- Archive monthly copies. Save snapshots for audits, planning, and historical comparison.
Explore Relevant Templates
- Moving Company Dashboard in Excel – desktop spreadsheet version for Excel users.
- Moving Company Dashboard in Power BI – Power BI version for teams using Microsoft BI tools.
- Trucking and Logistics Dashboard in Google Sheets – broader logistics dashboard for shipment and fleet reporting.
- Transportation Operations Dashboard in Google Sheets – useful for wider transport operations reporting.
- Trucking and Logistics Dashboard in HTML – browser-based logistics reporting without spreadsheet software.
Frequently Asked Questions
What does the Moving Company Dashboard in Google Sheets track?
It tracks revenue, move count, average revenue, customer rating, move type, service type, move size, truck size, status, city, distance, crew size, and month.
Is this dashboard built fully in Google Sheets?
Yes. It is built as a Google Sheets dashboard, so you can copy it into Google Drive and edit the workbook directly.
Can I replace the sample data with my own move records?
Yes. Use the Data sheet tab and keep the same column format so the dashboard pages and search page continue working.
Does this template include slicers?
Yes. The dashboard includes slicers to filter charts and cards quickly by available fields.
Can multiple users work on this dashboard?
Yes. Because it uses Google Sheets, you can share access through Google Drive and allow viewing, commenting, or editing.
Does this replace moving-company CRM software?
No. It is a reporting dashboard. It does not replace booking, dispatch, SMS, invoicing, payroll, GPS tracking, or claims-management systems.
About the Author
Built by PK – Microsoft Certified Professional with 15+ years of Excel, Google Sheets, and Power BI experience. Founder of NextGenTemplates, reaching 300K+ subscribers across YouTube channels. Every template is hand-built and tested before release.
Conclusion
The Moving Company Dashboard in Google Sheets gives moving businesses a practical way to review revenue, move volume, service mix, truck planning, customer ratings, individual move records, and raw data in one shared workbook. It is not a full moving CRM, but it is a useful reporting layer for teams that want faster decisions without adding another monthly tool.
Click here to purchase the Moving Company Dashboard in Google Sheets.
Visit our YouTube channel for step-by-step tutorials: YouTube.com/@NeoTechNavigators
Last updated: May 22, 2026