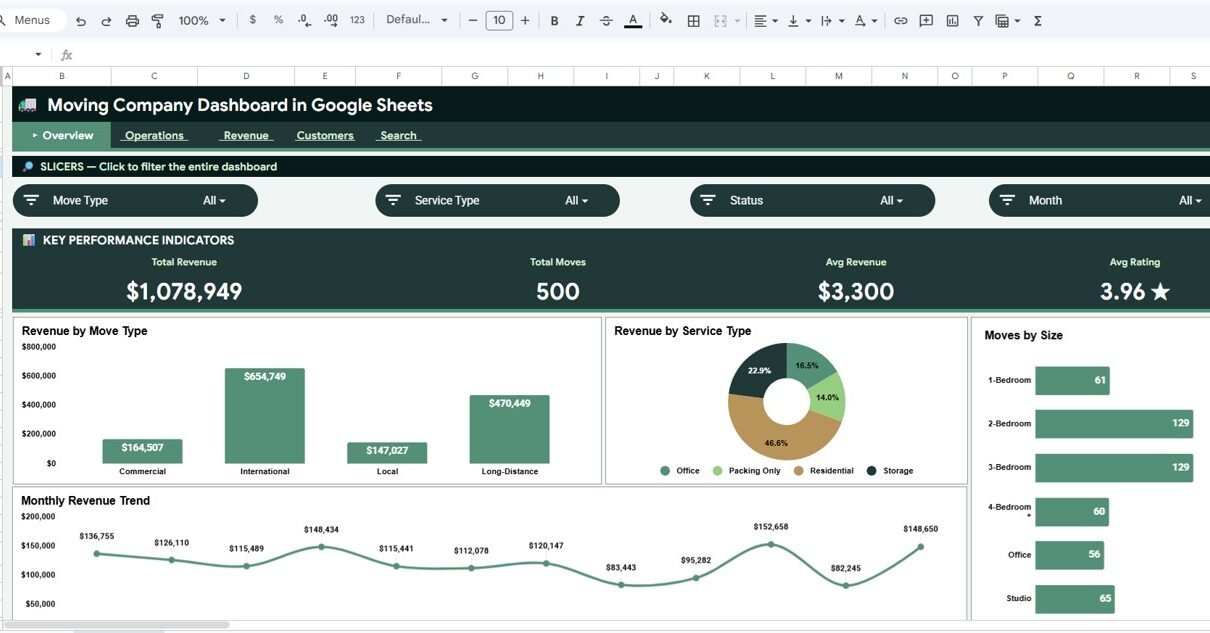
Moving Company Dashboard in Google Sheets helps moving businesses track revenue, operations, customer ratings, Move ID lookup, and source data across 6 connected tabs.
Online Tutorial for Data Analysis and Automation
Moving Company Dashboard in Google Sheets helps moving businesses track revenue, operations, customer ratings, Move ID lookup, and source data across 6 connected tabs.
Create a transportation operations dashboard in Google Sheets with KPI cards, slicers, shipment lookup, fleet analysis, route and delivery tracking, and financial performance views.
Track 10 transportation safety KPIs with automated MTD/YTD calculations, traffic light indicators, and trend analysis charts using this ready-to-use Google Sheets scorecard template.
Transportation businesses operate in a fast-paced environment. Deliveries must reach on time. Fuel costs fluctuate. Driver performance impacts service quality. Therefore, transportation companies must monitor KPIs continuously. However, many companies still track performance manually. As a result, they struggle to compare monthly performance. They fail to identify weak areas quickly. Moreover, they cannot analyze year-to-date […]
Tracking transportation performance through key metrics is essential for businesses in logistics, shipping, and supply chain management. One effective way to measure and analyze this data is through a Transportation KPI Dashboard in Google Sheets. This customizable dashboard allows you to manage and visualize key performance indicators (KPIs) in real-time, making it easier to monitor […]