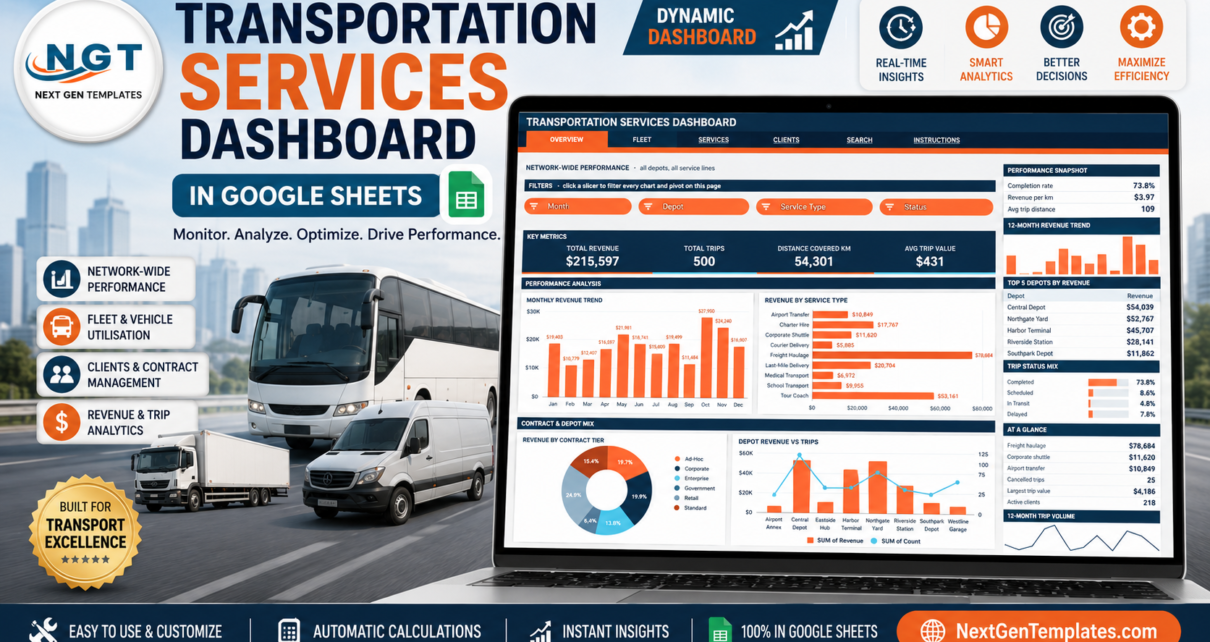
A six-page Google Sheets dashboard for transport operators – 500 sample trips, $215,597 of revenue, 16 slicers and 16 charts built on native pivot tables. Walk through every page, see what it does well, and learn where it stops.
Online Tutorial for Data Analysis and Automation
A six-page Google Sheets dashboard for transport operators – 500 sample trips, $215,597 of revenue, 16 slicers and 16 charts built on native pivot tables. Walk through every page, see what it does well, and learn where it stops.
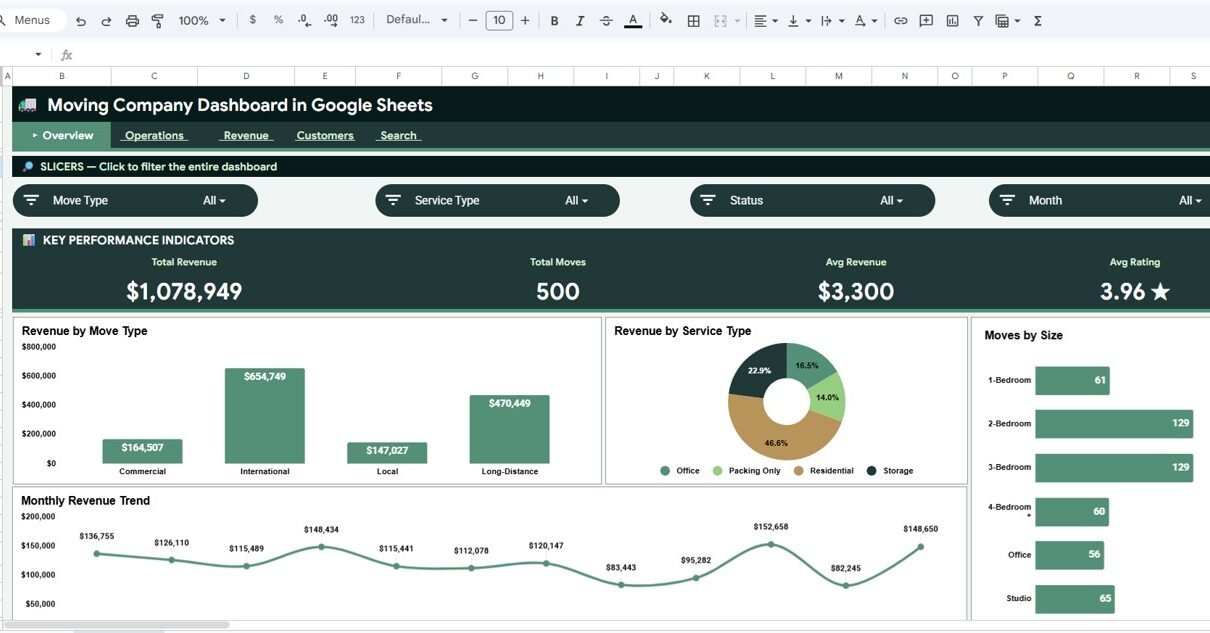
Moving Company Dashboard in Google Sheets helps moving businesses track revenue, operations, customer ratings, Move ID lookup, and source data across 6 connected tabs.
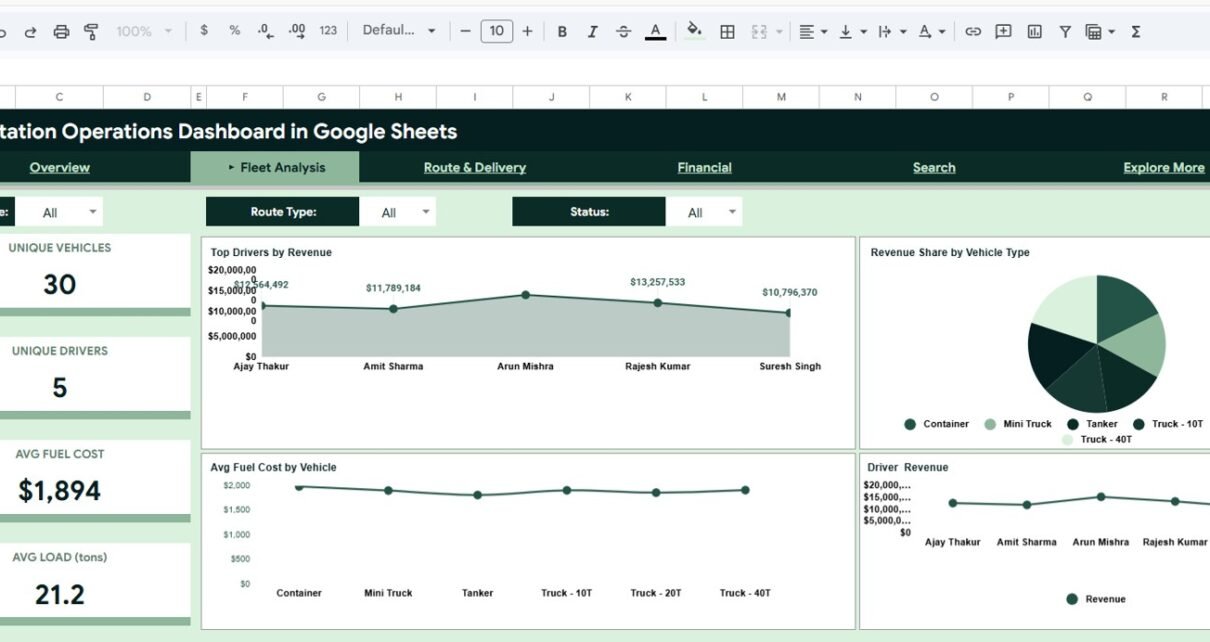
Create a transportation operations dashboard in Google Sheets with KPI cards, slicers, shipment lookup, fleet analysis, route and delivery tracking, and financial performance views.
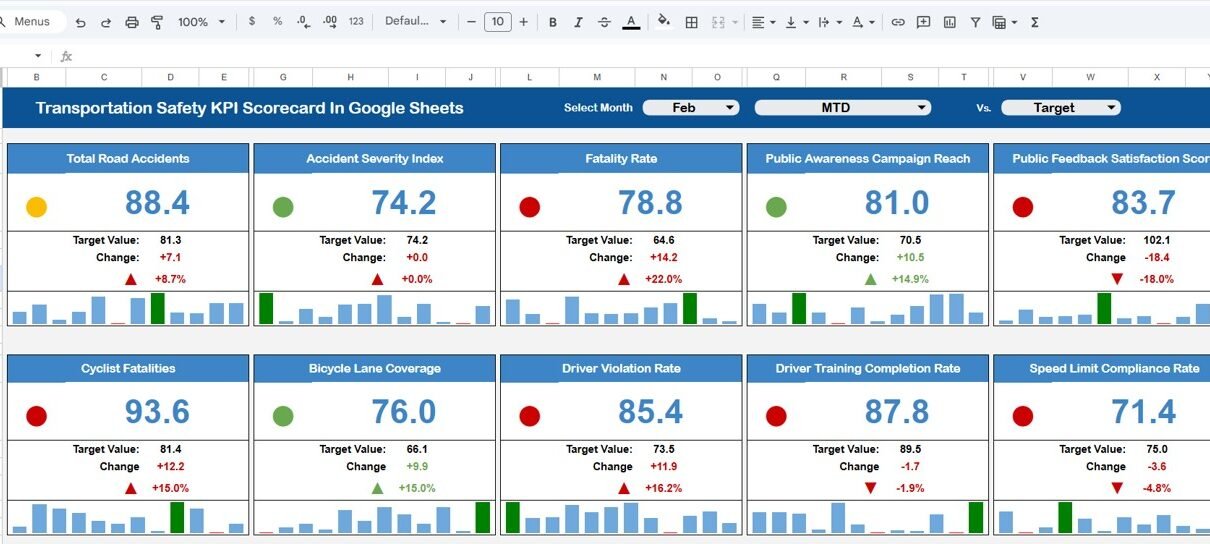
Track 10 transportation safety KPIs with automated MTD/YTD calculations, traffic light indicators, and trend analysis charts using this ready-to-use Google Sheets scorecard template.
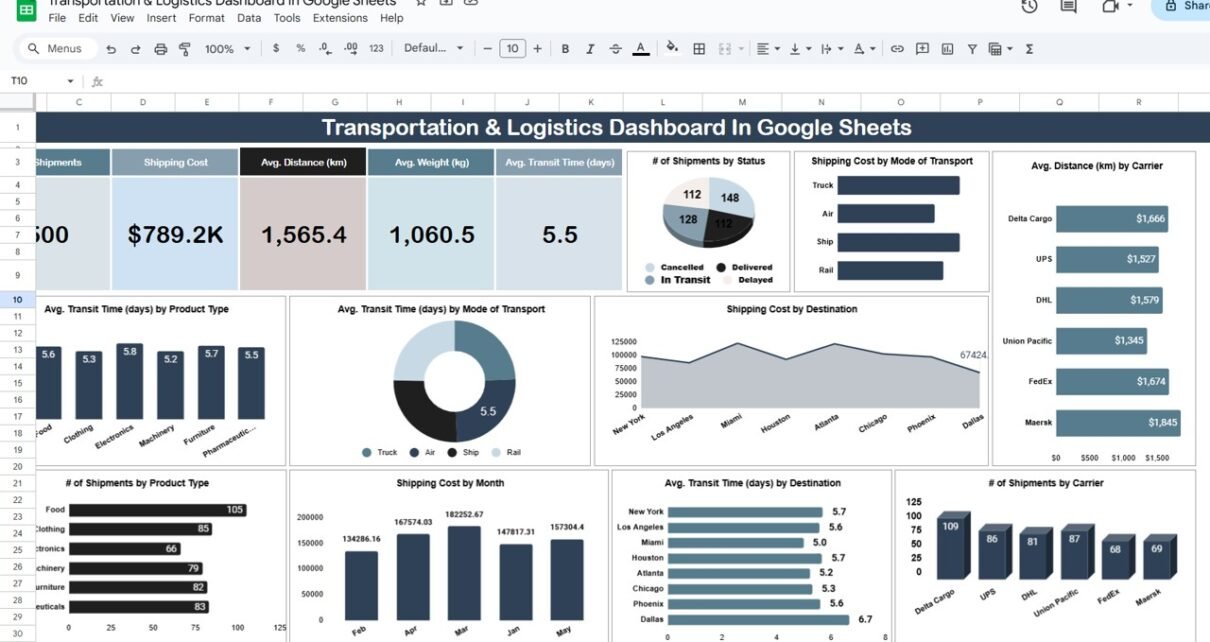
Managing the transportation and logistics of goods effectively is crucial for businesses that rely on timely deliveries and cost management. The Transportation & Logistics Dashboard in Google Sheets is a ready-to-use tool designed to help you track and analyze key logistics and shipping metrics. With real-time data tracking and visual reporting, this dashboard helps logistics […]