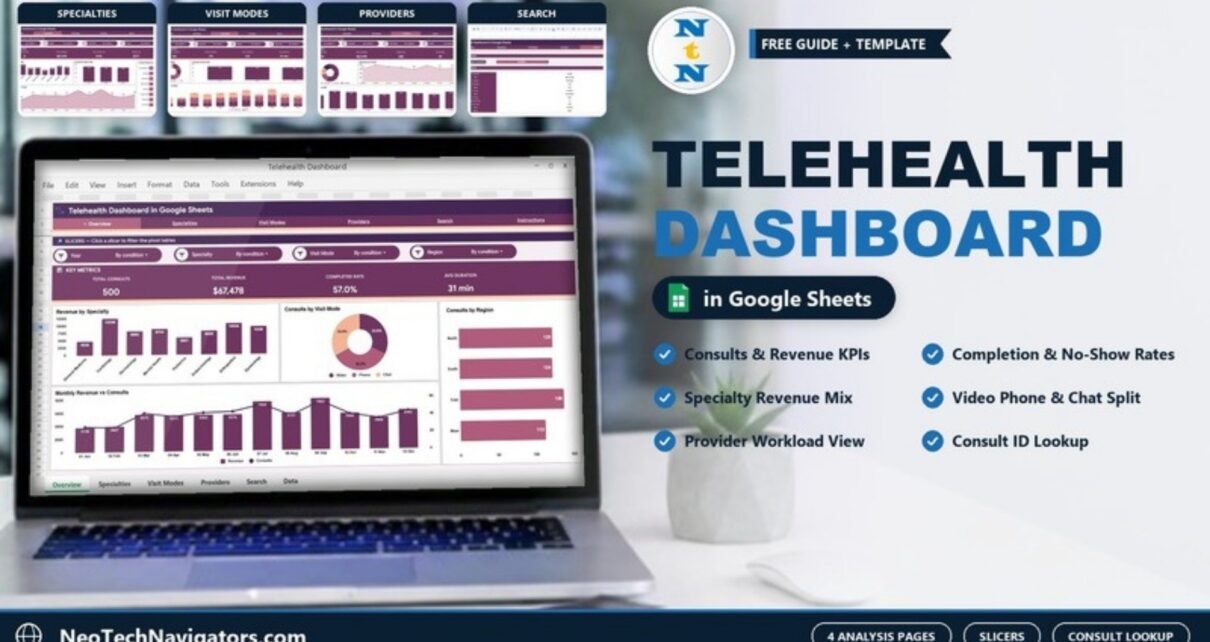
The Telehealth Dashboard in Google Sheets is a reporting template for virtual care teams. It turns a simple consult log into four analysis pages (Overview, Specialties, Visit Modes and Providers), a Consult ID lookup page and a data sheet. Pivot tables and slicers do the work, so you can filter by year, specialty, visit mode, region, status or age group without writing formulas.
It is built for telehealth practice managers, virtual clinic operations leads, healthcare analysts and consultants who need a clear monthly picture of consult volume, revenue, completion and no-shows. This guide walks through every page using the template’s real screenshots and sample numbers, checks how the figures fit together, and explains how to load your own consult records safely.
Get the Telehealth Dashboard in Google Sheets
What Problem Does It Solve?
Telehealth platforms record every consult, but their built-in reports rarely answer the questions managers actually ask. Which specialty brings in the most revenue? Are patients moving from phone to video? Which providers carry the heaviest load? How many booked consults end as no-shows? Teams often export a CSV and rebuild the same charts every month.
This template gives that export a permanent home. Paste the consult log into the data sheet, and the pivot-based pages update. Because it is a Google Sheet, managers, analysts and clinical leads can all open the same file.
What Is Inside: Pages, Metric Cards and Slicers
A navigation bar at the top links Overview, Specialties, Visit Modes, Providers, Search and Instructions. The consult records sit on a separate data sheet. Each analysis page has its own row of metric cards and four slicers (“Click a slicer to filter the pivot tables”).
| Page | Metric cards (sample values) | Slicers |
|---|---|---|
| Overview | Total Consults 500 · Total Revenue $67,478 · Completed Rate 57.0% · Avg Duration 31 min | Year, Specialty, Visit Mode, Region |
| Specialties | Specialties 8 · Total Revenue $67,478 · Avg Consult Fee $135 · Highest Fee $277 | Year, Region, Visit Mode, Status |
| Visit Modes | Video Consults 160 · Phone Consults 176 · Chat Consults 164 · Avg Duration 31 min | Year, Specialty, Region, Age Group |
| Providers | Providers 10 · Total Revenue $67,478 · Completed 285 · No-Shows 69 | Year, Specialty, Visit Mode, Status |
Telehealth Dashboard in Google Sheets: Page-by-Page Walkthrough
1. Overview
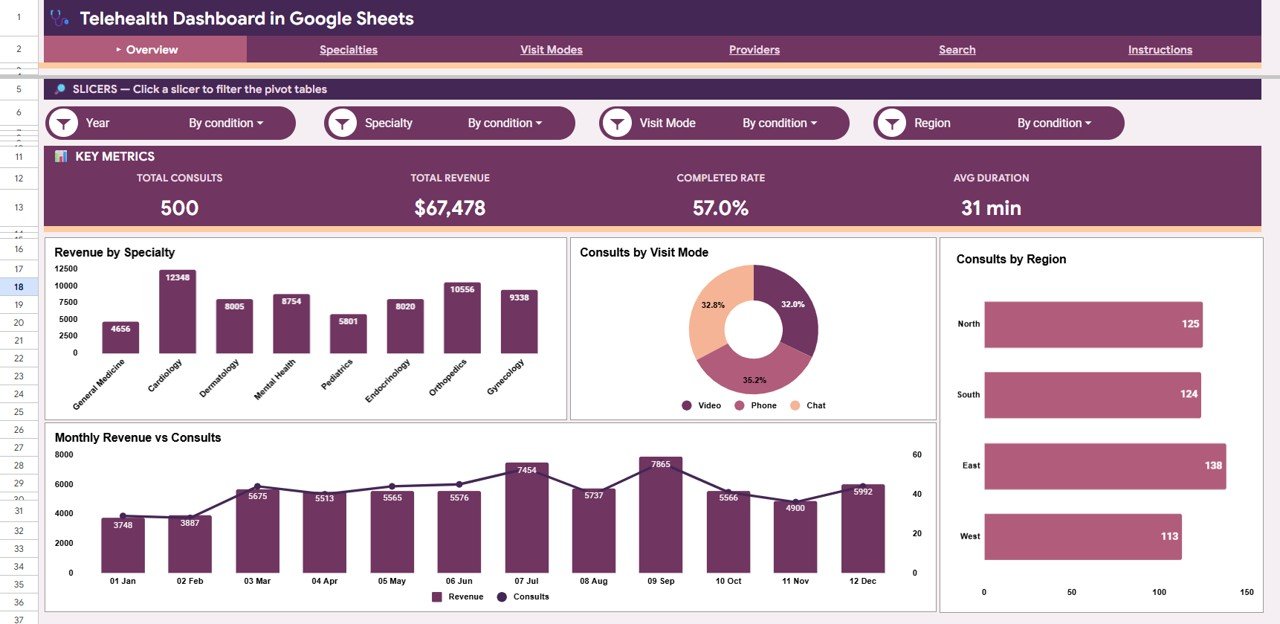
The Overview page is the executive summary. Below the four key metrics you will find:
- Revenue by Specialty: Cardiology leads the sample with 12,348, followed by Orthopedics (10,556) and Gynecology (9,338). General Medicine is lowest at 4,656.
- Consults by Visit Mode: Phone 35.2%, Chat 32.8% and Video 32.0%.
- Consults by Region: East 138, North 125, South 124 and West 113.
- Monthly Revenue vs Consults: revenue columns with a consult-count line. September is the peak month in the sample at 7,865.
2. Specialties
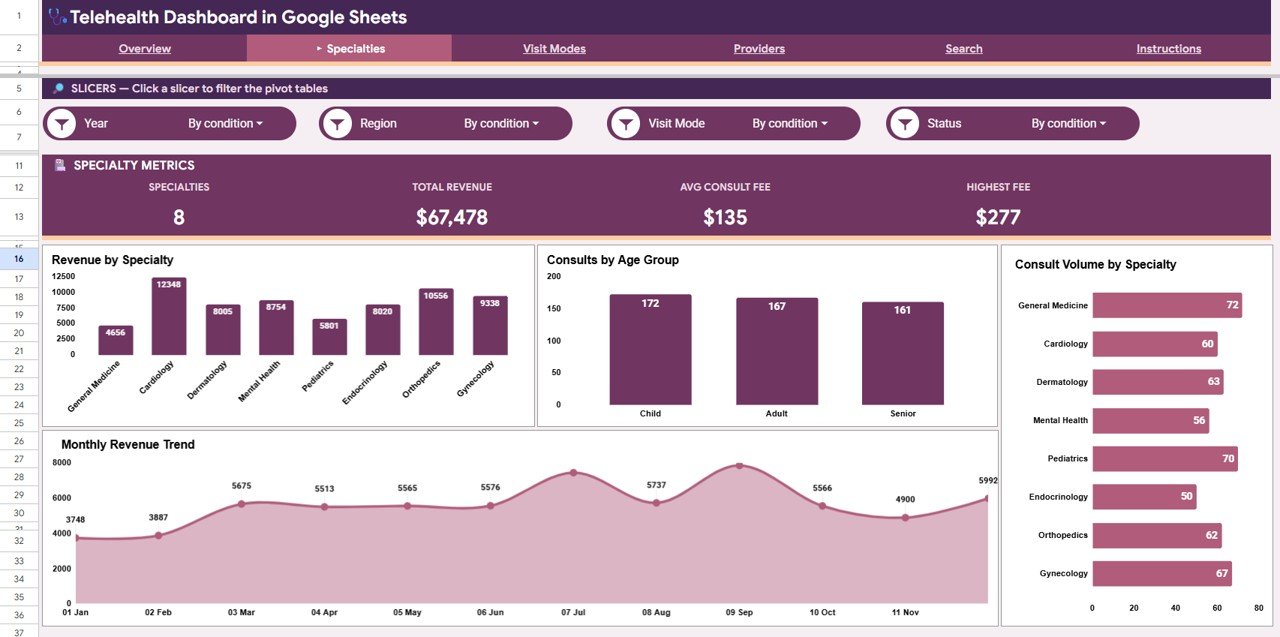
This page focuses on service lines. It repeats Revenue by Specialty and adds Consults by Age Group (Child 172, Adult 167, Senior 161), Consult Volume by Specialty (General Medicine is busiest at 72 consults, Endocrinology quietest at 50) and a Monthly Revenue Trend area chart. The eight specialties are General Medicine, Cardiology, Dermatology, Mental Health, Pediatrics, Endocrinology, Orthopedics and Gynecology.
3. Visit Modes
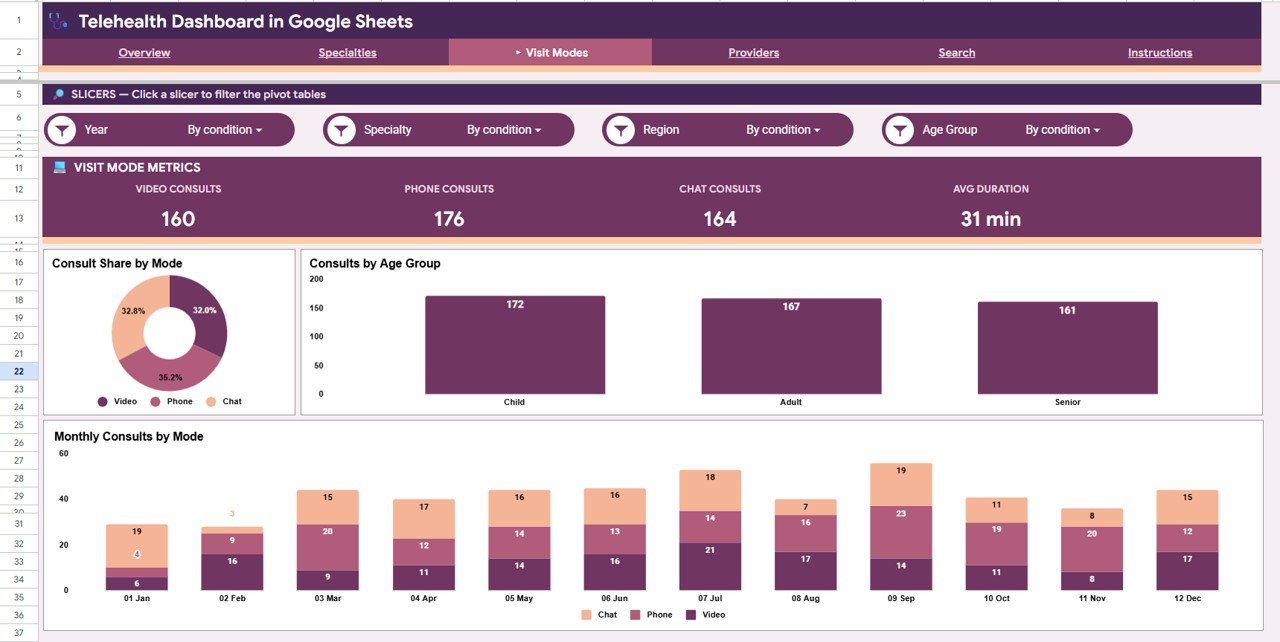
This page shows how patients connect: Consult Share by Mode, Consults by Age Group and a stacked Monthly Consults by Mode chart that splits each month into Chat, Phone and Video. It is the page to check if you are deciding whether to push more patients to video or to staff the chat channel more heavily.
4. Providers
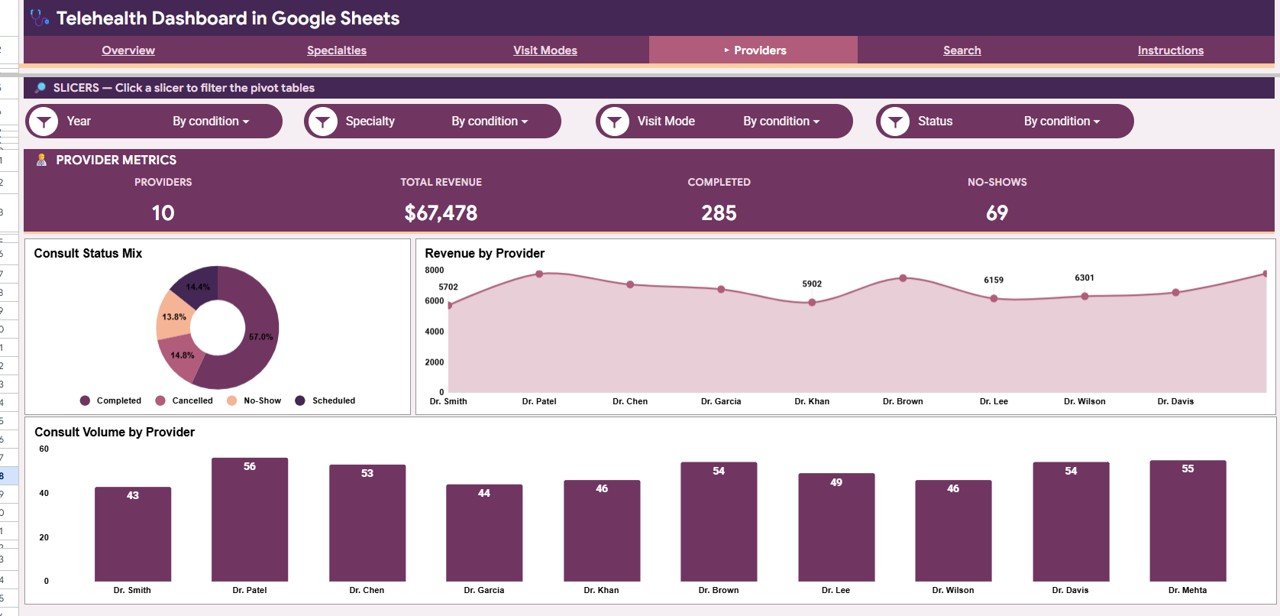
This page supports workload and performance reviews. Consult Status Mix splits consults into Completed (57.0%), Cancelled (14.8%), Scheduled (14.4%) and No-Show (13.8%). Revenue by Provider and Consult Volume by Provider compare the ten sample providers. Dr. Patel has the most consults (56) and Dr. Smith the fewest (43).
5. Search (Consult Lookup)
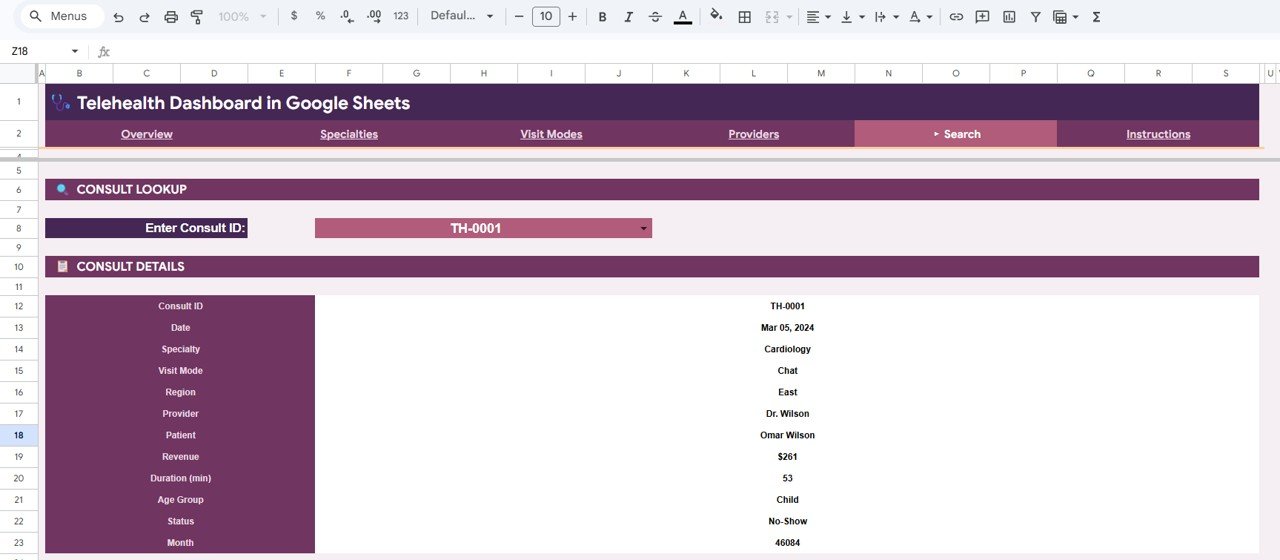
Choose a Consult ID in the Enter Consult ID dropdown and the Consult Details panel fills in Date, Specialty, Visit Mode, Region, Provider, Patient, Revenue, Duration (min), Age Group, Status and Month. In the screenshot, TH-0001 is a Cardiology chat consult in the East region with Dr. Wilson, dated Mar 05, 2024, with revenue of $261, a duration of 53 minutes and a status of No-Show.
6. Data Sheet
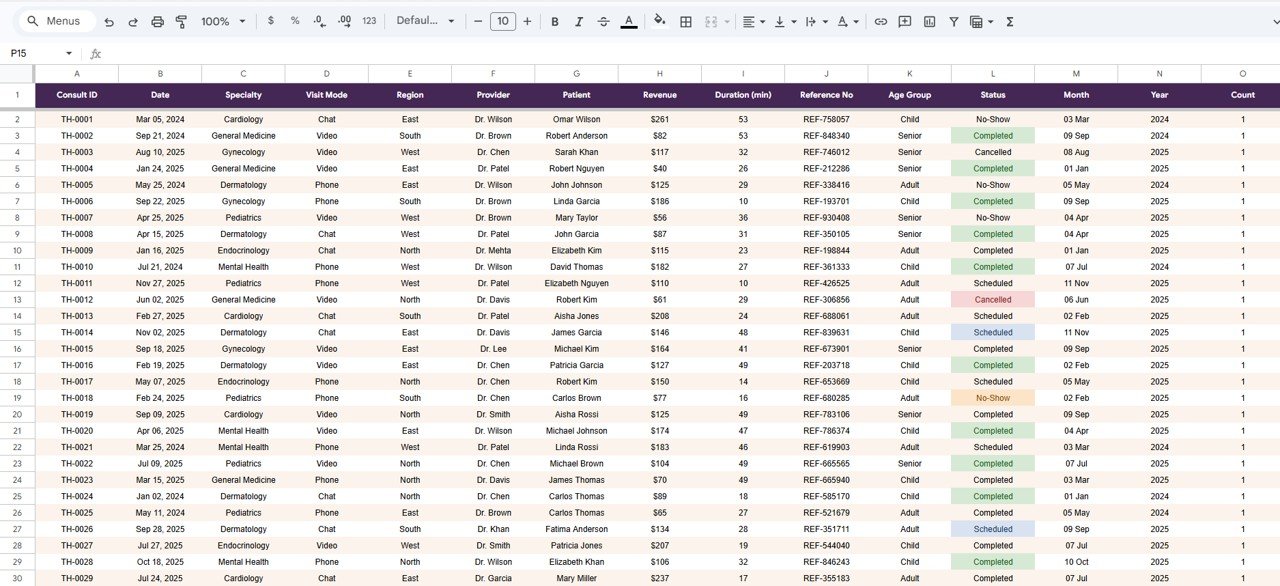
The data sheet is the input layer. Its columns are Consult ID, Date, Specialty, Visit Mode, Region, Provider, Patient, Revenue, Duration (min), Reference No, Age Group, Status, Month, Year and Count. Status values in the sample are Completed, Cancelled, Scheduled and No-Show, and the records run across 2024 and 2025.
Worked Example: Checking the Numbers
The cards and charts agree with each other, and these are the quick checks to repeat after loading your own data:
Avg Consult Fee  = Total Revenue / Total Consults = 67,478 / 500 = $134.96 ≈ $135
Completed Rate   = Completed / Total Consults     = 285 / 500    = 57.0%
No-show rate     = No-Shows / Total Consults      = 69 / 500     = 13.8%
Cardiology fee   = 12,348 / 60 consults           ≈ $206 per consult
General Medicine = 4,656 / 72 consults            ≈ $65 per consult
The last two lines show why the Specialties page matters. General Medicine has the most consults but the lowest revenue, while Cardiology earns roughly three times as much per consult. That is a staffing and pricing conversation the summary cards alone would not start.
If you want your own helper cells outside the pivots, standard formulas work on the data sheet. These examples assume Status is in column L and Revenue in column H, so adjust the sheet name and letters to match your copy:
=COUNTIF(Data!L2:L, "Completed") / COUNTA(Data!A2:A)
=SUMIF(Data!C2:C, "Cardiology", Data!H2:H)
How to Use It With Your Own Data
- Make your own copy (File > Make a copy) and read the Instructions page.
- Export consults from your telehealth platform and arrange the columns in the same order as the data sheet.
- Standardise values: one spelling for each specialty, provider, region, visit mode and status.
- Paste your rows over the sample data, keeping the header row.
- If your data runs past the original range, check each pivot table’s range (click the pivot > Pivot table editor > edit the data range).
- Use the slicers to review by year, specialty, mode, region, status or age group, and the Search page for single-consult questions.
The pages are built on pivot tables and slicers. If you want to learn to build that kind of report yourself, the Excel Pivot Tables & Dashboards course on NextGenTemplates Academy teaches the same approach step by step.
Google Sheets Template vs Excel vs a Healthcare SaaS Platform
| Point | Telehealth Dashboard in Google Sheets | Excel dashboard | Healthcare analytics SaaS |
|---|---|---|---|
| Setup | Copy the file and paste your data | Open the workbook and paste your data | Vendor onboarding and integration |
| Collaboration | Built-in Google Drive sharing | Through OneDrive or SharePoint | Role-based accounts |
| Customisation | Fully editable pivots and charts | Fully editable | Limited to the vendor’s options |
| Live data connection | No, manual paste | No, unless you build one | Usually yes |
| Ongoing cost | One-time template purchase | One-time template plus Excel license | Recurring subscription |
Related templates: Teams on Power BI can use the Telehealth Dashboard in Power BI.
Real-World Use Cases
- Virtual clinic operations manager: Reviews Completed Rate and No-Shows every Monday on the Providers page and adds reminder calls for the providers with the highest no-show share.
- Healthcare finance analyst: Uses Revenue by Specialty and the Avg Consult Fee card to explain month-end revenue and flag low-yield service lines.
- Patient support lead: Uses the Search page to answer a billing or scheduling question in seconds from a Consult ID.
For target-based monthly tracking, see the Telehealth KPI Dashboard in Google Sheets and the Telehealth KPI Scorecard in Google Sheets. In-person practices may prefer the Medical Practice Dashboard in Google Sheets or the Clinics Dashboard in Google Sheets.
Best Practices
- Keep the column order and headers fixed. The pivot tables depend on them.
- Minimise patient data. If names are not needed for reporting, replace them with an ID before pasting. Follow your organisation’s privacy rules and Google Workspace settings.
- Start at Overview, then explain. Use Specialties, Visit Modes and Providers to explain why a top-line number moved.
- Treat Scheduled consults separately. They are future bookings, so read Completed Rate with that in mind when you review the current month.
- Share view-only by default. Give edit access only to the person who loads the data. See Google’s guide to sharing files from Google Drive.
Limitations: Who Should Not Use It
- It is not an EHR, scheduling system or claims tool, and it has no live integration with telehealth platforms.
- The template by itself does not make you HIPAA compliant. Compliance depends on how your organisation configures Google Workspace, access and storage.
- Large networks needing row-level security, automated refresh or many sites in one model should look at a BI platform. A browser-based healthcare analytics dashboard or Power BI may fit better.
Frequently Asked Questions
What does the Telehealth Dashboard in Google Sheets include?
Overview, Specialties, Visit Modes, Providers, Search and Instructions pages plus a data sheet, with metric cards, pivot-table charts, slicers and a Consult ID lookup.
Which metrics are on the Overview page?
Total Consults, Total Revenue, Completed Rate and Avg Duration, with charts for Revenue by Specialty, Consults by Visit Mode, Consults by Region and Monthly Revenue vs Consults.
Which slicers can I use?
Each page has four. Across the pages they cover Year, Specialty, Visit Mode, Region, Status and Age Group.
Can I replace the sample data with my own consults?
Yes. Paste your records into the data sheet with the same columns, then check that the pivot table ranges include all your rows.
Does it connect to my telehealth platform or EHR?
No. Export a CSV or Excel file from your platform and paste it into the data sheet.
Is the template HIPAA compliant?
The template does not guarantee compliance by itself. That depends on your Google Workspace configuration, access controls and internal policies, so check with your compliance lead before storing patient-identifiable data.
Wrapping Up
The Telehealth Dashboard in Google Sheets gives virtual care teams one shared file for consult volume, revenue, completion, no-shows, specialty mix, visit modes and provider workload, plus a quick lookup for individual consults. Load your consult log, run the quick checks above, and use the Specialties and Providers pages to turn the headline numbers into decisions.
Get the Telehealth Dashboard in Google Sheets
📅 Last updated: October 2026