The Photography Business Dashboard in Google Sheets is built for studios and freelance photographers that need a clear way to track bookings, revenue, expenses, packages, photographers, locations, ratings, and session status. A photography business completing only 25 sessions per month creates more than 300 booking records in a year. Without a dashboard, that data usually stays buried in rows, invoices, client messages, and payment notes.
This template turns that booking data into a 6-tab Google Sheets dashboard with 8 high-level KPI cards, 16 chart views, slicer-based filtering, a Booking ID search tab, and a structured data sheet. It helps you see which session types bring revenue, which packages sell most often, which photographers are driving bookings, which locations perform best, and whether client ratings are moving in the right direction.
Click here to purchase the Photography Business Dashboard in Google Sheets.
Click here to purchase the Photography Business Dashboard in Google Sheets.
Key Features of Photography Business Dashboard in Google Sheets
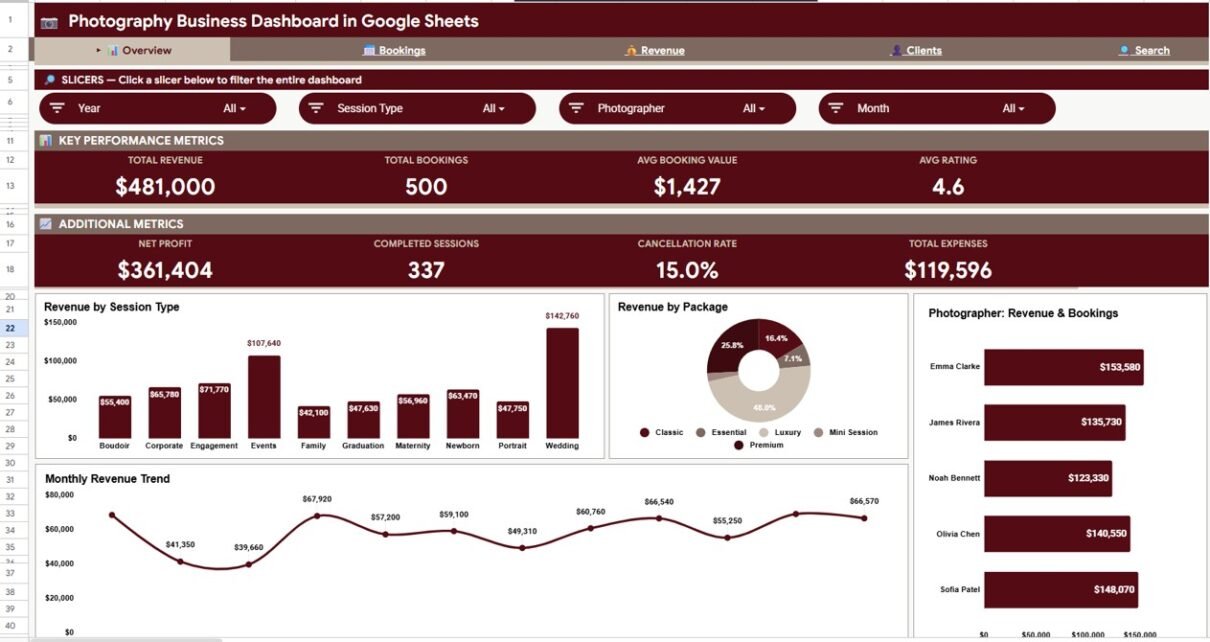
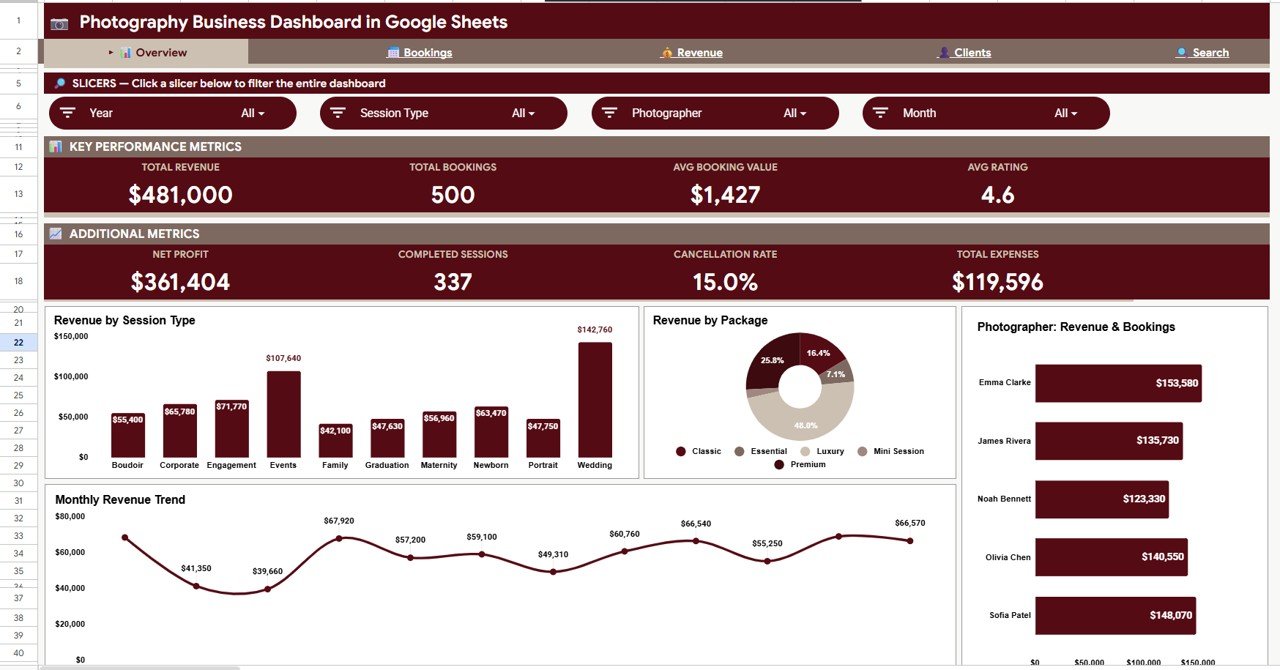
8 overview cards: Total Revenue, Total Bookings, Avg Booking Value, Avg Rating, Net Profit, Completed Sessions, Cancellation Rate, and Total Expenses are shown at the top of the Overview page. These numbers give business owners a quick health check before they review deeper analysis.
Multiple analysis tabs: The dashboard includes Overview, Bookings, Revenue, Clients, Search, and Data tabs. This separates high-level reporting from lookup work and raw data entry, which makes the file easier to maintain.
16 chart views: The template analyzes session type, package, photographer, month, location, status, expenses, revenue, ratings, and client mix. These views are useful for monthly reviews, campaign planning, pricing decisions, and service quality checks.
Slicer-based filtering: The dashboard uses slicers so users can filter charts quickly. Google explains that slicers can filter charts and pivot tables in Sheets, which makes them a useful dashboard control for recurring analysis. You can read Google’s official guide here: Filter charts and tables with slicers.
Booking ID search: The Search tab lets you enter a Booking ID and return the full record. This is handy when you need to answer a client or check a specific job without scrolling through the Data sheet.
Editable data structure: The Data sheet gives the format you need to follow. Add your own booking records in the same structure, and the reporting pages can use that data for cards, charts, filters, and lookup.
Dashboard Pages Explanation
1. Overview Page
The Overview page is the executive summary of the Photography Business Dashboard in Google Sheets. At the top, it shows Total Revenue, Total Bookings, Avg Booking Value, Avg Rating, Net Profit, Completed Sessions, Cancellation Rate, and Total Expenses.
Revenue by Session Type: This chart shows which session categories generate the most revenue, such as weddings, portraits, events, products, or commercial shoots. It helps you identify the services that deserve more promotion or better pricing.
Revenue by Package: This chart compares sales across packages. It helps you see whether clients are buying entry-level packages, mid-tier packages, premium offers, or custom services.
Revenue and Bookings by Photographer: This chart compares each photographer by both revenue and booking count. It helps studio owners balance workload and understand who is contributing most to sales volume.
Monthly Revenue Trend: This trend chart shows how revenue changes month by month. It helps you spot seasonality, campaign impact, booking slumps, and peak months.
Click here to purchase the Photography Business Dashboard in Google Sheets.
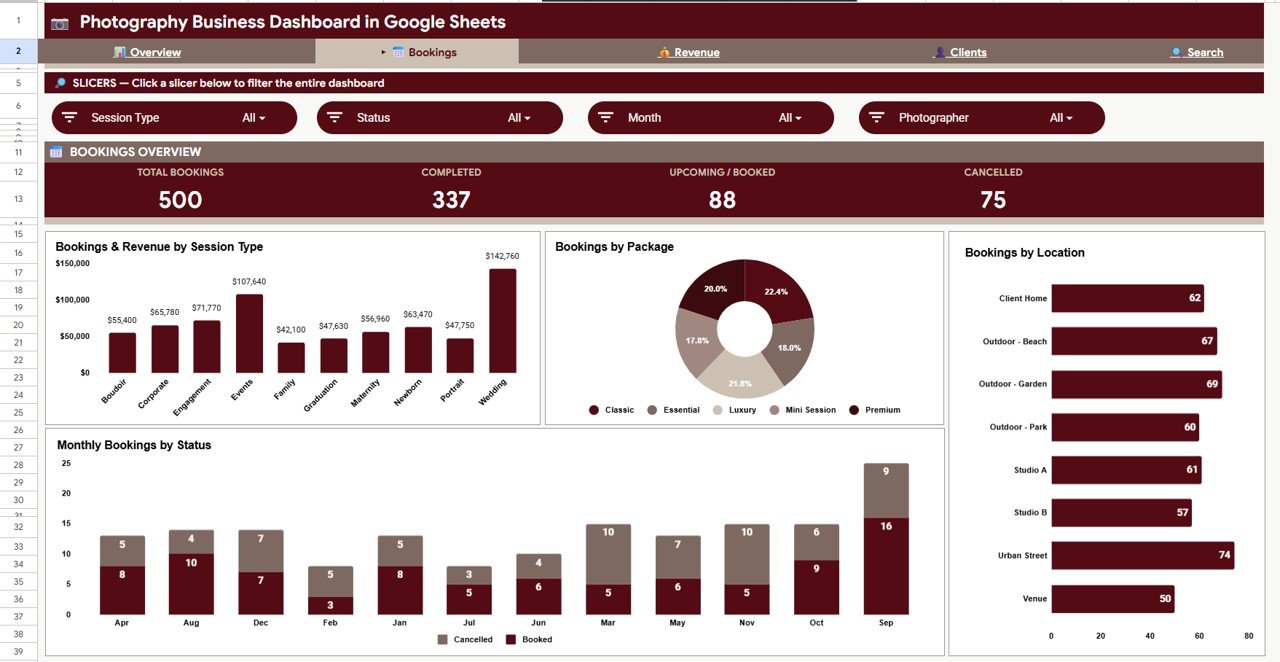
2. Bookings Sheet Tab
The Bookings tab focuses on demand, booking flow, package popularity, location spread, and booking status. It is useful for weekly or monthly operations reviews.
Bookings and Revenue by Session Type: This chart connects demand and revenue in one view. A service may receive many bookings but produce lower revenue, while another may have fewer bookings but a higher value.
Bookings by Package: This chart shows which packages are selected most often. If one package dominates bookings, you can decide whether to build an upsell path around it or adjust underperforming packages.
Bookings by Location: This view breaks down bookings by location. It helps photographers identify stronger local markets, travel-heavy areas, and places where ads or partnerships may work better.
Monthly Bookings by Status: This chart shows how completed, cancelled, pending, or other statuses change over time. If cancelled sessions rise in a specific month, you can investigate scheduling, payment, or client communication issues.
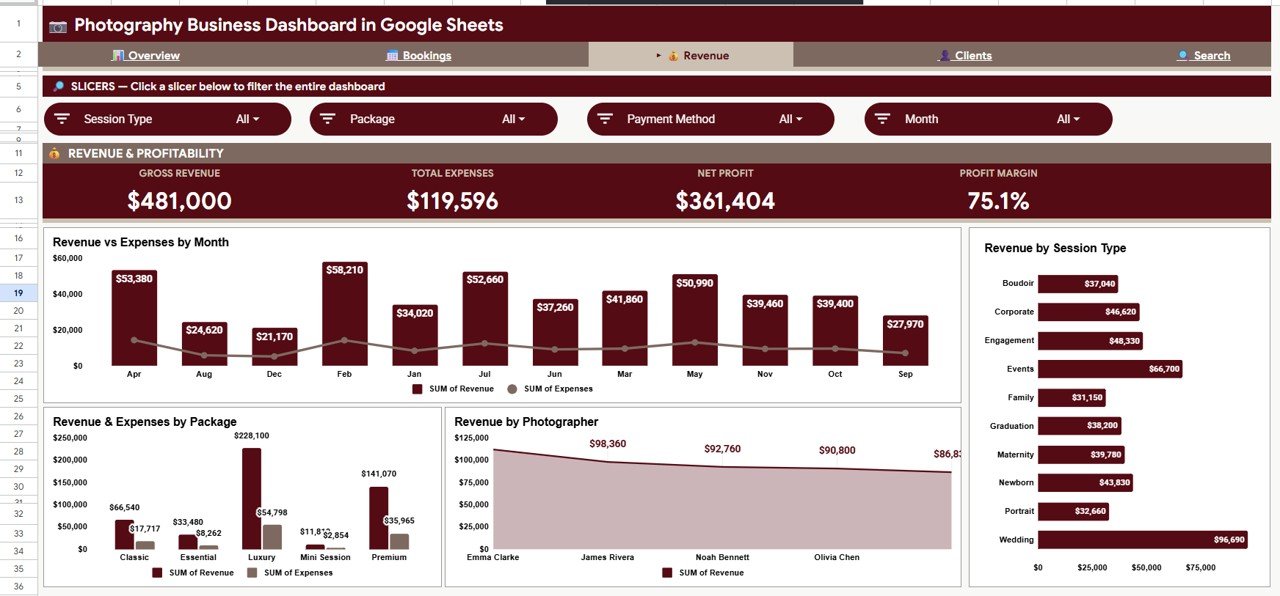
3. Revenue Sheet Tab
The Revenue tab is built for financial review. It shows how revenue compares with expenses and where income is coming from.
Revenue vs Expenses by Month: This chart compares monthly income and monthly cost. It helps you see whether a high-revenue month is also a high-profit month.
Revenue and Expenses by Package: This chart compares package-level sales with package-level expenses. It can point to packages that look popular but have weaker margins.
Revenue by Photographer: This chart shows photographer-level revenue contribution. It is useful for performance reviews, workload planning, and incentive discussions.
Revenue by Session Type: This chart shows which service categories generate the most money. It helps guide service positioning, marketing content, and pricing updates.
Click here to purchase the Photography Business Dashboard in Google Sheets.
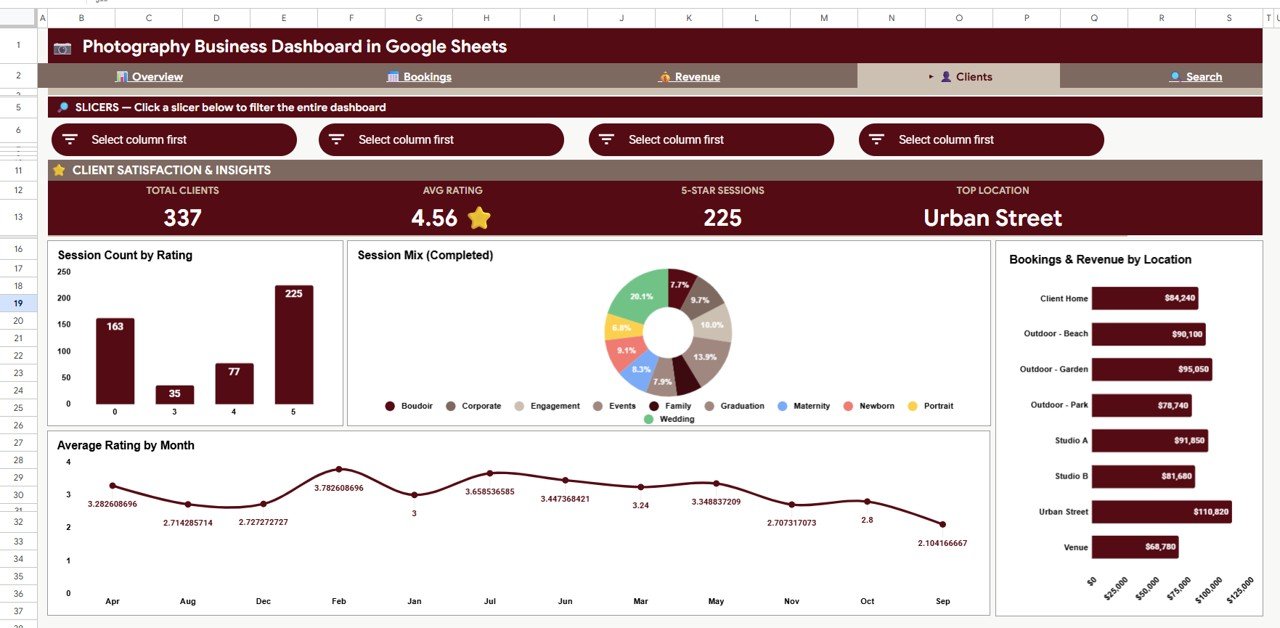
4. Clients Sheet Tab
The Clients tab focuses on client experience, session mix, location contribution, and rating trend. It is useful when you want to understand not only how much you sold, but how clients responded.
Session Count by Rating: This chart shows how many sessions fall into each rating level. It helps you see whether clients are mostly satisfied or whether there are quality issues to fix.
Session Mix by Session Type: This chart shows the spread of work across session categories. A balanced mix may reduce risk, while a narrow mix may show a specialization opportunity.
Bookings and Revenue by Location: This chart links location demand with revenue. It helps you decide where to focus local partnerships, event outreach, or paid ads.
Average Rating by Month: This chart tracks rating changes over time. If ratings decline during busy periods, the team may need better scheduling, communication, or delivery controls.
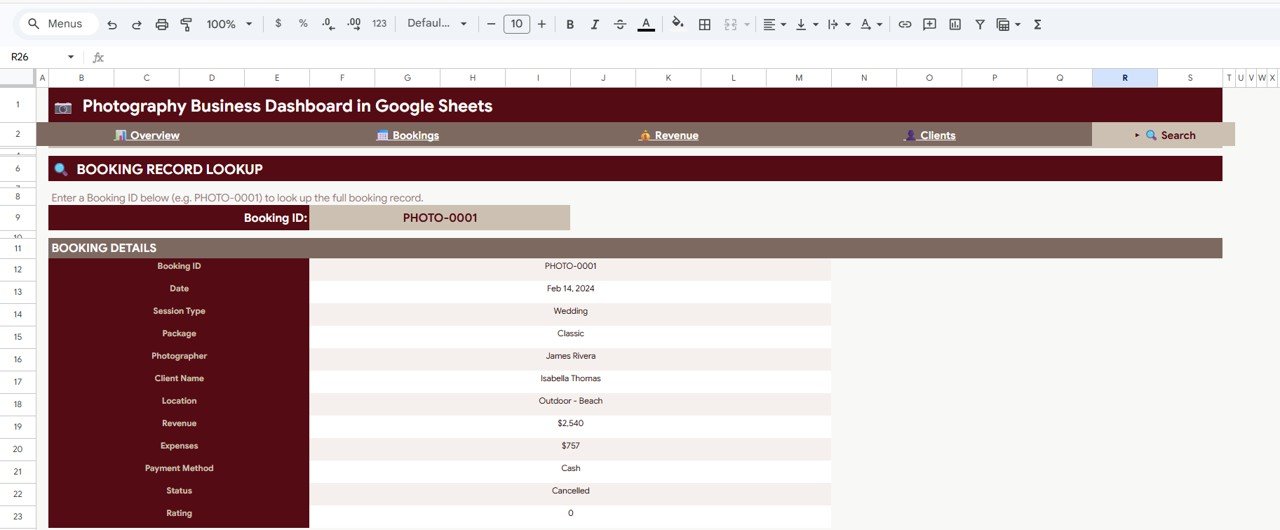
5. Search Sheet Tab
The Search tab lets you enter a Booking ID to look up one full booking record. It returns Booking ID, Date, Session Type, Package, Photographer, Client Name, Location, Revenue, Expenses, Payment Method, Status, and Rating.
This makes daily support work much faster. Instead of filtering the Data sheet manually, you can type the booking ID and review the important details in one place.
Click here to purchase the Photography Business Dashboard in Google Sheets.
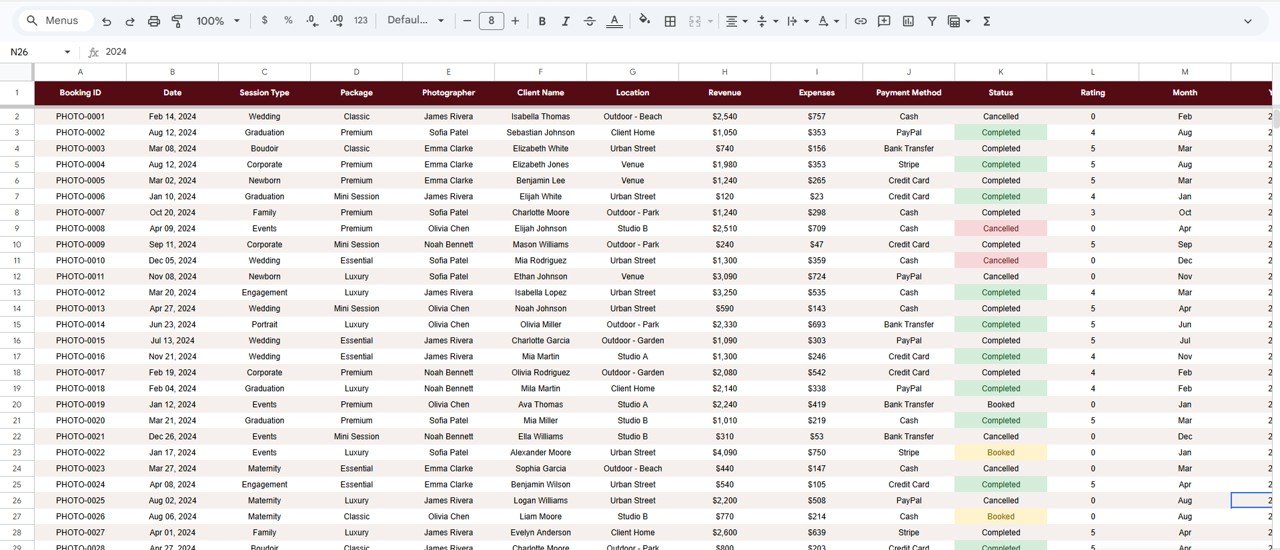
6. Data Sheet Tab
The Data sheet is the input area. Add your own records in the same format so the dashboard can read them cleanly. Keep column names and data types consistent, especially for date, session type, package, photographer, location, revenue, expenses, status, and rating.
Photography Business Dashboard in Google Sheets vs. Microsoft Excel Dashboard vs. Paid CRM/SaaS – Feature Comparison
| Feature | Photography Business Dashboard in Google Sheets | Microsoft Excel Dashboard | Paid CRM/SaaS |
|---|---|---|---|
| Cost | $9.99 one-time sale price | One-time template cost or Microsoft subscription | Monthly subscription |
| Platform | Google Sheets | Microsoft Excel | Vendor-hosted cloud app |
| Setup time | Copy the sheet and replace sample data | Open workbook and refresh pivots | Usually onboarding plus settings |
| Real-time team collaboration | Native Google Sheets sharing | Best with OneDrive or SharePoint | Usually included |
| Mobile access | Google Sheets mobile app | Excel mobile app with limits | Usually included |
| Customizable fields | Editable sheet structure | Editable workbook structure | Limited by vendor plan |
| Share with link | Yes, through Google Drive | Yes, through Microsoft sharing | Depends on vendor |
| Year-1 cost at 5 users | $9.99 plus existing Google account | Template cost plus Microsoft licensing if needed | Can reach hundreds of dollars per year |
| Booking ID lookup | Included Search tab | Depends on workbook setup | Usually included |
| Photography-specific charts | Included | Depends on template | Often generic or limited reporting |
Who Should Use This Template
This dashboard is a good fit for freelance photographers, wedding studios, portrait studios, commercial photography teams, event photographers, small creative agencies, and photography business owners who already use spreadsheets to track bookings.
It is also useful for teams that collaborate in Google Drive. Since the dashboard is built in Google Sheets, multiple people can view or edit the file based on the permissions you set.
Real-World Use Cases
Wedding Studio Monthly Review
A wedding studio owner reviews Total Revenue, Bookings by Package, and Monthly Revenue Trend at the end of each month. The data helps decide which package should be featured on the website and which package needs a price adjustment.
Portrait Studio Service Quality Check
A portrait studio manager uses Session Count by Rating and Average Rating by Month to monitor client satisfaction. If ratings drop in a peak month, the team can review scheduling, proof delivery time, and communication.
Multi-Photographer Team Planning
A studio with several photographers uses Revenue and Bookings by Photographer to balance workload. If one photographer has high bookings and another has unused capacity, assignments can be adjusted before burnout begins.
Advantages of Photography Business Dashboard in Google Sheets
Click here to purchase the Photography Business Dashboard in Google Sheets.
- Low-cost reporting: You get a structured dashboard without a monthly subscription.
- Easy collaboration: Google Drive sharing makes it easier to involve partners, assistants, editors, or managers.
- Fast lookup: The Search tab helps you find a booking record quickly.
- Better pricing decisions: Revenue by Package and Revenue by Session Type help you understand offer performance.
- Better client experience review: Rating charts help you monitor satisfaction over time.
- Data ownership: Your business data stays in your Google Sheet under your account.
Opportunities for Improvement
- It is not a full CRM, so it does not handle contracts, invoices, proposals, gallery delivery, or automated client email flows.
- Large studios may want to connect the Data sheet to forms, booking tools, or automation later.
- The dashboard depends on clean data entry, so inconsistent package names, dates, or statuses can affect reporting accuracy.
- The final digital file URL should be attached to the WooCommerce product before publication.
Best Practices
- Keep package names consistent so chart categories stay clean.
- Update the Data sheet weekly or after each completed session.
- Use a unique Booking ID for every session so the Search tab works reliably.
- Review cancellation rate every month and compare it with booking source or package changes.
- Use slicers during review meetings instead of duplicating tabs for every photographer or location.
- Keep a monthly backup copy before making major structural edits.
Explore Relevant Templates
- Photography Business Dashboard in Google Sheets
- Photography Business Dashboard in Excel
- Photography Business Dashboard in Power BI
- Photography Business KPI Dashboard in Google Sheets
- Browse all Google Sheets Dashboard Templates
Frequently Asked Questions
Click here to purchase the Photography Business Dashboard in Google Sheets.
What does the Photography Business Dashboard in Google Sheets track?
It tracks revenue, bookings, average booking value, ratings, net profit, completed sessions, cancellation rate, expenses, packages, photographers, locations, statuses, and client-related trends.
Does it include a search feature?
Yes. The Search tab lets you enter a Booking ID and returns the full record, including date, session type, package, photographer, client name, location, revenue, expenses, payment method, status, and rating.
Can I use it with my own photographers and packages?
Yes. Replace the sample rows in the Data sheet with your own photographer names, session types, packages, locations, and booking details.
Is this dashboard better than a photography CRM?
It serves a different purpose. A CRM manages workflows such as leads, contracts, invoices, and client communication. This dashboard focuses on reporting and analytics.
Can my team collaborate in this file?
Yes. Since it runs in Google Sheets, you can share the file through Google Drive and control who can view or edit it.
What should I do before using the dashboard for real reporting?
Clean your data, keep date formats consistent, use one Booking ID per session, and avoid changing the structure until you understand how the dashboard reads the Data sheet.
About the Author
Built by PK – Microsoft Certified Professional with 15+ years of Excel, Google Sheets, and Power BI experience. Founder of NextGenTemplates, reaching 300K+ subscribers across YouTube channels. Every template is hand-built and tested before release.
Conclusion
The Photography Business Dashboard in Google Sheets is a practical reporting template for photographers who want clearer visibility into revenue, bookings, packages, locations, photographer output, client ratings, and search-level booking details. It is not meant to replace every CRM feature, but it does give photography businesses a cleaner way to understand what is happening in their numbers.
Click here to purchase the Photography Business Dashboard in Google Sheets.
Visit YouTube.com/@NeoTechNavigators for related Google Sheets and dashboard tutorials.
Last updated: May 2026