Agriculture Farm Dashboard in Google Sheets is a comprehensive, interactive analytical tool designed for farmers, agronomists, and agricultural business managers who want to track farm revenue, crop yield, operating costs, profit margins, and livestock performance in one centralized Google Sheets dashboard. Managing a modern farm involves monitoring dozens of metrics across crops, livestock, seasons, and zones. Instead of juggling scattered spreadsheets, this Google Sheets dashboard template brings all your critical agricultural data together in beautifully designed interactive pages that update dynamically with your data.
This dashboard includes 6 interactive sheet tabs that cover everything from high-level KPIs to detailed crop analysis, livestock monitoring, financial trends, and individual record search. It tracks 5 critical KPIs including Total Revenue, Total Cost, Total Profit, Total Yield (Tons), and Total Area (Acres). Whether you manage a small family farm or a large-scale commercial agriculture operation, this template helps you make data-driven farming decisions quickly and confidently.
Key Features of Agriculture Farm Dashboard in Google Sheets
The Agriculture Farm Dashboard in Google Sheets stands out because it combines crop analytics, livestock tracking, and financial monitoring in a single template. Here are the features that make it a valuable tool for any farming operation:
- 6 Interactive Dashboard Pages — Overview, Crop Analysis, Livestock, Financial, Search Page, and Data Sheet provide a complete 360-degree view of farming operations.
- 5 High-Level KPI Cards — Monitor Total Revenue, Total Cost, Total Profit, Total Yield (Tons), and Total Area (Acres) instantly from the Overview page.
- Livestock Performance Tracking — A dedicated Livestock page tracks animal count, output, distribution by zone, and monthly output trends.
- Financial Deep Dive — Monthly revenue, cost, and profit trends alongside zone-wise profit distribution and crop-level cost analysis.
- Crop-Level Analysis — Revenue and area by crop, season-wise profitability comparisons, and area vs yield correlation charts.
- Search Page — Dropdown-based record lookup for instant access to any individual farm record’s complete details.
- Dynamic Slicers and Filters — Filter by Crop Type, Farm Zone, Season, Livestock Type, and more across every page.
- Built in Google Sheets — No software installation needed. Copy to your Google Drive and start using immediately.
Dashboard Pages Explained
1. Overview Page
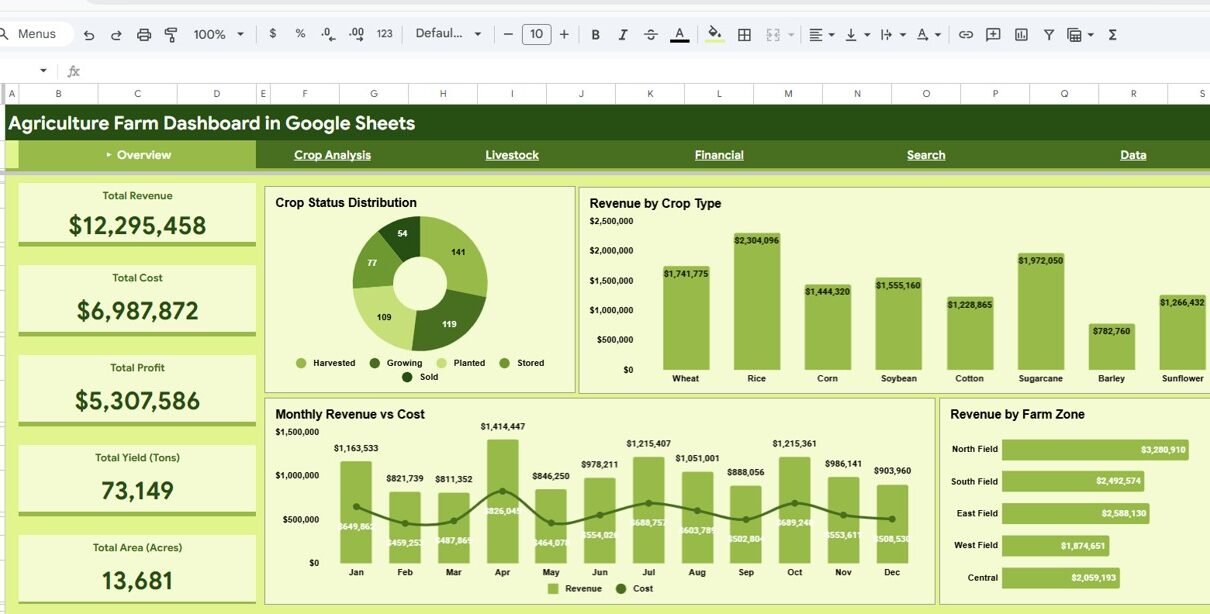
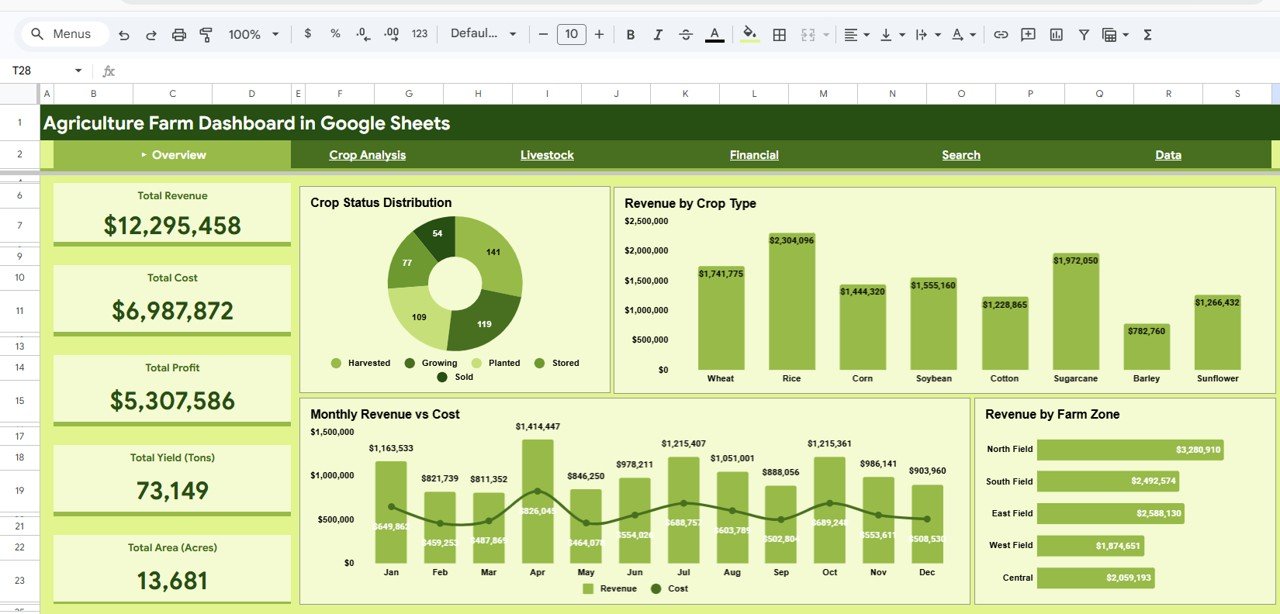
The Overview page is your central command center. At the top, you see 5 KPI cards displaying Total Revenue, Total Cost, Total Profit, Total Yield (Tons), and Total Area (Acres). These cards give you an instant snapshot of your farm’s overall performance. Below the KPI cards, you will find multiple interactive slicers that let you filter the entire dashboard by different dimensions.
The Overview page also includes the following charts that help you understand high-level trends:
- Crop Status Distribution by Status — Shows the breakdown of crops by their current status, helping you understand which crops are active, harvested, or planned.
- Revenue by Crop Type — Compares revenue generated across different crop types so you can identify your top-performing crops.
- Monthly Revenue vs Cost by Month — Displays a month-over-month comparison of revenue and cost, making seasonal patterns immediately visible.
- Revenue by Farm Zone — Shows how revenue is distributed across different farm zones for geographic performance analysis.
Overview Page2. Crop Analysis
The Crop Analysis page provides a deep dive into crop-level performance. This page helps you identify which crops generate the most revenue, which seasons are most profitable, and how yield correlates with cultivated area. The charts on this page include:
- Revenue and Area by Crop — Shows revenue and cultivated area side by side for each crop, making it easy to spot efficiency differences.
- Season-wise Revenue vs Cost vs Profit by Season — Compares revenue, cost, and profit across different growing seasons like Kharif, Rabi, and Summer.
- Revenue by Crop Category — Groups crops by category and shows total revenue for each group.
- Area vs Yield Correlation — Visualizes the relationship between area cultivated and total yield, helping optimize land usage.
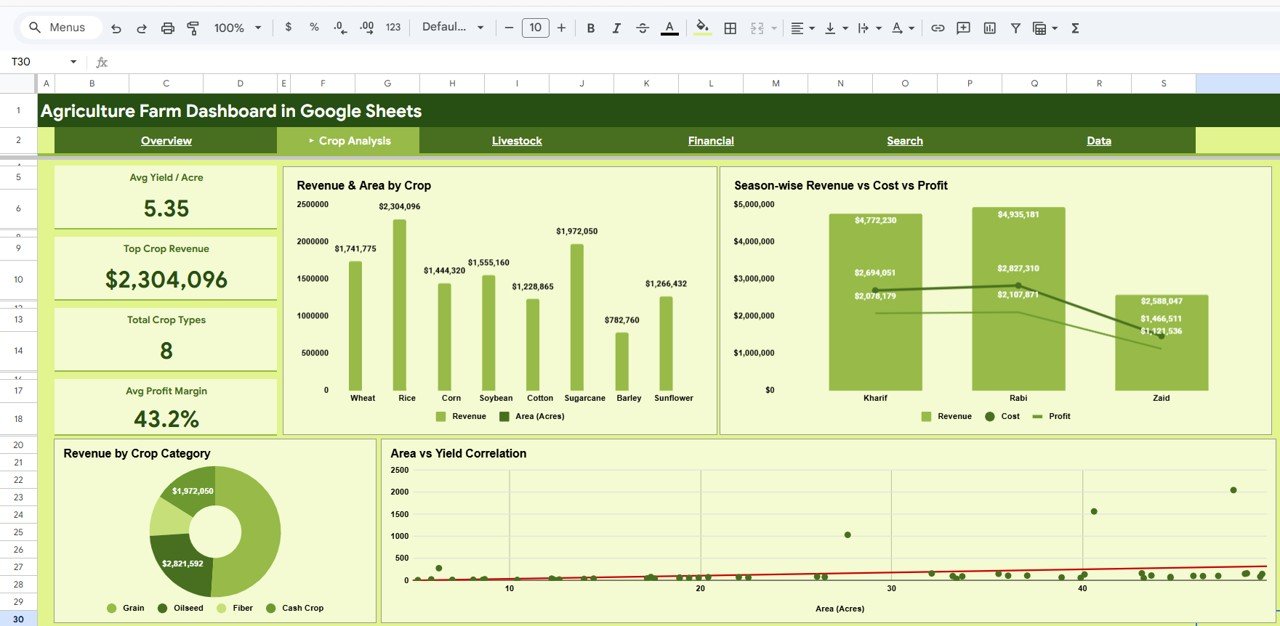 Crop Analysis
3. Livestock
The Livestock page is what makes this dashboard unique compared to most agriculture templates. It provides dedicated charts and metrics for tracking your animal farming operations alongside your crop data. The charts include:
- Livestock Count and Output by Type — Compares headcount and production output across livestock categories like cattle, poultry, goats, and sheep.
- Livestock Distribution by Zone — Shows how your livestock is distributed across different farm zones.
- Livestock Count by Type — A focused view on the total number of animals by type.
- Monthly Livestock Output Trend by Month — Tracks how livestock output changes month over month, helping identify seasonal patterns in animal production.
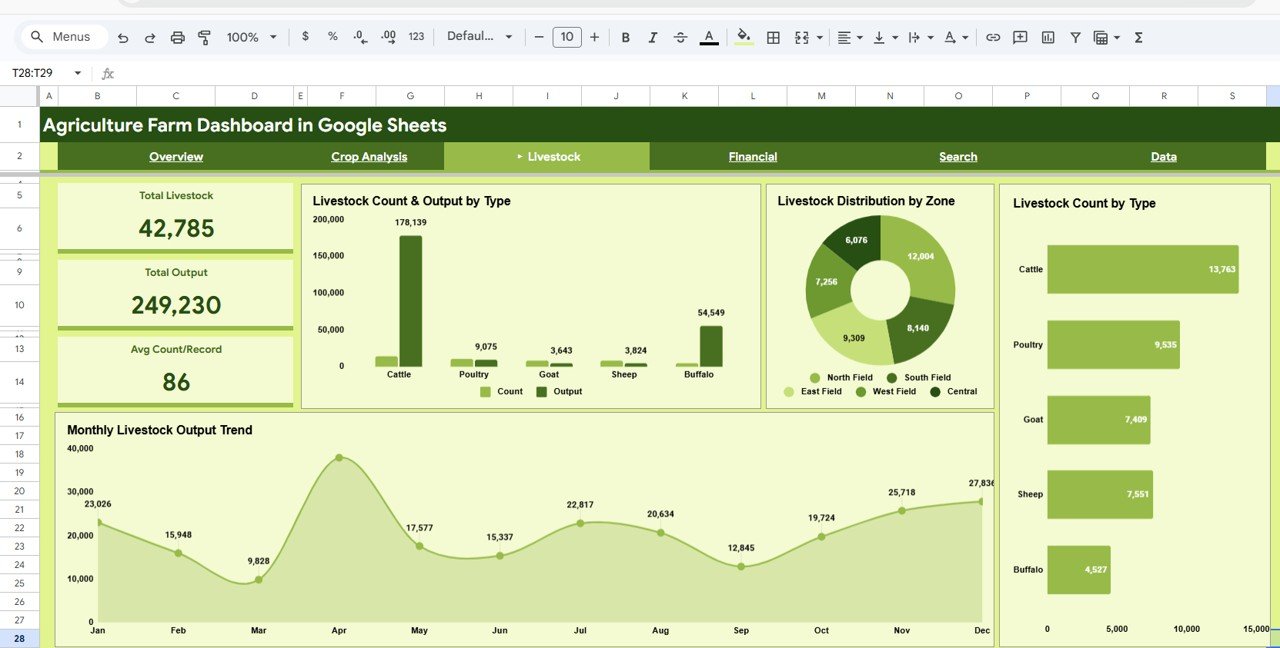 Livestock
4. Financial
The Financial page gives you a comprehensive view of your farm’s financial health. This page is essential for budgeting, cost control, and profitability analysis. It includes:
- Monthly Revenue, Cost and Profit Trend by Month — A time-series chart showing how all three financial metrics change over the year.
- Profit Distribution by Zone — Highlights which farm zones contribute most to overall profit.
- Revenue vs Cost by Crop — Side-by-side comparison of what each crop earns versus what it costs to produce.
- Monthly Revenue Breakdown by Month — Detailed monthly revenue breakdown for forecasting and planning.
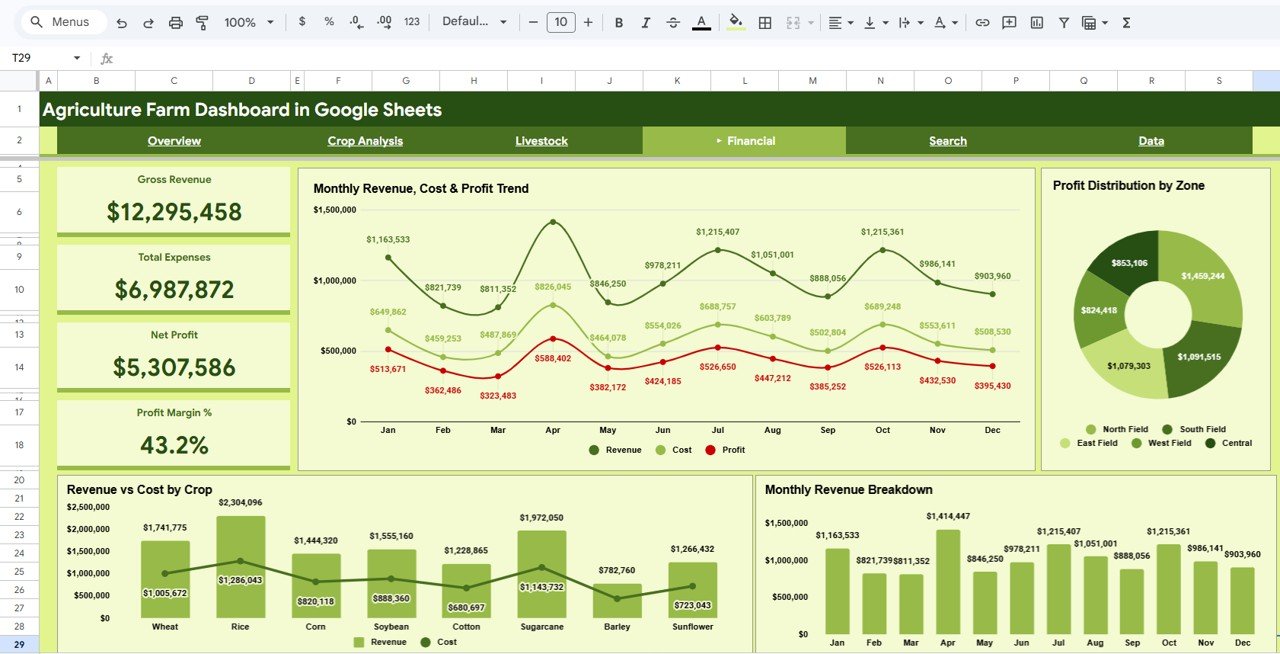 Financial
5. Search Page
The Search Page provides a convenient lookup feature. Select a Record ID from a dropdown, and the page instantly displays all details for that specific farm record including Farm Zone, Crop Type, Category, Area, Yield, Revenue, Cost, Profit, Season, Livestock Type, and Livestock Count. This is perfect for quick lookups during meetings or when you need to verify specific farm entries.
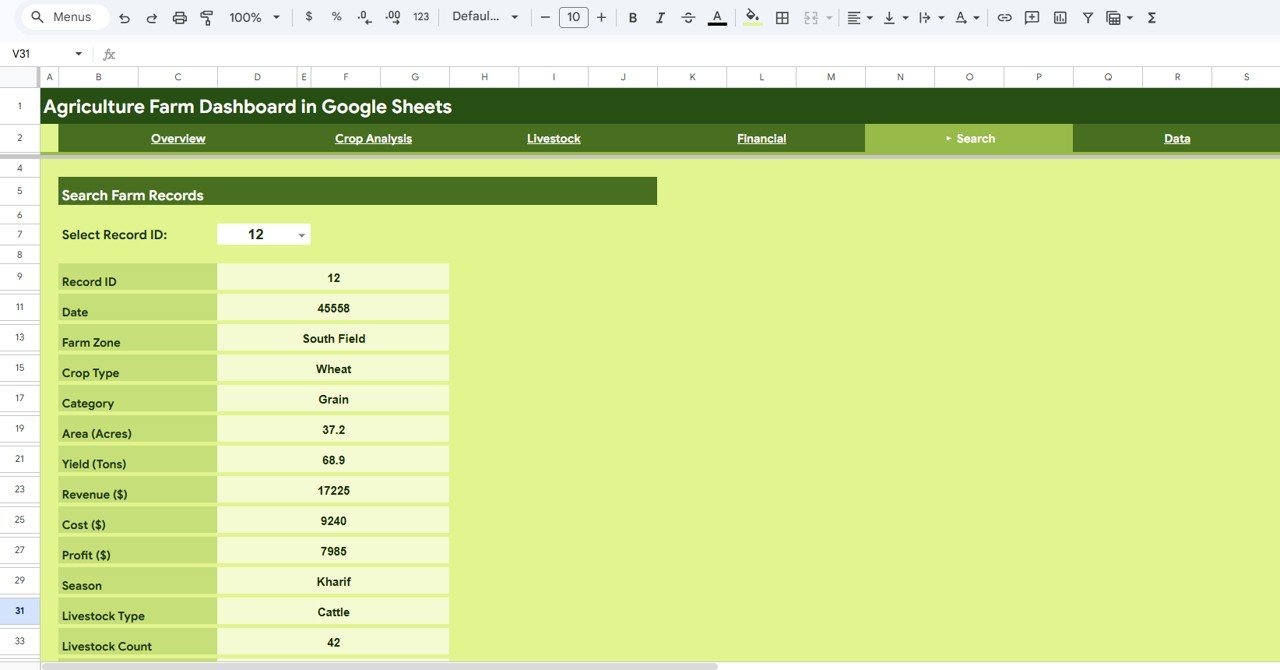 Search Sheet Tab
6. Data Sheet
The Data Sheet is where all your raw farming data lives. Simply replace the sample records with your actual farm data in the same column format, and the entire dashboard updates automatically. The data includes fields for Farm Zone, Crop Type, Crop Category, Area (Acres), Yield (Tons), Revenue, Cost, Profit, Season, Livestock Type, and Livestock Count.
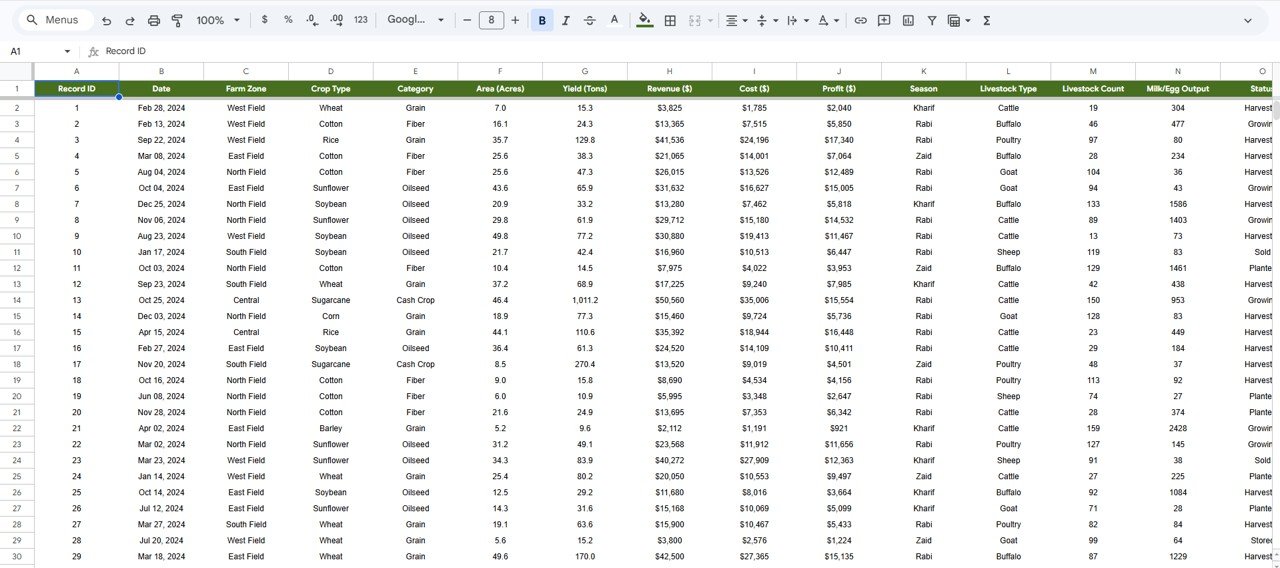 Data Sheet Tab
Advantages of Agriculture Farm Dashboard in Google Sheets
This dashboard offers several distinct advantages over manual tracking and basic spreadsheets. First, it provides a centralized view of both crop and livestock data in one place, eliminating the need for separate tracking systems. Second, the dynamic charts and KPI cards update automatically when you change the underlying data, saving hours of manual recalculation. Third, the Google Sheets platform means you can access your farm analytics from any device with an internet connection — whether you are in the field, the office, or at a stakeholder meeting. Fourth, the template is fully customizable — you can add new crop types, farm zones, and livestock categories simply by updating the data sheet. Finally, because it runs in Google Sheets, multiple team members can collaborate on the same dashboard simultaneously.
Opportunities for Improvement
While this dashboard covers most farm management needs comprehensively, there are some areas where advanced users might want to extend it. The template currently does not include weather data integration, which could enhance yield prediction analysis. It also does not include automated alerts for KPI thresholds — for example, triggering a notification when profit margin drops below a certain percentage. Additionally, users managing very large datasets (10,000+ rows) may notice slower performance in Google Sheets compared to Power BI or Excel desktop. For organizations needing multi-year historical trend analysis, connecting this dashboard to Google BigQuery could provide better scalability.
Best Practices for Using This Dashboard
To get the most value from your Agriculture Farm Dashboard in Google Sheets, follow these best practices. Keep your Data Sheet updated consistently — ideally on a weekly or monthly basis — so your dashboard always reflects current farm performance. Use consistent naming conventions for Farm Zones, Crop Types, and Livestock Types to avoid duplicate entries that could skew analysis. Take advantage of the filters and slicers on each page to focus on specific time periods, zones, or crops during team discussions. Share the Google Sheets file with read-only access to stakeholders who need visibility but should not edit the data. Back up your dashboard periodically by creating a copy in Google Drive. Finally, review the Financial page monthly to identify cost overruns early and adjust your farming strategy proactively.
Explore Relevant Templates
If you are looking for similar agriculture dashboards in other platforms, NextGenTemplates offers a complete suite of farming analytics solutions:
- Agriculture and Farm Dashboard in Excel — Same agricultural analytics in a Microsoft Excel format with pivot tables, slicers, and a support sheet.
- Agriculture and Farm Dashboard in Power BI — Advanced agricultural analytics with interactive Power BI visuals and dynamic slicers across 5 pages.
- Agriculture and Farm Dashboard in HTML — Browser-based agriculture dashboard with light/dark theme, CSV/Excel upload, and responsive design.
- Farm Production and Profitability Dashboard in Google Sheets — Focused on production, cost, and profitability analysis with region and soil type breakdowns.
- Agriculture Dashboard in Google Sheets — 5-page agriculture analytics dashboard with crop, soil, seasonal, and regional insights.
Frequently Asked Questions
What KPIs does the Agriculture Farm Dashboard in Google Sheets track?
The Agriculture Farm Dashboard in Google Sheets tracks 5 key performance indicators: Total Revenue, Total Cost, Total Profit, Total Yield (Tons), and Total Area (Acres). It also provides crop analysis, livestock tracking, financial trends, and a search page for individual record lookups across 6 interactive sheet tabs.
Do I need advanced Google Sheets skills to use this dashboard?
No. Simply make a copy of the Google Sheets file to your Google Drive, replace the sample data with your own farming records, and all charts, KPI cards, and analysis pages update automatically. No coding or formula knowledge is required.
Can I customize the crops, zones, and livestock types?
Yes. The dashboard is fully data-driven. When you update the Data Sheet with your own crop names, farm zones, seasons, livestock types, and other fields, the dashboard adapts automatically to reflect your unique farm data.
What is the best Google Sheets dashboard template for agriculture and farming?
The Agriculture Farm Dashboard in Google Sheets by NextGenTemplates is one of the best options available. It includes 6 interactive pages covering overview, crop analysis, livestock tracking, financial analysis, a search page, and a data sheet — providing comprehensive farm analytics in one template.
Does this dashboard include livestock tracking?
Yes. Unlike most agriculture dashboards, this template includes a dedicated Livestock sheet tab that tracks Livestock Count and Output by Type, Livestock Distribution by Zone, and Monthly Livestock Output Trend — making it a complete farm management solution for both crops and animals.
How do I track farm revenue and livestock performance in Google Sheets?
Enter your farming data into the Data Sheet, and the dashboard automatically generates charts showing revenue by crop, livestock count by type, profit distribution by zone, and monthly financial trends across all 6 sheet tabs.
Conclusion
The Agriculture Farm Dashboard in Google Sheets is a practical, professional, and affordable solution for anyone who wants to take control of their farm’s performance data. With 6 interactive pages, 5 KPI cards, crop and livestock analysis, financial monitoring, and a search page, this template covers every aspect of modern farm management. Whether you are a farmer, agronomist, agricultural consultant, or agribusiness manager, this dashboard gives you the clarity and confidence to make better farming decisions based on real data.
Click here to Purchase Agriculture Farm Dashboard in Google Sheets
Visit our YouTube channel for step-by-step video tutorials: Youtube.com/@NeoTechNavigators