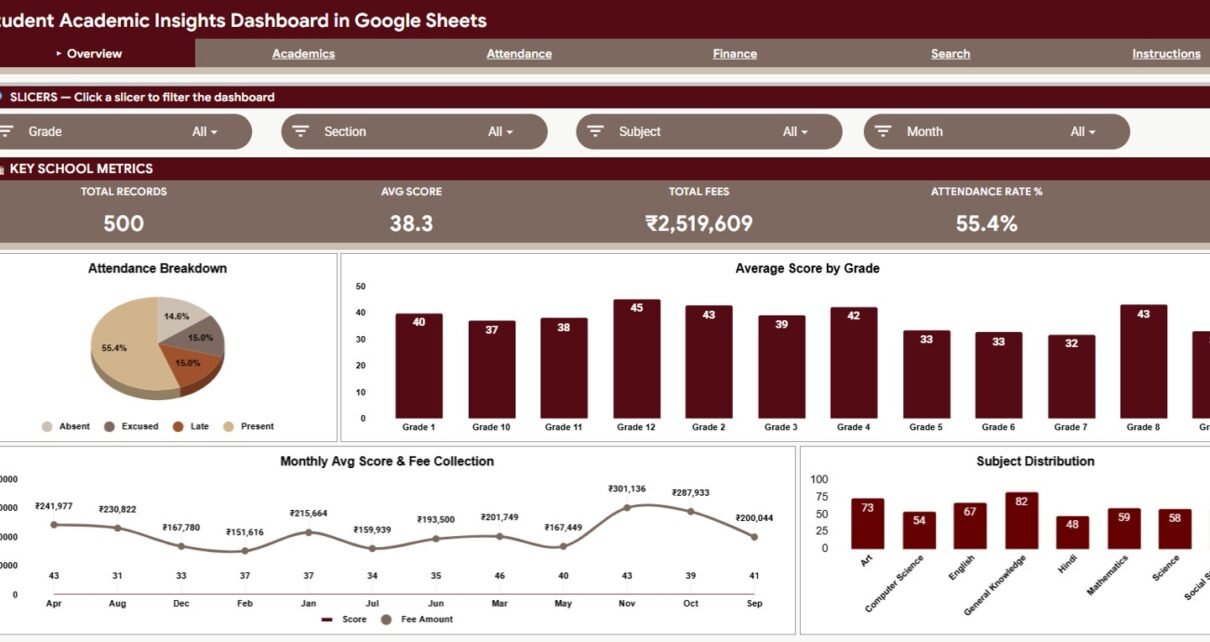
The Student Academic Insights Dashboard in Google Sheets brings four analysis pages, 4 headline KPI cards, 15 chart views, slicers on every analysis page, and a Student ID lookup into one editable spreadsheet. For schools, colleges, tutoring centers, and education teams that still track marks, attendance, and fees in scattered files, it turns one clean Data Sheet into an academic, attendance, and finance reporting system that can be reviewed in minutes.
The template is built for Google Sheets, so teams can share it through Google Drive, review it from a browser, and update records without installing extra software. It covers Total Records, Avg Score, Total Fees, Attendance Rate %, subjects, grades, exam types, teachers, attendance status, sections, fee types, and fee status.
🎥 Watch the Video Tutorial
Get the Student Academic Insights Dashboard
Key Features of the Student Academic Insights Dashboard in Google Sheets
- Connected tabs: Overview, Academics, Attendance, Finance, and Search in the navigation bar, plus an Instructions tab and the Data Sheet that feeds everything.
- 4 overview cards: Total Records, Avg Score, Total Fees, and Attendance Rate % summarize the most important values.
- 15 chart views: Analyze score, attendance, subject, teacher, section, fee, and monthly collection patterns.
- Slicers on each analysis page: Filter by Grade, Section, Subject, Month, Exam Type, Teacher, Status, Fee Type, and Fee Status, depending on the page.
- Student ID lookup: Enter or select a Student ID and return the matching student record details.
- Editable data structure: Replace the sample data with your own records while keeping the dashboard logic intact.
- Cloud collaboration: Share the file with teachers, coordinators, admin staff, or finance users through Google Drive.
Google Sheets dashboards work especially well when teams need live filtering. Google explains that slicers can filter charts and pivot tables directly in Sheets, which is exactly the style of interaction used in this dashboard: Google Docs Editors Help on slicers.
Dashboard Pages Explanation
Every analysis page has its own row of four metric cards and four slicers. The table below summarizes what each page shows in the sample file.
| Page | Metric cards | Slicers | Charts |
|---|---|---|---|
| Overview | Total Records, Avg Score, Total Fees, Attendance Rate % | Grade, Section, Subject, Month | 4 |
| Academics | Overall Avg Score, Highest Score, Lowest Score, Total Exams | Grade, Subject, Exam Type, Teacher | 3 |
| Attendance | Total Present, Total Absent, Total Late, Attendance Rate | Grade, Section, Status, Month | 4 |
| Finance | Total Fees, Fees Collected, Fees Pending, Fees Overdue | Grade, Fee Type, Fee Status, Month | 4 |
1. Overview Page
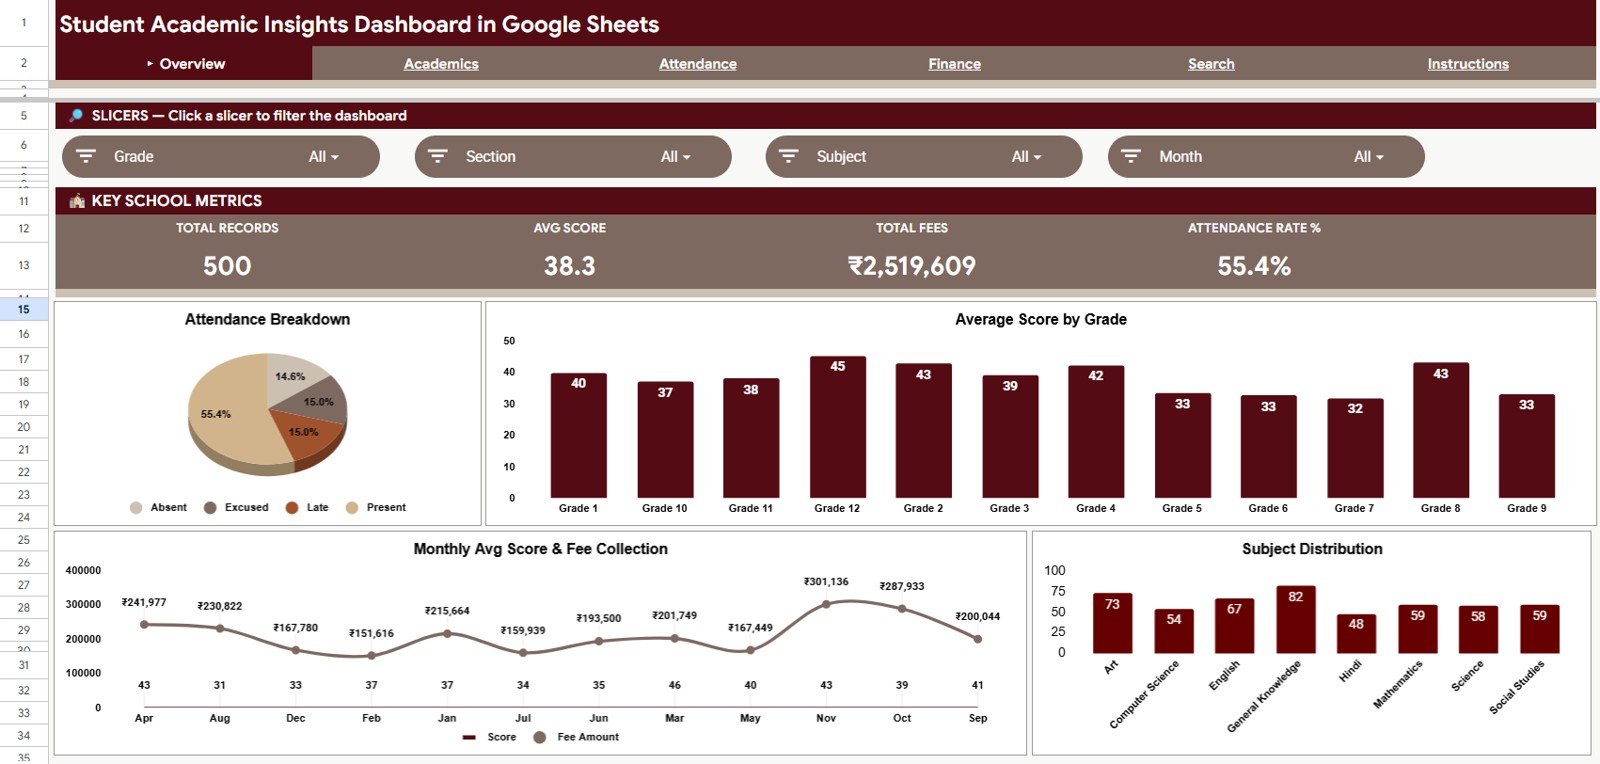
The Overview Page gives the first management view of the student dataset. The cards show Total Records, Avg Score, Total Fees, and Attendance Rate %, so leaders can check volume, learning performance, fee value, and attendance health from one page. In the sample file these read 500 records, an average score of 38.3, total fees of ₹2,519,609, and an attendance rate of 55.4%.
Attendance Breakdown: This pie chart shows how records split across Present, Absent, Late, and Excused. It helps identify whether attendance concerns are small exceptions or a visible pattern in the dataset.
Average Score by Grade: This chart compares average score across Grade 1 to Grade 12. It helps academic teams find grades that are performing well and grades that may need review.
Monthly Avg Score & Fee Collection: This chart puts monthly score movement beside fee collection. It is useful when management wants to review academic and finance activity in the same period.
Subject Distribution: This chart shows how student records are distributed across Art, Computer Science, English, General Knowledge, Hindi, Mathematics, Science, and Social Studies. It helps users check whether the dataset is balanced or weighted toward specific subjects.
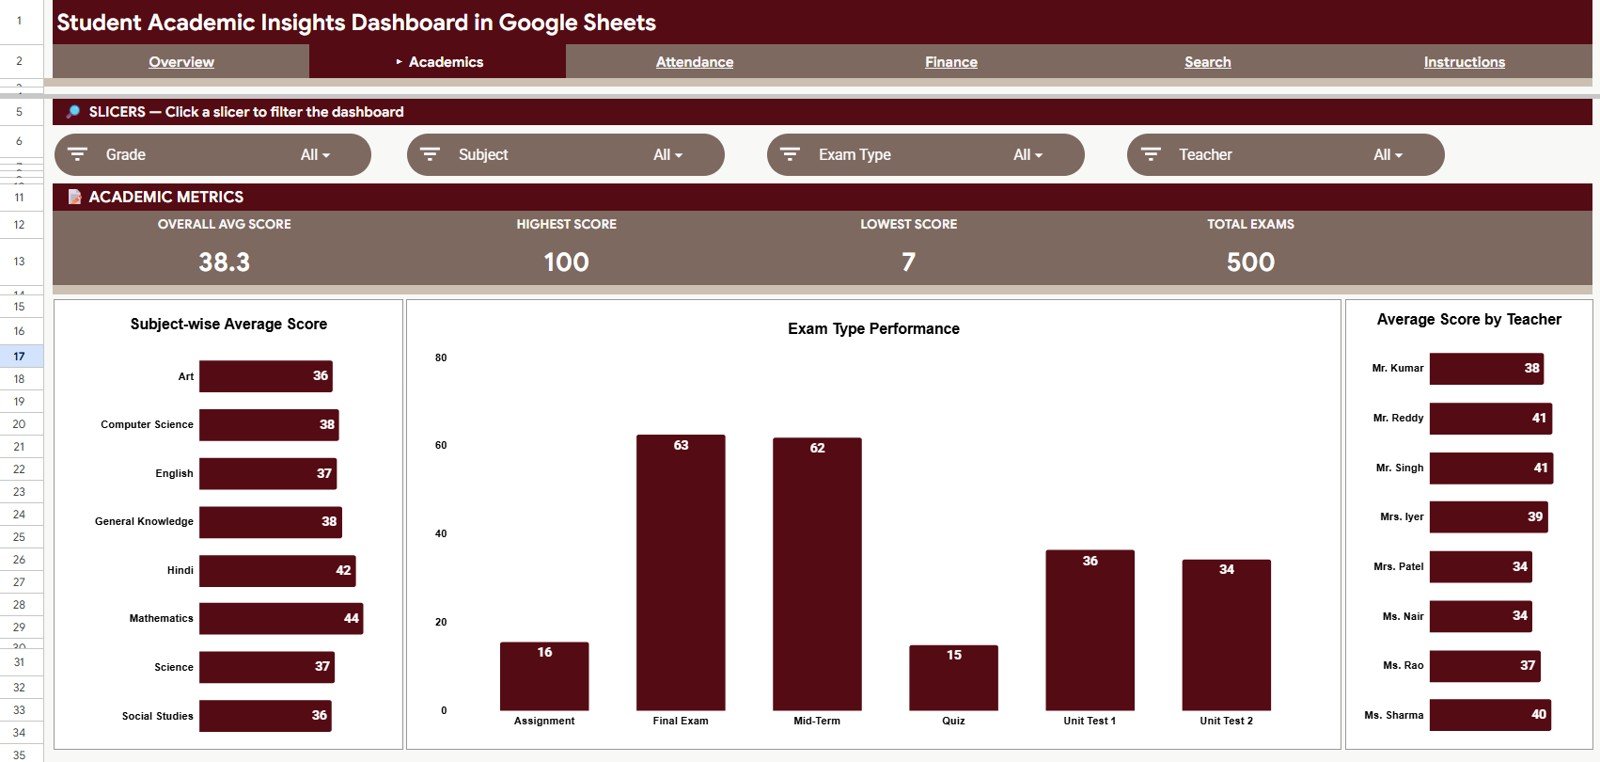
2. Academics
The Academics tab is focused on score analysis. It gives teachers and coordinators a place to review performance by subject, exam type, and teacher without building pivot tables from scratch. The cards show Overall Avg Score, Highest Score, Lowest Score, and Total Exams.
Subject-wise Average Score: This chart compares academic results across subjects. It helps identify subjects where students may need extra support or where teaching methods are working well.
Exam Type Performance: This chart compares scores across Assignment, Final Exam, Mid-Term, Quiz, Unit Test 1, and Unit Test 2. Because each exam type can have a different maximum score, compare like with like before drawing conclusions.
Average Score by Teacher: This chart summarizes average score by teacher. It supports performance review discussions while still requiring context such as class mix, subject difficulty, and exam timing.
3. Attendance
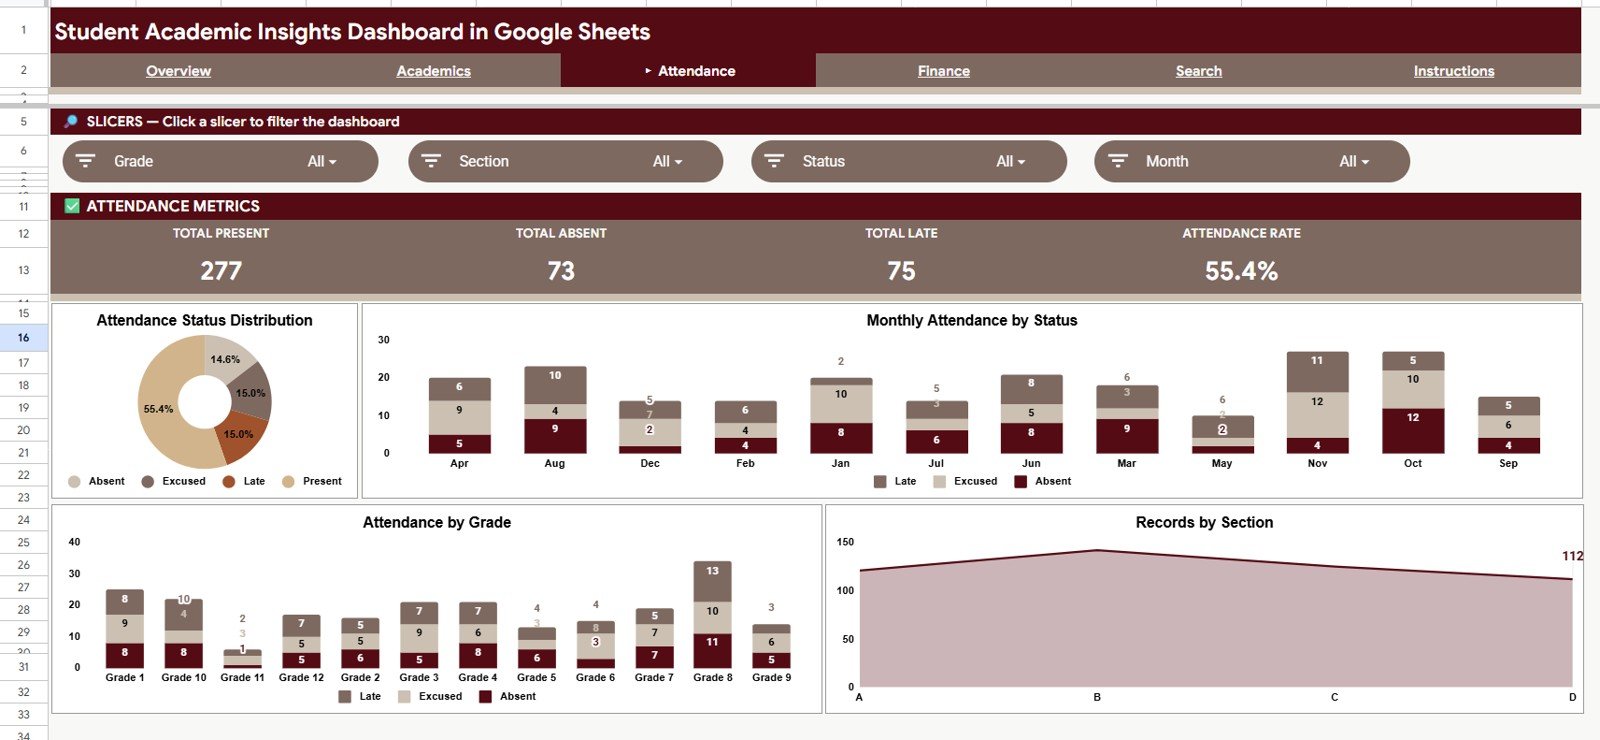
The Attendance tab provides a deeper look at attendance behavior. It is useful for teachers, section heads, coordinators, and administrators who need to understand attendance by month, grade, section, and status. The cards show Total Present, Total Absent, Total Late, and Attendance Rate.
Attendance Status Distribution: This chart shows the share of Present, Absent, Late, and Excused records.
Monthly Attendance by Status: This stacked chart shows how Late, Excused, and Absent records move month by month. It helps identify seasonal attendance drops or months that need extra follow-up.
Attendance by Grade: This chart summarizes Late, Excused, and Absent records by grade. It helps leaders compare attendance issues across grade groups.
Records by Section: This chart breaks records down by Section A, B, C, and D. It helps spot differences between classes that may sit inside the same grade level.
4. Finance
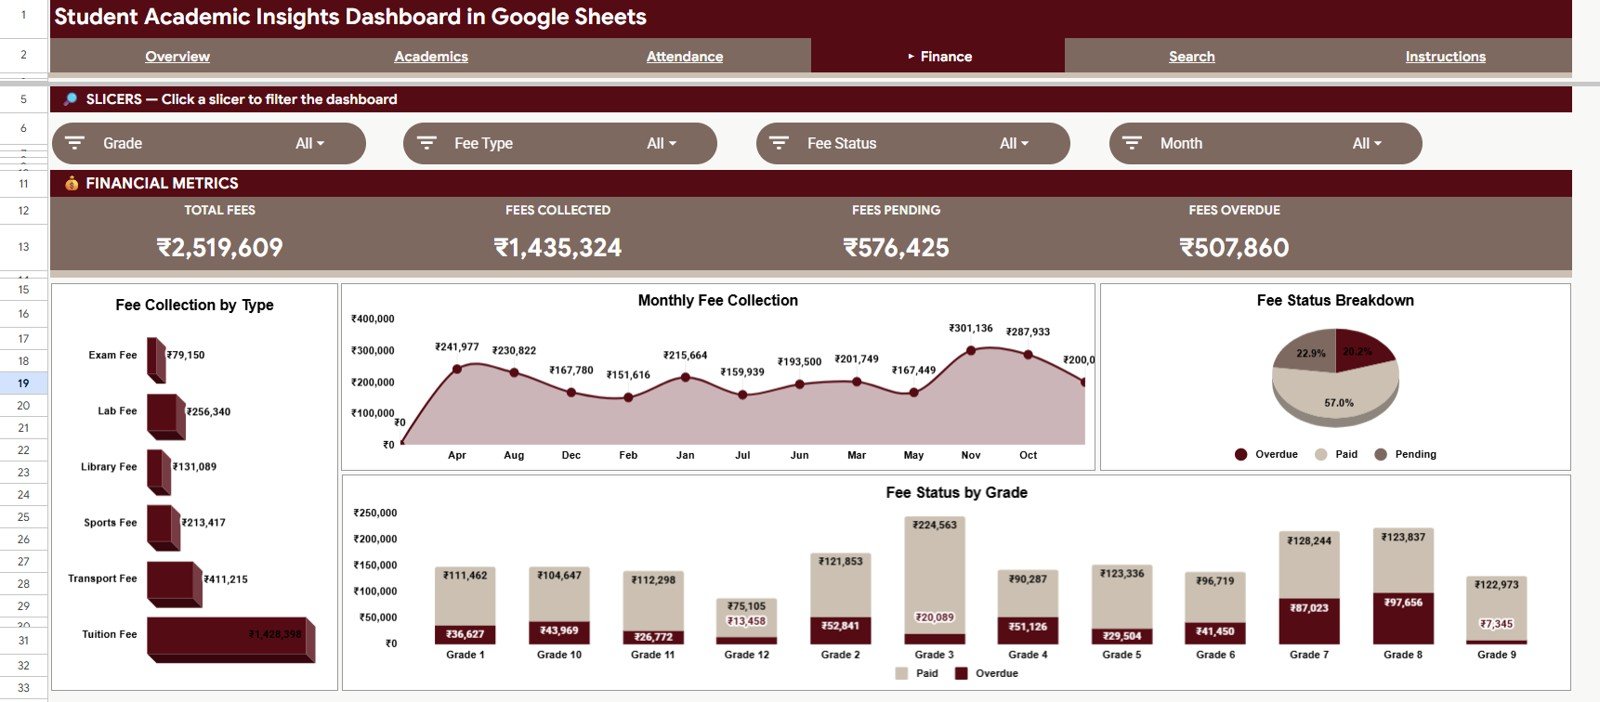
The Finance tab helps schools and academies review student fee activity. It connects fee type, fee collection month, fee status, and grade-level fee status into one view. The cards show Total Fees, Fees Collected, Fees Pending, and Fees Overdue.
Fee Collection by Type: This chart shows the total amount for Exam Fee, Lab Fee, Library Fee, Sports Fee, Transport Fee, and Tuition Fee. It helps finance users see which categories contribute the most to total fees.
Monthly Fee Collection: This chart shows fee collection by month. It helps teams see collection peaks, slow months, and seasonal changes.
Fee Status Breakdown: This chart splits fee value into Paid, Pending, and Overdue, so you can see how much still needs follow-up.
Fee Status by Grade: This chart compares Paid and Overdue amounts by grade. It helps administrators identify whether payment follow-up is concentrated in specific grade levels.
5. Search Sheet Tab
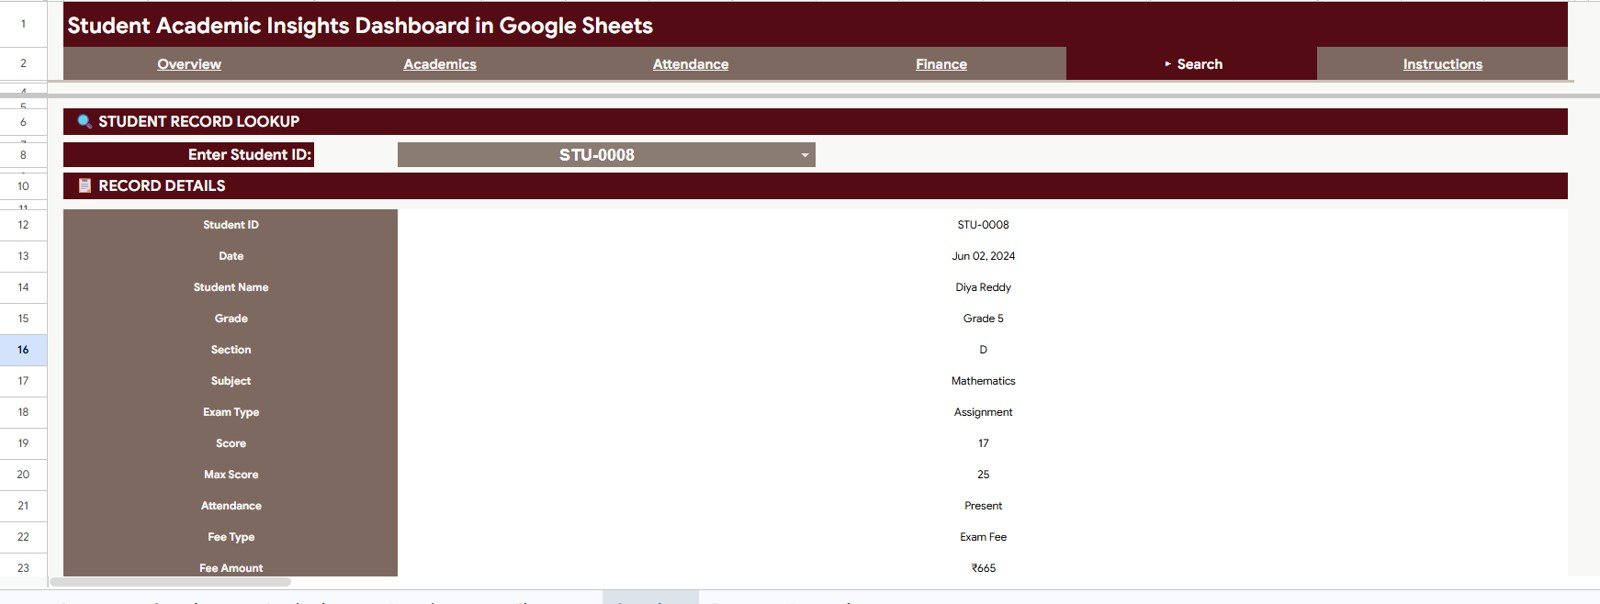
The Search Sheet (labelled Search in the navigation bar) gives users a student record lookup. Enter or select a Student ID and the sheet returns Student ID, Date, Student Name, Grade, Section, Subject, Exam Type, Score, Max Score, Attendance, Fee Type, and Fee Amount. This avoids scrolling through raw rows when someone needs one student record quickly.
6. Data Sheet Tab
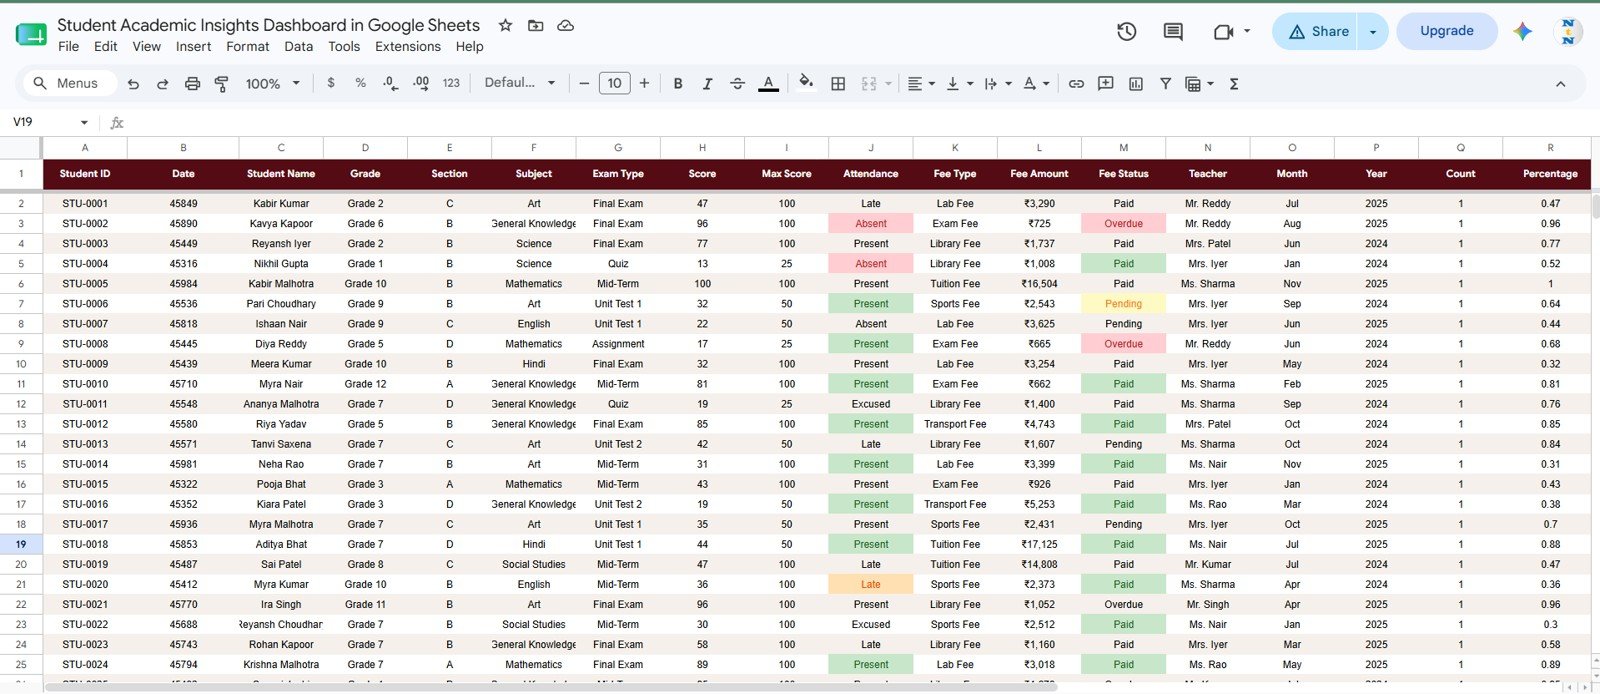
The Data Sheet is where the dashboard starts. Its columns are Student ID, Date, Student Name, Grade, Section, Subject, Exam Type, Score, Max Score, Attendance, Fee Type, Fee Amount, Fee Status, Teacher, Month, Year, Count, and Percentage. Add student records in the same format, keep the column structure clean, and the cards, charts, slicers, and lookup page remain connected.
Google Sheets vs. Excel vs. Paid School Management SaaS
| Feature | Google Sheets dashboard | Excel dashboard | Paid school SaaS |
|---|---|---|---|
| Cost | One-time template purchase | Template cost plus possible license cost | Subscription pricing |
| Platform | Google Sheets | Microsoft Excel | Vendor portal |
| Setup time | Copy sheet and replace data | Open workbook and refresh if needed | Requires configuration |
| Real-time team collaboration | Built into Google Drive | Needs OneDrive or SharePoint | Usually included by plan |
| Mobile access | Google Sheets app | Excel app | Vendor app or browser |
| Customizable fields | Editable columns, formulas, and charts | Editable workbook | Limited by admin settings |
| Share with link | Yes | Yes, if cloud-hosted | Usually needs user login |
| Student ID lookup | Included | Possible with formulas | Usually included in student profile module |
| Academic and fee view | Included in one spreadsheet | Possible with custom setup | Depends on modules |
Who Should Use This Template
This dashboard is a good fit for school administrators, teachers, academic coordinators, tutoring centers, finance coordinators, school owners, and education analysts who already manage student records in spreadsheets. It is also helpful for small institutions that want dashboard-style reporting before buying a larger school ERP system.
It is not meant to replace a full LMS, parent portal, payment gateway, biometric attendance system, or government reporting platform. If those workflows are required, this template works better as a reporting companion.
Real-World Use Cases
Rina, school administrator: uses the Overview and Attendance tabs every Monday to review total records, attendance rate, attendance status, and section-level activity before staff meetings.
Marcus, academic coordinator: reviews Subject-wise Average Score, Exam Type Performance, and Average Score by Teacher to spot teaching or assessment patterns early.
Aisha, finance officer: opens the Finance tab at month-end to check monthly fee collection, the Paid / Pending / Overdue split, and fee status by grade.
Advantages of the Student Academic Insights Dashboard
- Low cost: A one-time template purchase avoids monthly dashboard software fees.
- Easy sharing: Google Drive permissions make it simple to involve teachers, finance users, or leadership.
- Fast filtering: Slicers help users review filtered dashboard views without editing formulas.
- Focused lookup: The Search Sheet returns one student record quickly from a Student ID.
- Editable structure: Schools can adjust labels, charts, and columns after making their own copy.
Limitations to Keep in Mind
The dashboard is intentionally spreadsheet-based, so it does not include login roles, automated fee collection, parent communication, SMS alerts, or direct integration with attendance hardware. Larger institutions may eventually need a full SIS or ERP. For smaller schools and teams, the benefit is that the file stays transparent, editable, and quick to deploy.
Best Practices
- Keep the Data Sheet column order consistent so formulas and charts continue to work.
- Use one row per student record or event to avoid duplicate calculations.
- Standardize grade, section, subject, attendance, and fee status names before adding bulk data.
- Protect formula ranges if multiple users will edit the sheet.
- Use view-only access for stakeholders who only need to review the dashboard.
- Review slicer ranges after adding large batches of new data.
If you only need one part of this workflow, these NeoTechNavigators guides may help: the Student Academic Performance Dashboard in Google Sheets for score trends, the Education KPI Dashboard in Google Sheets for institution-level KPIs, the Student Fee Record Template in Google Sheets for fee tracking, and the Attendance Tracker in Google Sheets for daily attendance.
If you want to build dashboards like this yourself, the Excel Pivot Tables & Dashboards course on NextGenTemplates Academy walks through summarizing data and laying out charts step by step.
Explore Relevant Templates
- Education Dashboard in Google Sheets – another education reporting dashboard for academic performance and student metrics.
- Student Academic Performance Dashboard in Google Sheets – focused on performance, attendance, and student trends.
- Academic Year Calendar in Google Sheets – plan events, deadlines, and academic activities.
Frequently Asked Questions
What KPIs are shown on the Overview page?
The Overview page shows Total Records, Avg Score, Total Fees, and Attendance Rate %.
What chart pages are included?
The dashboard includes Overview, Academics, Attendance, and Finance analysis pages, plus the Search Sheet, an Instructions tab, and the Data Sheet. The four analysis pages hold 15 charts.
Can I search for one student?
Yes. The Search Sheet lets you enter or select a Student ID and returns the matching student record fields.
Can I customize the template?
Yes. After copying the Google Sheet, you can edit labels, chart settings, formulas, and the Data Sheet structure as needed.
Do I need advanced Google Sheets skills?
No. You need basic data entry skills if you keep the supplied structure. More advanced users can customize formulas and visuals.
Is this a full school management system?
No. It is a reporting dashboard. It does not replace parent portals, fee payment processing, LMS tools, or attendance hardware.
About the Author
Built by PK – Microsoft Certified Professional with 15+ years of Excel, Google Sheets, and Power BI experience. Founder of NextGenTemplates, reaching 300K+ subscribers across YouTube channels. Every template is hand-built and tested before release.
Wrapping Up
The Student Academic Insights Dashboard in Google Sheets gives education teams a practical way to monitor student performance, attendance, and fees from one editable file. It is best for teams that need quick visibility, simple filtering, and a clean student lookup without paying for a large software system too early. Start by pasting a few weeks of your own records into the Data Sheet and checking that the cards match your totals.
Get the Student Academic Insights Dashboard
📅 Last updated: October 2026