According to a 2025 National Center for Education Statistics report, over 65% of K-12 schools still rely on disconnected spreadsheets to track student grades, attendance, and fee payments. The School Admin Dashboard in Google Sheets consolidates all three data streams into a single, slicer-driven Google Sheets file with 4 KPI cards, 16+ charts across 4 analysis pages, a Student Record Lookup, and a plug-and-play Data sheet. Setup takes under 10 minutes — replace the sample data and every dashboard page updates automatically.
🛒 Click here to Purchase the School Admin Dashboard in Google Sheets
🌍 Join 8,400+ teams in 40+ countries using NextGenTemplates to replace paid SaaS tools with one-time-purchase spreadsheet and dashboard templates.
✅ Instant download · One-time payment at $9.99 · No subscription · No per-user fees · Lifetime access
Key Features of the School Admin Dashboard in Google Sheets
The School Admin Dashboard in Google Sheets is organized into 6 sheet tabs — Overview, Academics, Attendance, Finance, Search, and Data. The Overview page presents 4 KPI cards (Total Records, Avg Score, Total Fees, and Attendance Rate %) alongside 4 summary charts, all connected to slicers at the top of the page. The Academics, Attendance, and Finance pages add 12 more focused charts that break down performance by subject, teacher, grade, section, fee type, and month.
The Search sheet provides instant student record lookup by Student ID — enter any ID and the dashboard pulls the complete record including Date, Student Name, Grade, Section, Subject, Exam Type, Score, Max Score, Attendance, Fee Type, Fee Amount, Fee Status, and Teacher. The Data sheet is where you enter or import your records in a fixed column format; every page in the dashboard refreshes automatically when the data changes.
This template pairs well with the Daycare Center Dashboard in Google Sheets for preschool-level tracking, or the Virtual Classrooms KPI Dashboard in Excel for online learning analytics.
Dashboard Pages Explanation
🛒 Click here to Purchase the School Admin Dashboard in Google Sheets
Overview Page
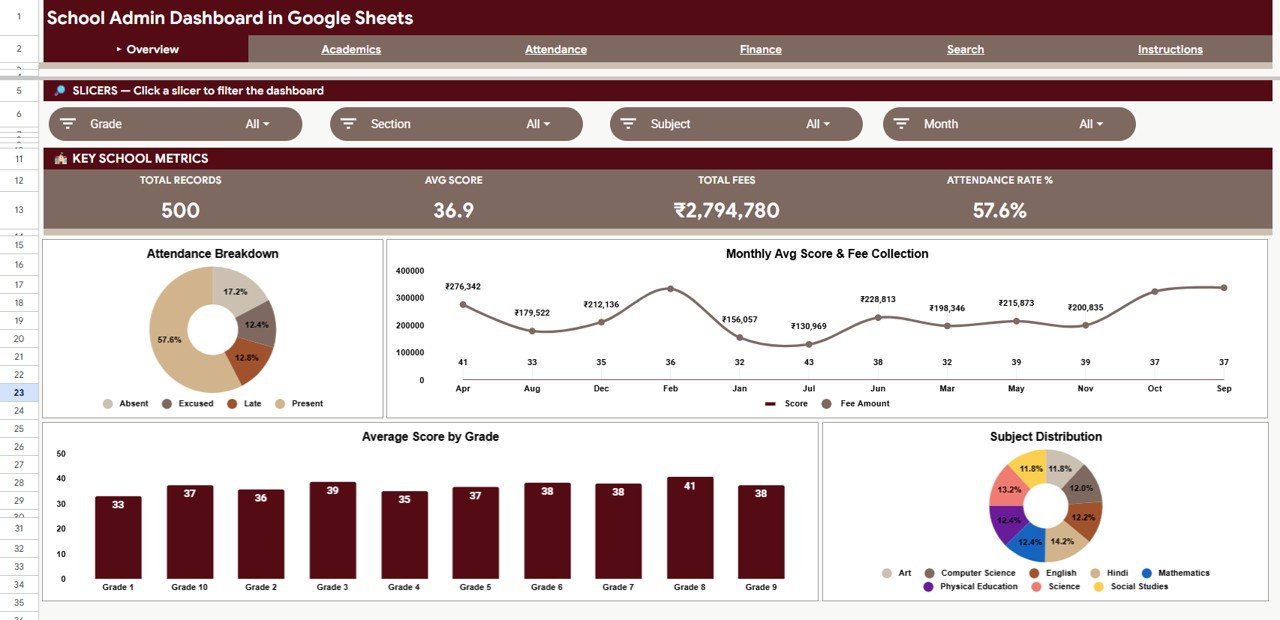
The Overview page is the main landing page. It displays 4 KPI cards at the top — Total Records, Avg Score, Total Fees, and Attendance Rate %. Below the cards, you’ll find 4 charts: Attendance Breakdown by Status, Monthly Avg Score and Fee Collection by Month, Average Score by Grade, and Subject Distribution by Subject. Multiple slicers at the top let you filter the entire page by grade, section, subject, attendance status, or fee type.
Overview Page
Academics Page
The Academics page focuses on student performance metrics with 4 charts: Subject-wise Average Score by Subject, Exam Type Performance by Exam Type, Grade vs Subject Avg Score by Grade, and Average Score by Teacher. Principals and academic coordinators can use this page to identify underperforming subjects, compare exam formats (midterm vs final vs quiz), and evaluate teacher effectiveness across grades.
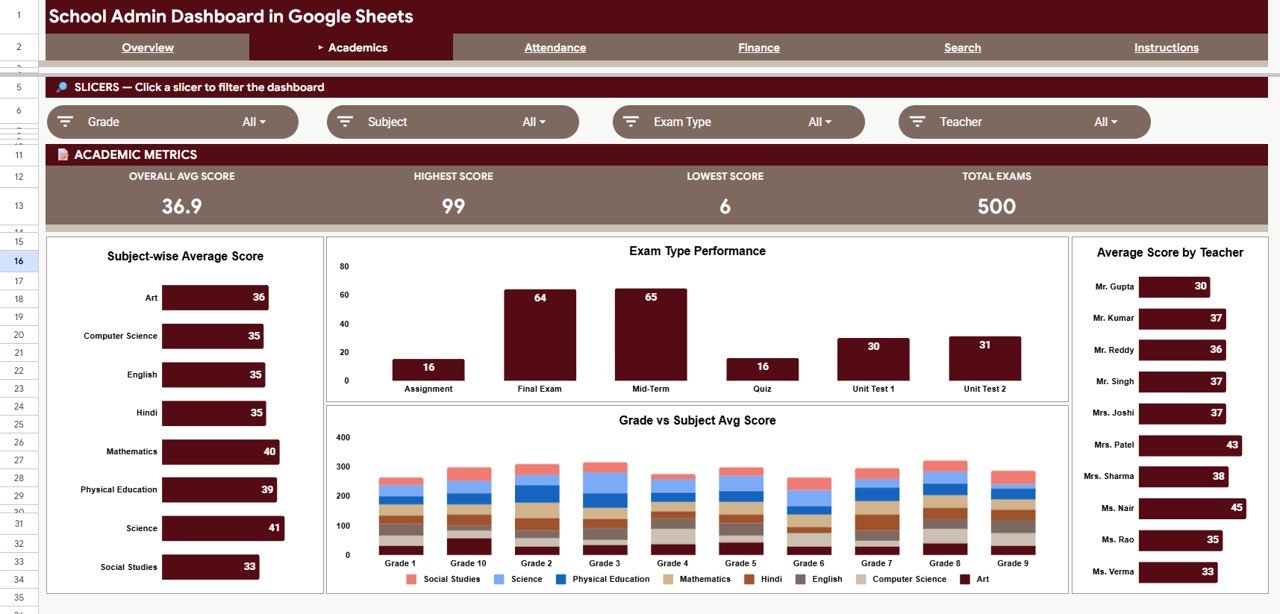
Academics Page
Attendance Page
The Attendance page tracks presence and absence patterns through 4 charts: Attendance Status Distribution by Status, Monthly Attendance by Status, Attendance by Grade, and Records by Section. This page helps administrators spot seasonal absence trends, compare attendance across grades, and identify sections with consistently low presence rates.
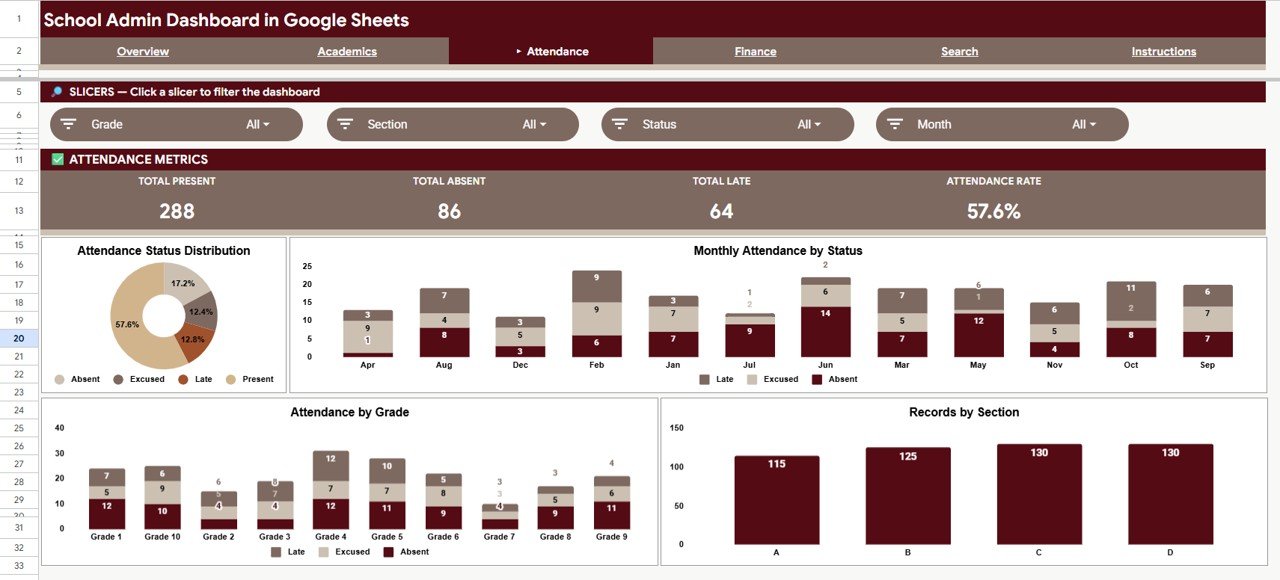
Attendance Page
Finance Page
The Finance page monitors school fee collection with 4 charts: Fee Collection by Type, Monthly Fee Collection by Month, Fee Status Breakdown by Status, and Fee Status by Grade. School accounts departments can track total collections, identify months with low recovery, and see which grades have the highest proportion of overdue or unpaid fees.
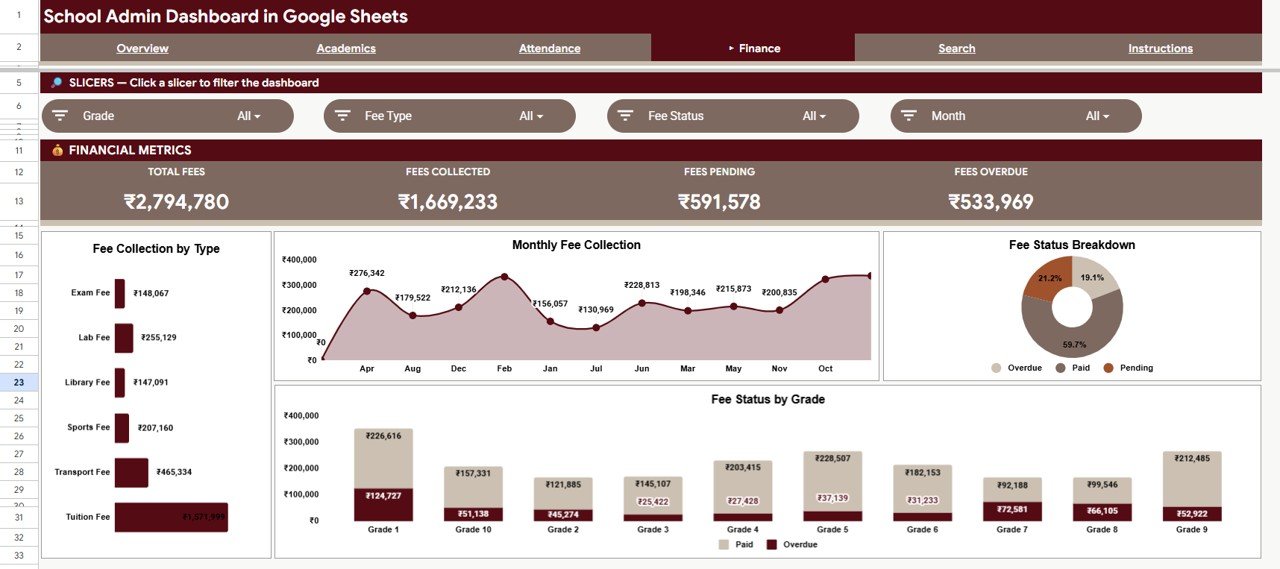
Finance Page
Search Sheet
The Search sheet provides a Student Record Lookup. Enter any Student ID into the input field and the dashboard instantly returns the complete record — Date, Student Name, Grade, Section, Subject, Exam Type, Score, Max Score, Attendance, Fee Type, Fee Amount, Fee Status, and Teacher. This is especially useful during parent-teacher meetings or when an administrator needs to pull a student’s combined academic and financial history in seconds.
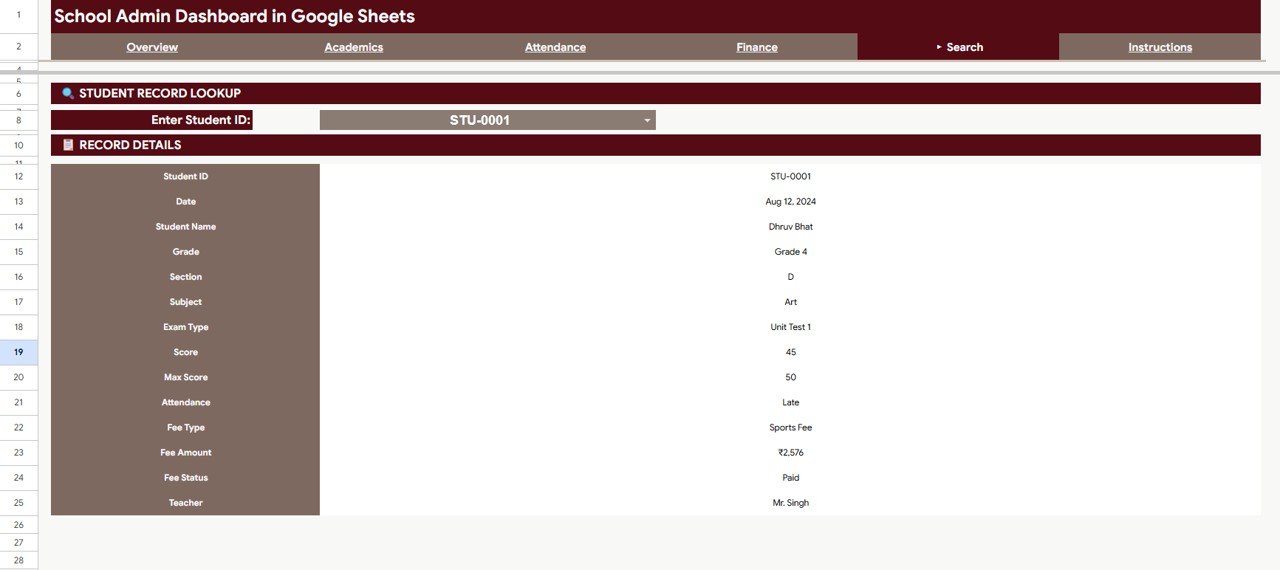
Search Sheet
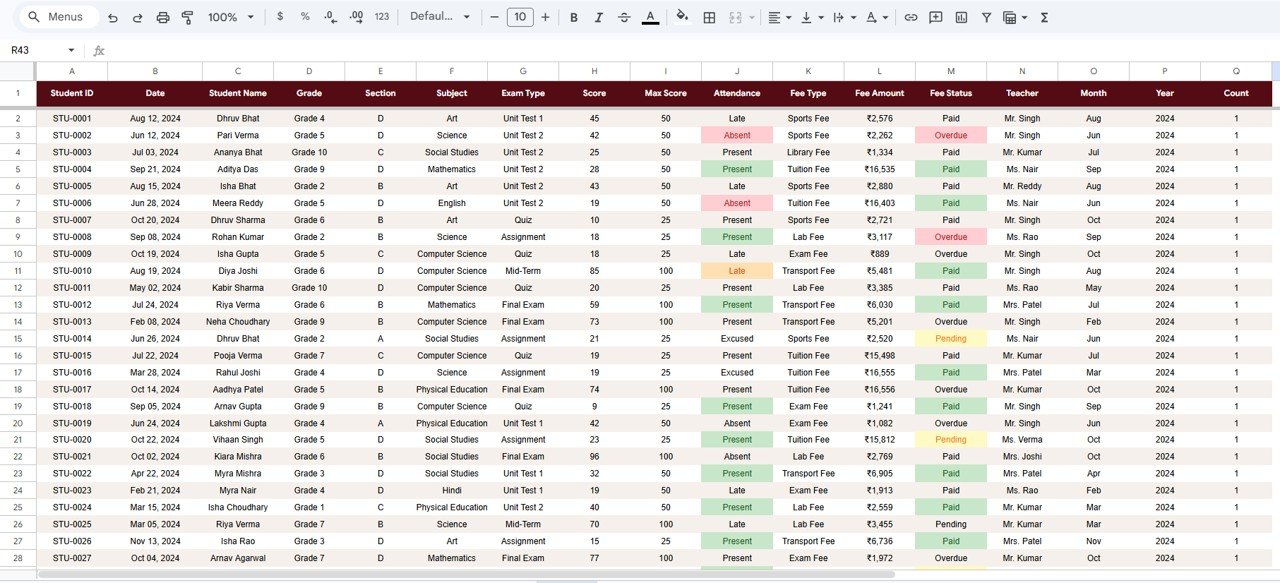
Data Sheet
The Data sheet is the single data source for the entire dashboard. Add your records in the existing column format — student ID, date, name, grade, section, subject, exam type, score, max score, attendance status, fee type, fee amount, fee status, and teacher. Every chart, card, and slicer on the other 5 pages reads from this sheet and updates automatically.
Data Sheet
School Admin Dashboard in Google Sheets vs. Excel School Dashboard vs. Paid School SaaS — Feature Comparison
| Feature | School Admin Dashboard in Google Sheets | Excel School Dashboard | PowerSchool / Classter SaaS |
|---|---|---|---|
| Cost | $9.99 one-time | $14.99 – $17.99 one-time | $3 – $10 / student / month |
| Platform | Google Sheets (any browser) | Microsoft Excel (desktop) | Cloud-based SaaS |
| Setup Time | Under 10 minutes | 10–15 minutes | 2–4 weeks onboarding |
| Real-Time Collaboration | ✅ Built-in | Limited (OneDrive) | ✅ Yes |
| Mobile Access | ✅ Google Sheets app | Limited | ✅ Mobile app |
| Customizable Fields | ✅ Fully editable | ✅ Fully editable | Limited by plan |
| Share with Link | ✅ One click | ❌ Requires OneDrive | ✅ Role-based |
| Year-1 Cost (5 Users) | $9.99 total | $14.99 – $17.99 total | $1,800 – $6,000+ |
| Student Lookup | ✅ Instant by ID | ❌ Not included | ✅ Built-in |
For schools that need academic, attendance, and fee tracking without paying per-student SaaS fees, the School Admin Dashboard in Google Sheets sits in the sweet spot.
Who Should Use This Template
🛒 Click here to Purchase the School Admin Dashboard in Google Sheets
Perfect for:
- School principals and vice principals who want a single view of academics, attendance, and fee collection
- K-12 school administrators tracking up to 1,000 students in spreadsheets
- Academic coordinators who need subject-wise and teacher-wise performance breakdowns
- Small private school owners who need a dashboard without per-student SaaS pricing
Not a fit if:
- You run a large school district (5,000+ students) needing multi-campus rollup, SSO, and API integrations
- You require parent portal access, LMS integration, or automated report card generation
Real-World Use Cases
Priya manages administration at a 400-student private school in Bangalore. She uses the School Admin Dashboard in Google Sheets to track attendance rates across 12 sections, monitor fee collection by grade, and flag students with declining scores. She replaced 4 disconnected Excel files and a paid attendance app with one Google Sheet link shared across her team — saving 3 hours weekly on reporting.
James is the principal of a charter school in Texas with 250 students. Every Monday he opens the Overview page to check Attendance Rate % and Total Fees collected. The Finance page shows which grades have the most overdue fees, and the Academics page highlights subjects where averages have dipped below 70%. He uses the Search sheet during parent-teacher conferences to pull a student’s complete record in seconds.
Maria coordinates academics at a bilingual elementary school in Mexico City. She filters the Academics page by teacher to compare performance across Spanish and English subject teachers. The slicer-driven charts help her prepare board reports without building pivot tables from scratch. Five teachers access the same dashboard simultaneously via Google Sheets — no licenses, no per-user costs.
Advantages of the School Admin Dashboard in Google Sheets
🛒 Click here to Purchase the School Admin Dashboard in Google Sheets
The biggest advantage is consolidation. Instead of maintaining separate files for grades, attendance, and fees, school administrators get one dashboard that connects all three areas through a single Data sheet. Google Sheets’ native collaboration means multiple staff members can view and update data at the same time without version conflicts. For schools in regions with limited IT budgets, the $9.99 one-time cost eliminates recurring SaaS expenses that can reach $6,000+ annually for platforms like PowerSchool. The slicer-driven filtering lets non-technical staff drill into specific grades, subjects, or fee statuses without learning formulas. And the Student Record Lookup on the Search sheet saves significant time during parent meetings and audit reviews. Learn more about using slicers in Google Sheets from Google’s official documentation.
Opportunities for Improvement
The template is designed for single-school use. Multi-campus school districts that need to roll up data from multiple schools into a central dashboard will need additional customization or a separate consolidation sheet. The current layout does not include parent-facing views or a student/parent portal — all data is accessible only to users with the Google Sheets link. There is no built-in email notification for overdue fees or low attendance; schools that need automated alerts would need to add Google Apps Script triggers or a third-party automation tool. For schools that outgrow the spreadsheet approach entirely, platforms like PowerSchool or Classter offer deeper integrations with LMS, SIS, and payment gateways.
Best Practices
Keep the Data sheet format consistent — do not add extra columns or move existing columns, as the charts and KPI cards reference fixed column positions. Use the slicers on the Overview page before drilling into the Academics, Attendance, or Finance pages to narrow your analysis scope. Schedule a weekly data entry routine (e.g., every Friday) to keep the dashboard current. If multiple staff members update the Data sheet, use Google Sheets’ version history to track changes and roll back if needed. For schools with more than 500 students, consider splitting data by academic year into separate tabs or files to keep the sheet responsive. Explore our Student Academic Performance Dashboard in Google Sheets for a deeper academic-focused template, or the Attendance Tracker in Google Sheets for standalone attendance management.
Explore Relevant Templates
🛒 Click here to Purchase the School Admin Dashboard in Google Sheets
🏫 Daycare Center Dashboard in Google Sheets — Track enrollment, attendance, billing, and staff performance for childcare centers.
🎵 Music School Dashboard in Excel — Monitor student progress, lesson revenue, and instructor performance across music programs.
🎓 Virtual Classrooms KPI Dashboard in Excel — Track student engagement, session completion, and instructor ratings.
📊 Fitness Performance and Revenue Dashboard in Google Sheets — Analyze member retention and revenue trends.
📈 Grant Management KPI Dashboard in Google Sheets — Track grant budgets, milestones, and compliance for educational institutions.
Browse the full Google Sheets Dashboard Templates catalog for 250+ ready-to-use templates.
Frequently Asked Questions
What KPIs does the School Admin Dashboard in Google Sheets track?
The School Admin Dashboard in Google Sheets tracks 4 headline KPIs: Total Records, Avg Score, Total Fees, and Attendance Rate %. These cards appear on the Overview page and update automatically when you change data or apply slicer filters.
How many charts are included in the dashboard?
The dashboard includes 16+ charts across 4 analysis pages — Overview, Academics, Attendance, and Finance. Each page contains 4 charts covering different aspects like subject scores, monthly attendance trends, exam type comparisons, and fee status breakdowns.
Can I look up a specific student’s record?
🛒 Click here to Purchase the School Admin Dashboard in Google Sheets
Yes. The Search sheet lets you enter any Student ID to instantly pull up the complete record including name, grade, section, subject, scores, attendance status, fee amount, fee status, and teacher name — all in one row.
How does this compare to PowerSchool or Classter?
PowerSchool and Classter charge $3 to $10 per student per month with 2–4 week onboarding. The School Admin Dashboard in Google Sheets costs $9.99 one-time, sets up in under 10 minutes, and covers academics, attendance, and fee tracking for schools with up to 1,000 students.
Do I need Microsoft Excel to use this dashboard?
No. The School Admin Dashboard runs entirely in Google Sheets inside your browser. All you need is a free Google account. No Excel, no desktop software, no add-ons, no macros required.
Can multiple teachers access the dashboard simultaneously?
Yes. Google Sheets supports real-time collaboration. Share the dashboard link with your staff and everyone can view or edit at the same time — no per-user fees, no licenses needed.
How long does setup take?
Setup takes under 10 minutes. Open the PDF guide from your download, click the Google Sheets copy link, go to the Data sheet, replace the sample records with your own school data, and every chart and KPI card updates automatically.
About the Author
Built by PK — Microsoft Certified Professional with 15+ years of Excel, Google Sheets, and Power BI experience. Founder of NextGenTemplates, reaching 300K+ subscribers across YouTube channels. Every template is hand-built and tested before release.
Conclusion
The School Admin Dashboard in Google Sheets gives school administrators a single-file solution for tracking academics, attendance, and fee collection — with 4 KPI cards, 16+ charts, slicer-driven filtering, and instant student lookup. At $9.99 one-time, it replaces per-student SaaS subscriptions that cost $1,800 to $6,000+ annually for a 5-teacher team.
🛒 Click here to Purchase the School Admin Dashboard in Google Sheets
✅ Instant download · One-time payment · No subscription
🎥 Visit our YouTube channel for step-by-step tutorials: Youtube.com/@NeoTechNavigators