The IT Help Desk Dashboard in Google Sheets turns a raw ticket export into a connected reporting system: 4 KPI cards, 16 charts, and a single-ticket search across 6 tabs. Setup takes under 10 minutes — paste your data into one Data tab and every chart, card, and lookup updates automatically. It costs $9.99 one-time instead of the $25–115 per agent, per month that paid help-desk SaaS charges.
Most IT teams already capture tickets somewhere, but reporting falls apart when SLA, CSAT, and agent workload sit in separate spreadsheets. This IT Help Desk Dashboard in Google Sheets gives a service desk a shared, link-based view of volume, SLA compliance, and satisfaction without a per-seat bill or any add-ons to install.
Key Features of the IT Help Desk Dashboard in Google Sheets
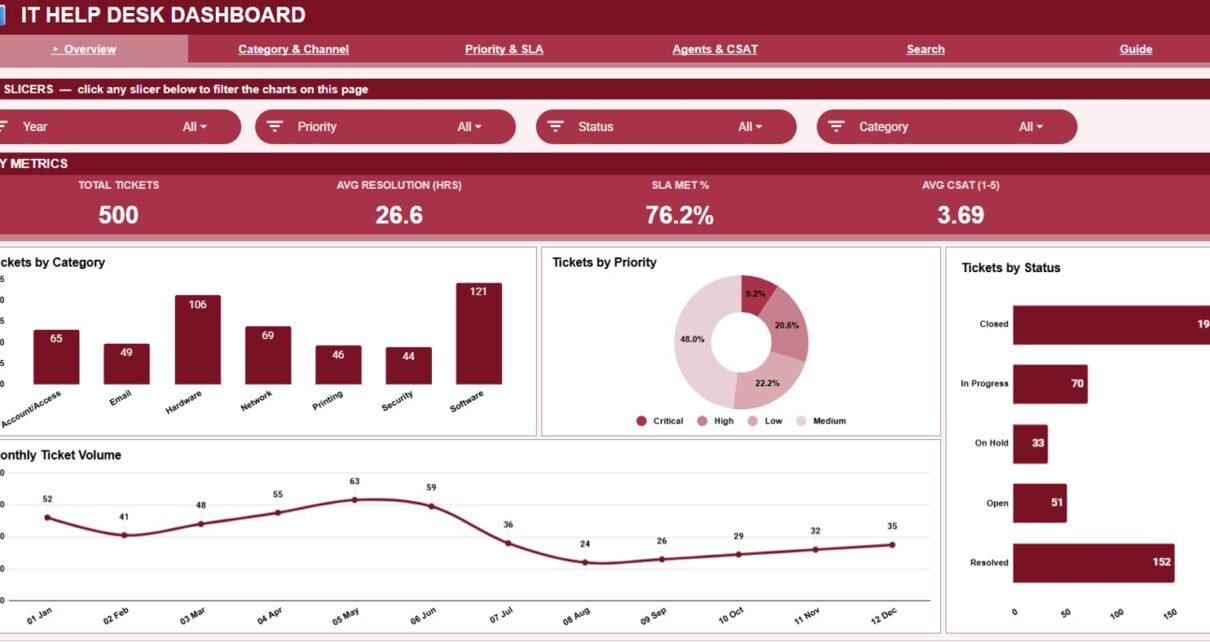
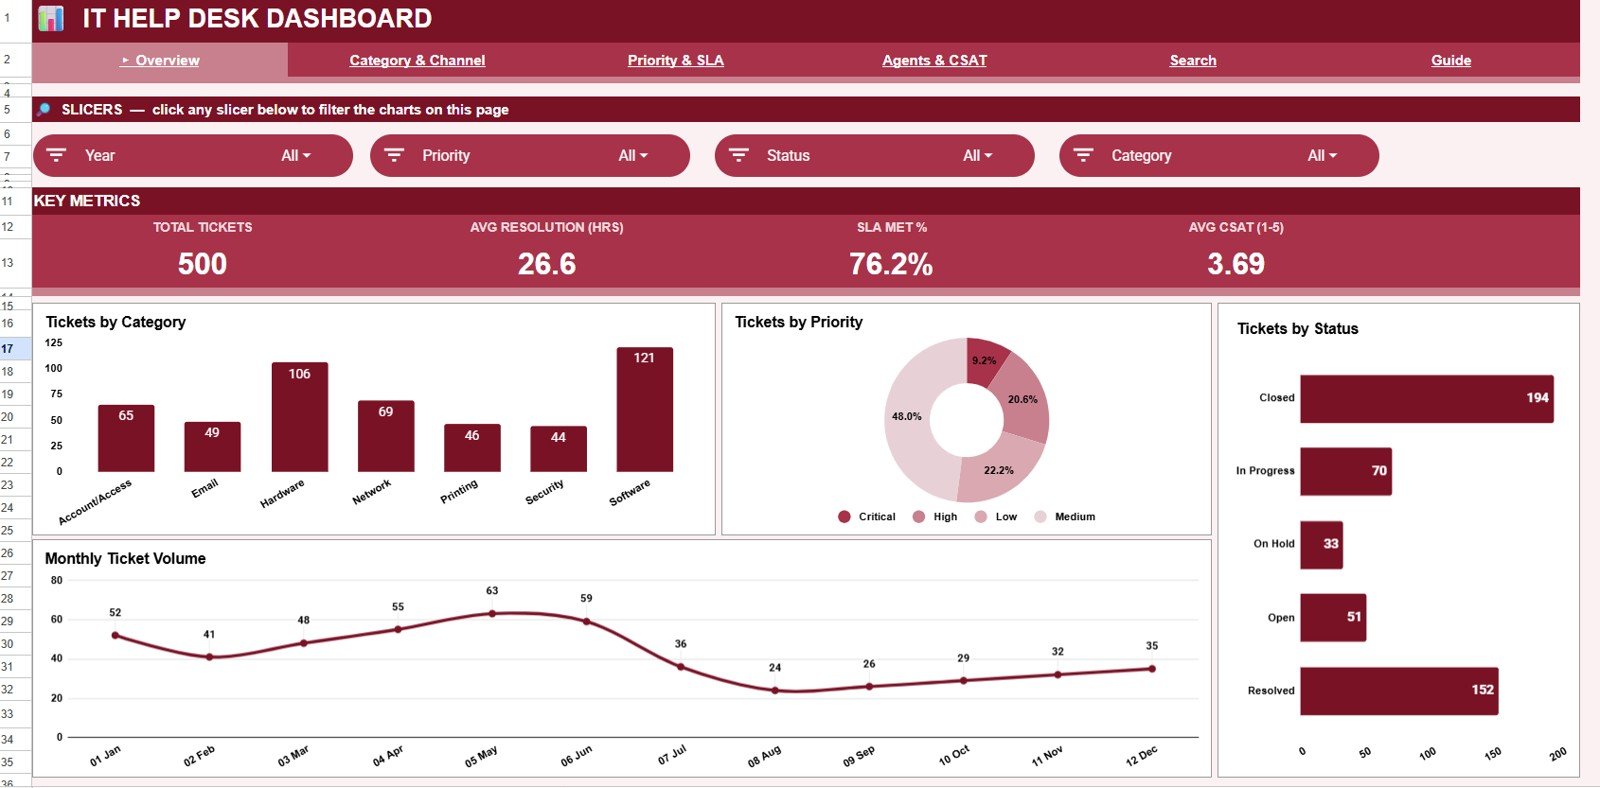
The dashboard tracks four core KPIs — Total Tickets, Average Resolution (Hours), SLA Met %, and Average CSAT (1–5) — alongside 16 charts spread across four analysis tabs. Everything is driven by a single Data tab, so adding new tickets refreshes the whole workbook.
- 4 KPI cards summarise help-desk health at the top of the Overview tab.
- 16 ready-made charts cover category, channel, priority, SLA, resolution time, agent workload, and CSAT — no pivot tables or formulas to build.
- Native Google Sheets slicers filter the Overview by category, priority, or status in one click.
- A Search tab returns every field for any Ticket ID you select.
- One Data tab drives all dashboards, so the workbook updates on its own.
Dashboard Pages Explanation
Overview
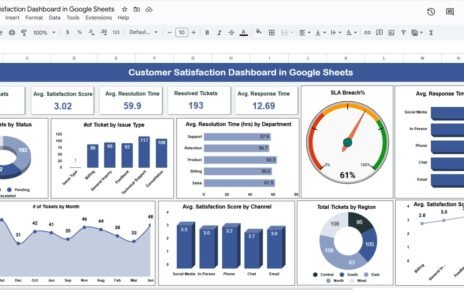
The Overview tab opens with the four KPI cards and slicers, then charts Tickets by Category, Tickets by Priority, Tickets by Status, and Tickets by Month for a fast read on volume and trend.
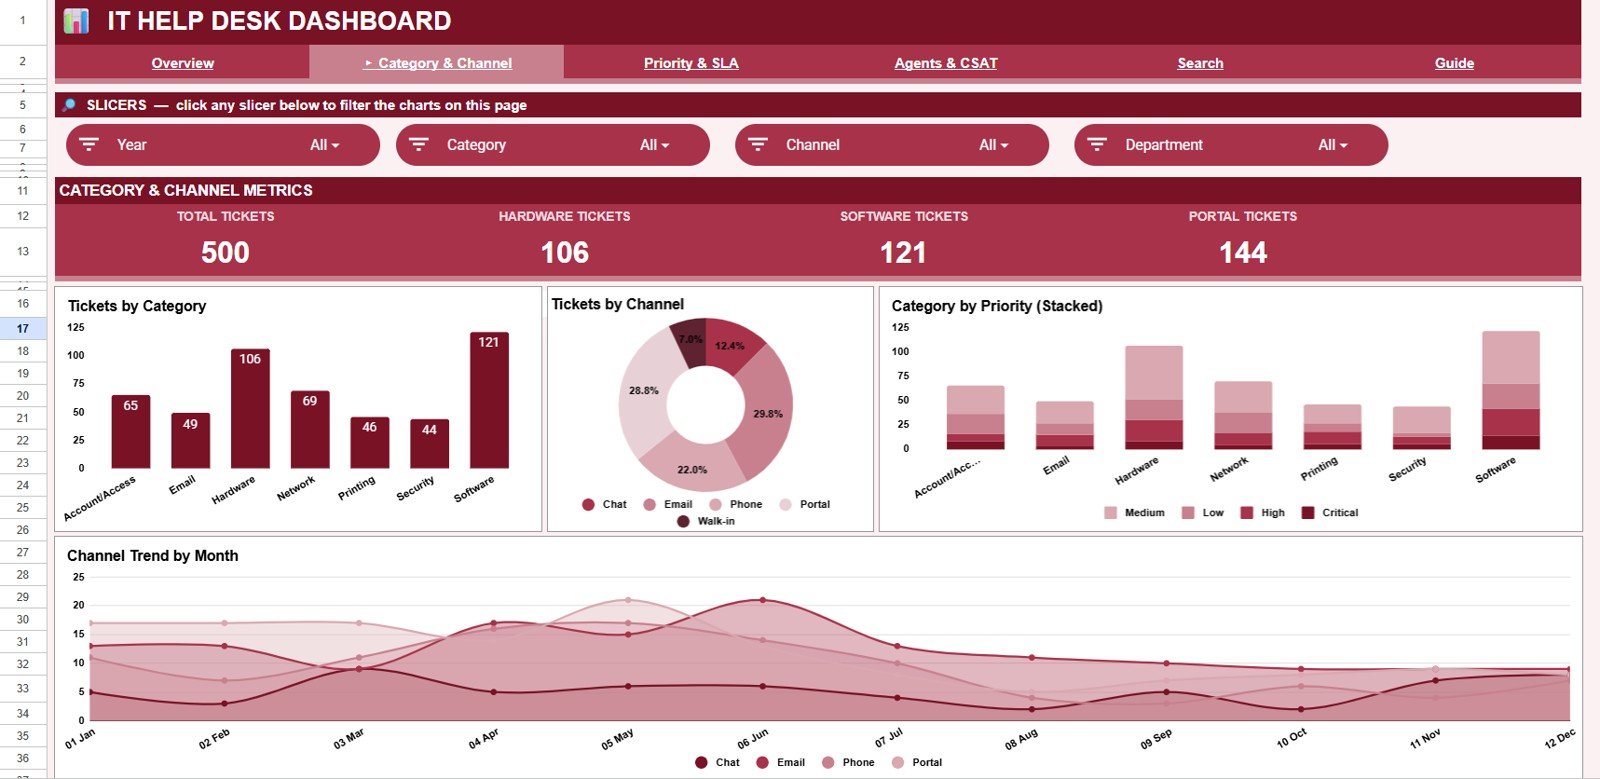
Category & Channel
This tab shows Tickets by Category, Tickets by Channel, Category by Priority, and Channel Trend by Month, so you can see which request types and intake channels create the most load over time.
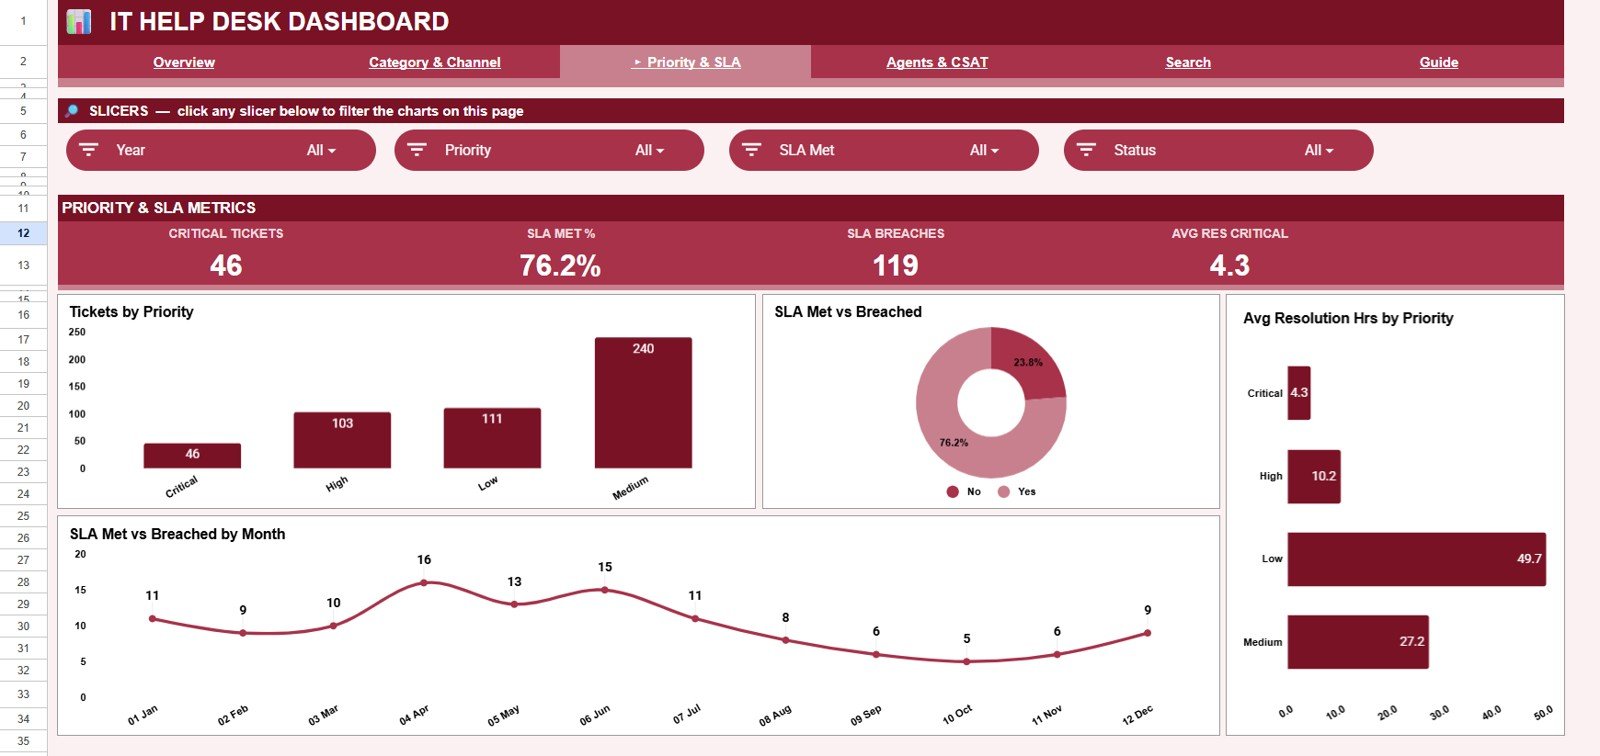
Priority & SLA
The Priority & SLA tab charts Tickets by Priority, SLA Met vs Breached, Avg Resolution Hrs by Priority, and SLA Met vs Breached by Month — making it easy to catch high-priority tickets slipping past their SLA. The Overview slicers make this filtering quick — see Google’s guide to filtering data with slicers in Google Sheets.
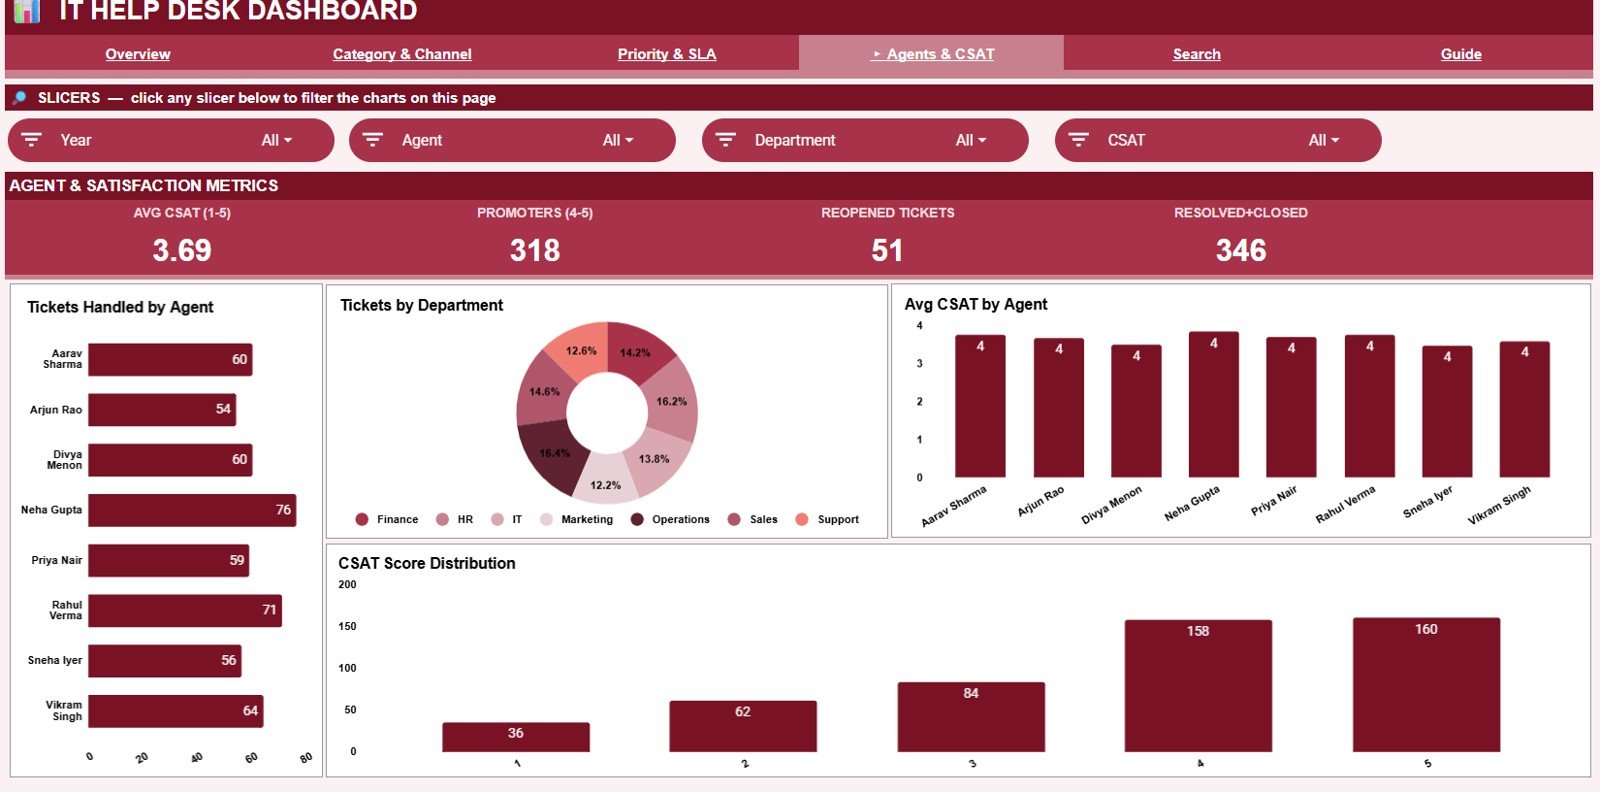
Agents & CSAT
This tab measures the team with Tickets Handled by Agent, Tickets by Department, Avg CSAT by Agent, and CSAT Score Distribution, helping you balance workloads and see who keeps customers happiest.
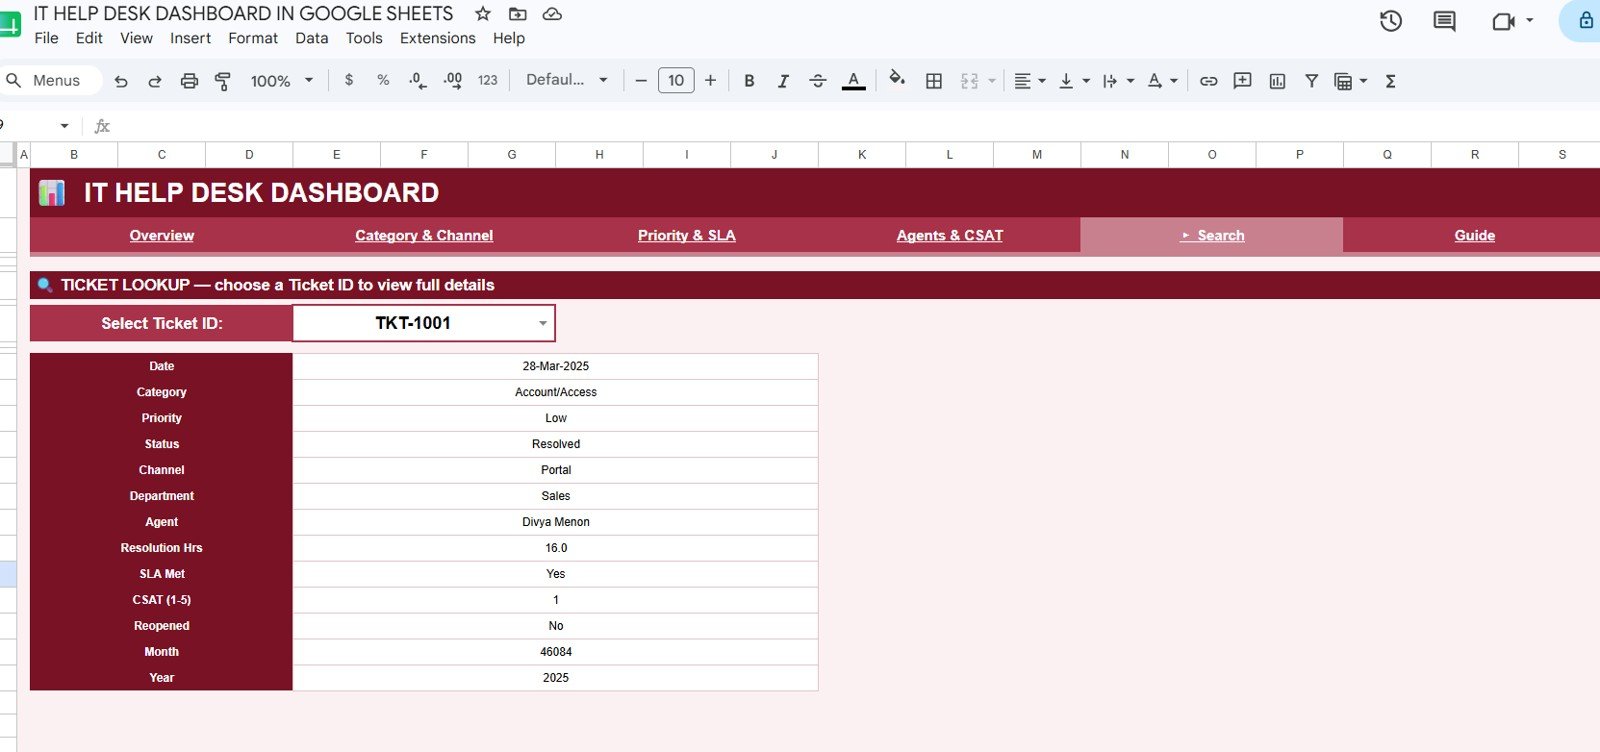
Search Sheet
Pick a Ticket ID from the dropdown and the Search tab shows the full record — Date, Category, Priority, Status, Channel, Department, Agent, Resolution Hrs, SLA Met, CSAT, Reopened, Month, and Year — all in one place.
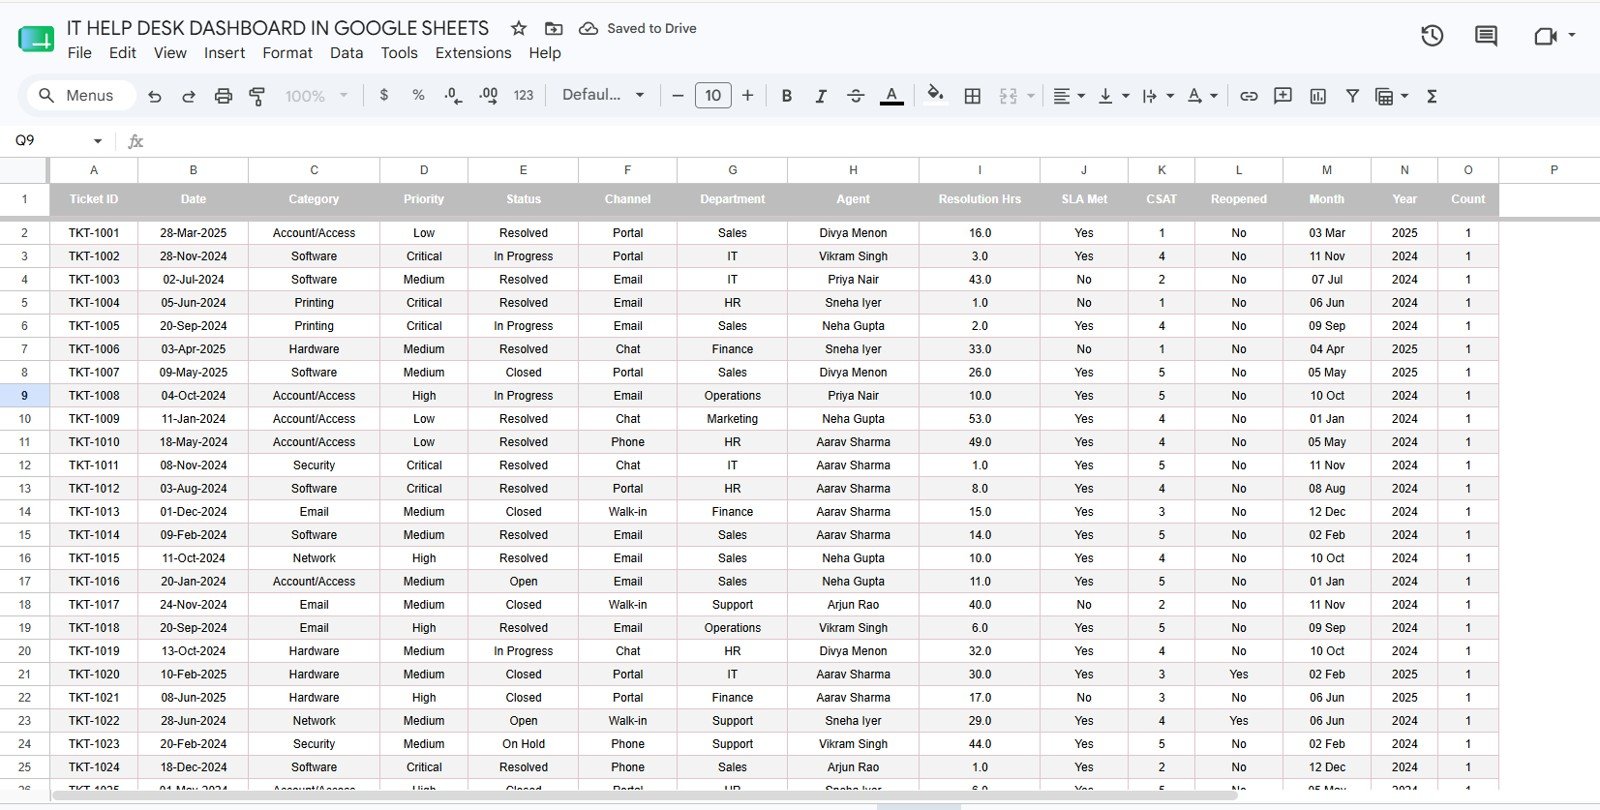
Data Sheet
The Data tab holds your records. Add tickets in the same column format as the sample and every dashboard tab plus the search lookup update automatically.
IT Help Desk Dashboard in Google Sheets vs. Excel vs. Paid Help-Desk SaaS — Feature Comparison
| Feature | IT Help Desk Dashboard (Google Sheets) | Microsoft Excel Dashboard | Zendesk / Freshdesk (Paid SaaS) |
|---|---|---|---|
| Cost | $9.99 one-time ✅ | One-time purchase | $25–115 / agent / month |
| Platform | Google Sheets (any device) ✅ | Microsoft Excel (desktop) | Web app + mobile |
| Setup time | Under 10 minutes ✅ | Under 10 minutes | Hours to days |
| Real-time collaboration | Yes — native ✅ | Limited | Yes |
| Mobile access | Yes — Sheets app ✅ | Limited | Yes |
| Customizable fields | Fully editable ✅ | Fully editable | Vendor schema only |
| Share with a link | Yes ✅ | No | Yes |
| Year-1 cost at 5 agents | $9.99 total ✅ | One-time | $1,500–$6,900 / year |
For IT teams that want SLA, CSAT, and ticket analytics without a per-agent monthly bill, the IT Help Desk Dashboard in Google Sheets sits in the sweet spot.
Who Should Use This Template
Perfect for:
- Small and mid-size IT teams (2–50 agents) that want reporting without paying per seat
- MSPs and internal support desks already in Google Workspace
- IT managers who present SLA %, CSAT, and agent workload in weekly or monthly reviews
Not a fit if:
- You need live ticket intake, email piping, or automated routing — this is a reporting layer, not a ticketing engine
- You require SOC 2, SSO, or audit-grade access controls inside the tool
- You prefer a desktop file — the Excel version or Power BI version may suit you better
Real-World Use Cases
Ravi manages a 12-agent internal IT desk at a manufacturing firm. Each month he reviews SLA Met % and Avg Resolution Hours by priority in the IT Help Desk Dashboard in Google Sheets, then shares the link with leadership — instead of paying $55 per agent per month for a SaaS suite.
Nadia runs a small MSP supporting five clients. She filters the Overview slicers by category to show each client where their tickets cluster, then uses the Agents & CSAT tab to back up satisfaction scores at renewal time.
Tom, a support team lead, opens the Search tab in daily stand-ups to review reopened and breached tickets by ID, keeping the team focused on the records that matter.
Advantages of the IT Help Desk Dashboard in Google Sheets
The biggest advantage is cost: a one-time $9.99 replaces a recurring per-agent subscription that can reach thousands of dollars a year. Because it runs in Google Sheets, the dashboard is shareable by link, works on mobile, and supports real-time collaboration with no software to install. The single Data tab means reporting stays current with almost no maintenance, and you can read related views like our Helpdesk Efficiency KPI Dashboard in Google Sheets and Ticket Resolution Time KPI Dashboard in Google Sheets for deeper SLA analysis.
Opportunities for Improvement
This dashboard is built for analysis, not live operations. It does not pull tickets automatically from email or a ticketing platform, so you still export and paste your data. It also has no built-in alerting, and access control is whatever Google Sheets sharing provides — fine for most small teams, but not a substitute for enterprise SSO or audit logging. Teams needing full intake and routing should pair it with a system like the IT Password Reset Request Tracker in Google Sheets or a dedicated ticketing app.
Best Practices
- Keep the Data tab columns in the exact order shown in the sample so charts and search keep working.
- Standardise category, channel, and priority labels so slicers group cleanly.
- Refresh the export on the same day each week for consistent SLA and CSAT trends.
- Duplicate the workbook per quarter if you want to archive history without slowing the live file.
Explore Relevant Templates
Browse more options on NextGenTemplates:
- Helpdesk Efficiency KPI Dashboard in Google Sheets
- IT Helpdesk Ticket Tracker in Google Sheets
- IT Helpdesk Ticket Management System (web app)
- Also read our IT Services Dashboard in HTML and Customer Engagement KPI Scorecard guides.
💎 Save more — get this and 7 more tools in the IT & Cybersecurity Operations Bundle (8 templates).
Also available as: Excel version · Power BI version
Frequently Asked Questions
What KPIs does the IT Help Desk Dashboard in Google Sheets track?
The IT Help Desk Dashboard in Google Sheets tracks four core KPIs — Total Tickets, Average Resolution (Hours), SLA Met %, and Average CSAT (1–5) — plus 16 supporting charts across category, channel, priority, SLA, agents, and CSAT. All metrics update when you replace the sample data.
How long does setup take?
Setup takes under 10 minutes. Make a copy of the IT Help Desk Dashboard in Google Sheets, paste your tickets into the Data tab in the sample format, and the Overview, analysis tabs, and Search lookup all refresh automatically.
How does this compare to Zendesk or Freshdesk?
Zendesk and Freshdesk charge $25–115 per agent each month and handle live ticketing. The IT Help Desk Dashboard in Google Sheets is a one-time $9.99 reporting layer for SLA, CSAT, and agent analytics — ideal when you already capture tickets elsewhere.
Can I filter the dashboard by category or priority?
Yes. The Overview tab of the IT Help Desk Dashboard in Google Sheets includes native slicers, so you can filter every KPI card and chart by category, priority, or status in one click.
Do I need add-ons or scripts to use it?
No. The IT Help Desk Dashboard in Google Sheets uses standard Google Sheets features — slicers, charts, and lookups. There are no add-ons, no macros, and no monthly fees.
Is an Excel or Power BI version available?
Yes. The same dashboard is available as an IT Help Desk Dashboard in Excel and in Power BI, so you can choose the platform your team already uses.
About the Author
Built by PK — Microsoft Certified Professional with 15+ years of Excel, Google Sheets, and Power BI experience. Founder of NextGenTemplates, reaching 300K+ subscribers across YouTube channels. Every template is hand-built and tested before release.
Conclusion
If your IT team needs clear SLA, CSAT, and ticket analytics without a per-agent subscription, the IT Help Desk Dashboard in Google Sheets is a fast, low-cost way to get there. Click here to Purchase the IT Help Desk Dashboard in Google Sheets and start reporting in minutes.
Instant download · One-time payment · No subscription. For video tutorials, visit Youtube.com/@NeoTechNavigators.
Last updated: June 2026