According to a 2025 Gartner report, companies that actively track customer engagement metrics see 23% higher revenue growth compared to those that rely on gut instinct. Yet 67% of small-to-medium businesses still manage customer KPIs through fragmented spreadsheets with no structured scorecard. The Customer Engagement KPI Scorecard in Google Sheets solves this by tracking 10+ engagement metrics across 4 structured worksheets, with MTD/YTD toggles, conditional formatting, and trend charts that update automatically when you enter your data.
🌍 Join 8,400+ teams in 40+ countries using NextGenTemplates to replace paid SaaS tools with one-time-purchase spreadsheet templates.
✅ Instant download · One-time payment · No subscription · No per-user fees · Lifetime access
Key Features of Customer Engagement KPI Scorecard in Google Sheets
🛍️ Click here to Purchase Customer Engagement KPI Scorecard in Google Sheets
The Customer Engagement KPI Scorecard in Google Sheets monitors key customer metrics including Customer Satisfaction Score (CSAT), Net Promoter Score (NPS), Customer Retention Rate, Customer Churn Rate, Average Response Time, First Contact Resolution Rate, Customer Lifetime Value (CLV), Repeat Purchase Rate, Engagement Rate, and Support Ticket Volume. Each KPI displays actual values alongside targets with color-coded conditional formatting that flags underperforming metrics instantly.
The scorecard includes a dynamic month selector dropdown that refreshes all KPI values for Month-to-Date and Year-to-Date views. You can toggle between comparing actuals against targets or against previous year figures — no manual recalculation needed. The KPI Trend sheet provides detailed line-chart analysis for any selected metric, with an info bar displaying KPI Group, Unit, Type (Lower the Better or Upper the Better), Formula, and Definition.
A dedicated KPI Definition sheet documents every metric’s name, group, unit, formula, and description — ensuring your entire team uses consistent definitions when reporting on customer engagement performance. This level of structured governance is what separates a professional scorecard from a basic spreadsheet. For more Google Sheets analytics solutions, explore our Google Sheets Dashboard Templates catalog.
Dashboard Pages Explanation
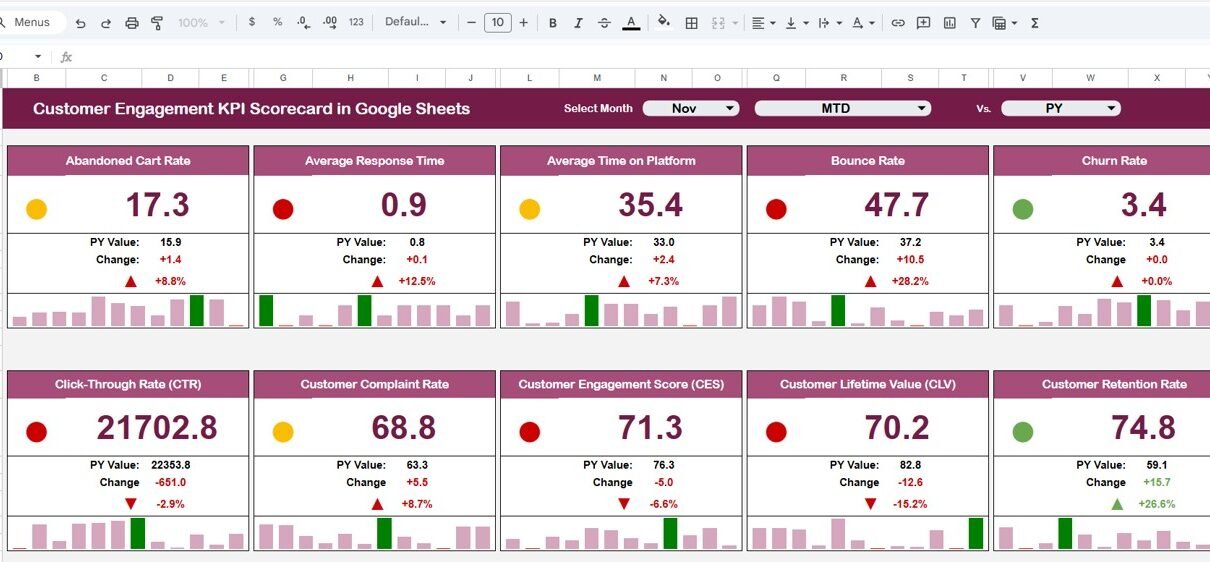
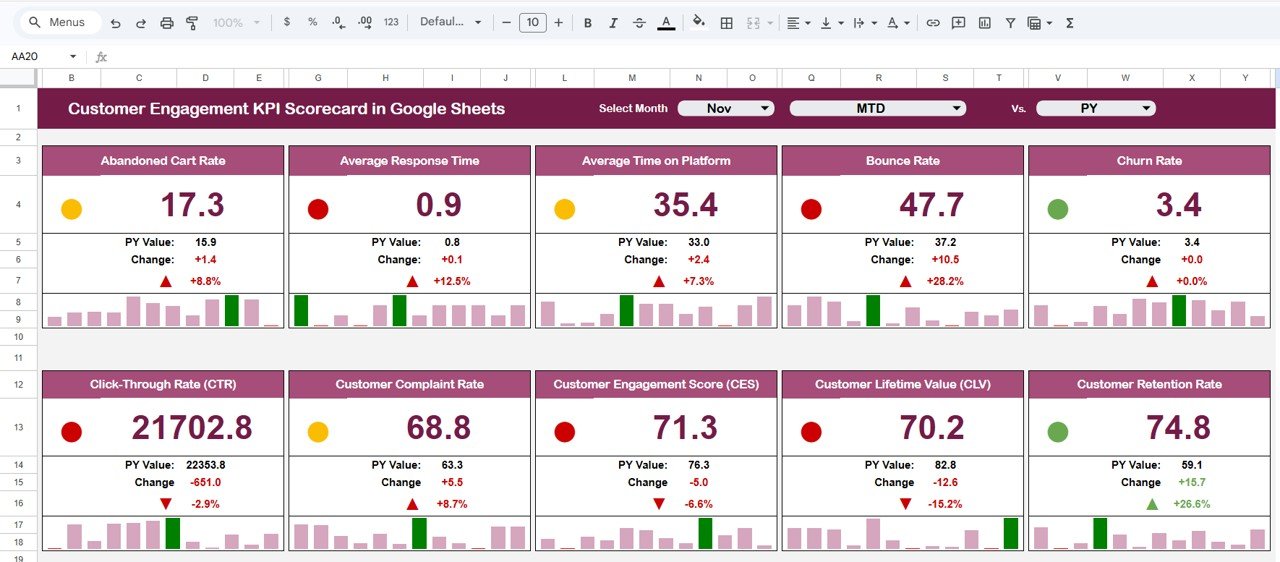
1. Scorecard Sheet
The Scorecard sheet is the main interface where you view KPI performance. Key features include dropdown menus to select the month, MTD (Month-to-Date), or YTD (Year-to-Date) for performance analysis. You can compare actual values against target values for each KPI, with visual indicators using color-coded conditional formatting to quickly see performance status. The sheet provides a comprehensive KPI overview displaying all relevant information about each metric, including MTD and YTD comparisons in one consolidated view.
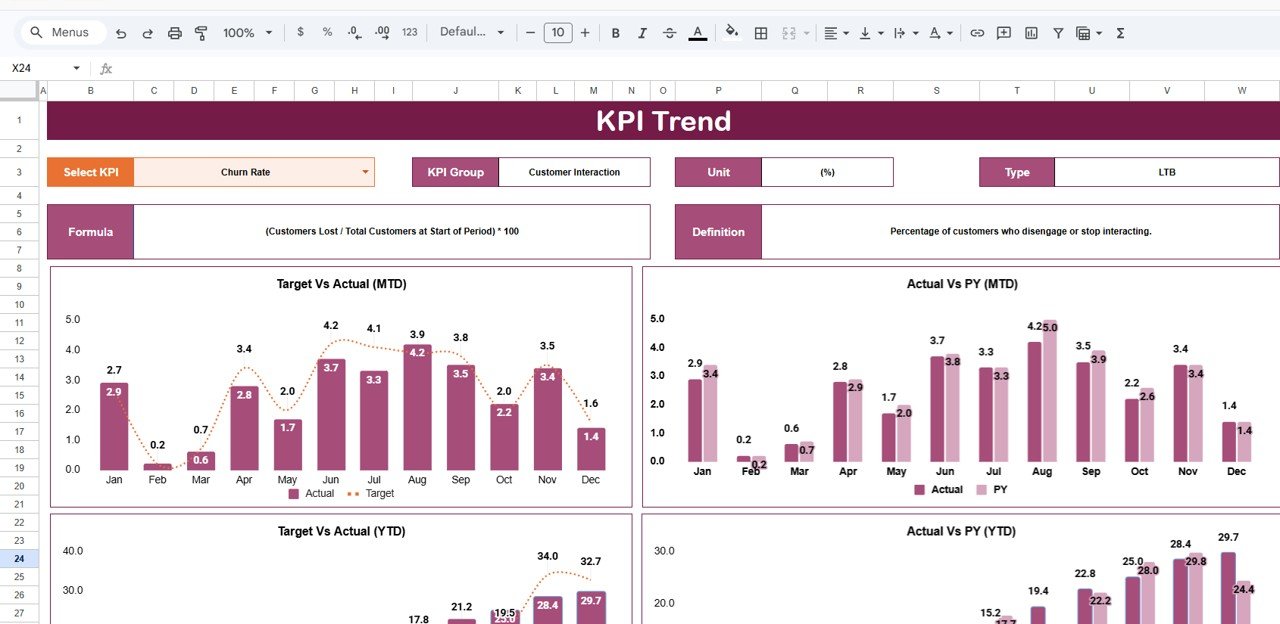
2. KPI Trend Sheet
Select any KPI name from the dropdown available on range C3. The sheet displays the KPI Group, Unit of KPI, Type of KPI (Lower the Better or Upper the Better), Formula of the KPI, and Definition of the KPI. MTD and YTD trend charts show Actual, Target, and Previous Year numbers side by side for clear visual analysis — ideal for strategy reviews and performance deep dives. If you’re looking for similar trend-analysis features in other industries, check out the Gaming KPI Scorecard in Google Sheets or the Advertising KPI Scorecard in Google Sheets.
 KPI Trend Sheet
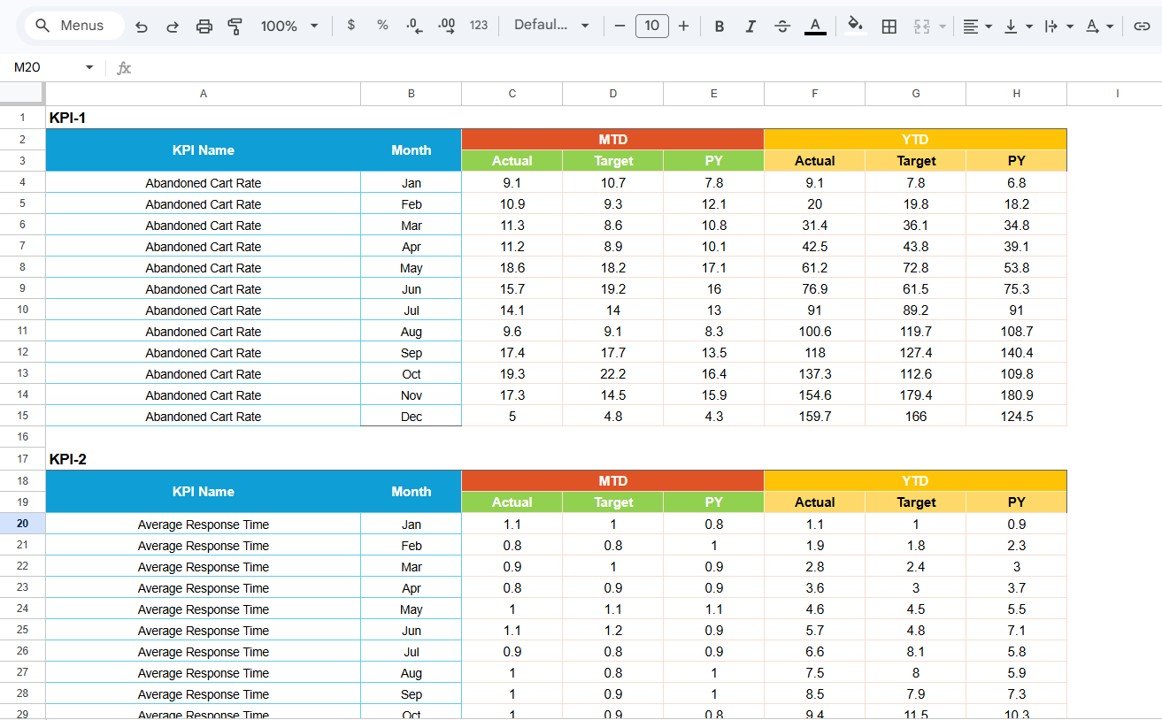
3. Input Data Sheet
The Input Data sheet is where you enter all KPI data. Record actual values, targets, and other metrics for each KPI. The sheet offers flexibility to update data as new results become available, ensuring the scorecard remains current and accurate throughout the reporting period.
 Input Data Sheet
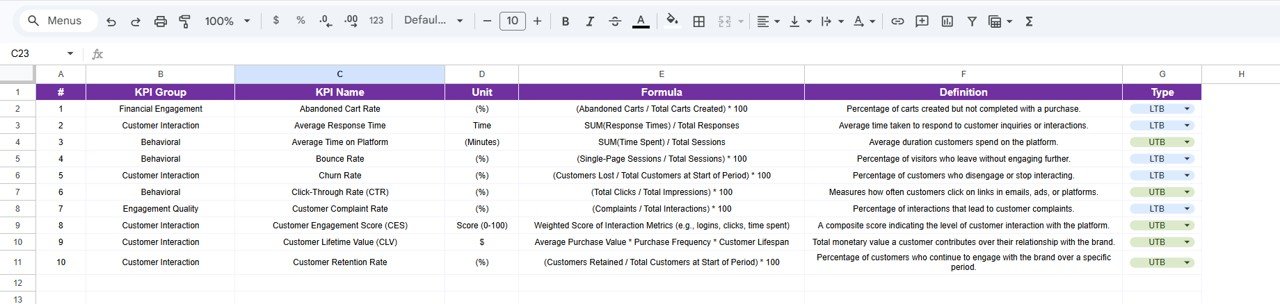
4. KPI Definition Sheet
In this sheet tab, enter the KPI Name, KPI Group, Unit, Formula, and KPI Definition for each metric. Specifying whether each KPI is Lower the Better (LTB) or Upper the Better (UTB) ensures the scorecard applies the correct conditional logic for performance evaluation. This governance layer keeps your entire team aligned on how each metric is calculated and interpreted.
 KPI Definition Sheet
Customer Engagement KPI Scorecard in Google Sheets vs. Excel Scorecard vs. HubSpot Service Hub — Feature Comparison
| Feature | Customer Engagement KPI Scorecard in Google Sheets | Excel KPI Scorecard | HubSpot Service Hub |
|---|---|---|---|
| Cost | $8.99 one-time | $12.99 one-time | $450+ / month (Professional) |
| Platform | Google Sheets (cloud) | Microsoft Excel (desktop) | Cloud SaaS |
| Setup time | Under 10 minutes | Under 10 minutes | 2-4 weeks |
| Real-time team collaboration | ✅ Built-in | ❌ File sharing needed | ✅ Built-in |
| Mobile access | ✅ Google Sheets app | Limited | ✅ Mobile app |
| MTD / YTD toggle | ✅ One-click switch | ✅ One-click switch | Custom reports |
| Customizable KPIs | ✅ Edit definition sheet | ✅ Edit cells | ✅ With setup |
| Share with link | ✅ Google Drive sharing | ❌ Email attachment | ✅ Built-in |
| Year-1 cost at 5 users | $8.99 total | $12.99 total | $5,400+ |
For customer success teams that want structured KPI tracking without paying $450/month for HubSpot, the Customer Engagement KPI Scorecard in Google Sheets sits in the sweet spot.
Who Should Use This Template
Perfect for:
- Customer success managers at small-to-medium businesses tracking engagement metrics monthly
- Support team leads monitoring CSAT, NPS, and first contact resolution across reporting periods
- Marketing teams measuring customer retention rate, repeat purchase patterns, and engagement rate
- Startup founders tracking CLV, churn rate, and engagement rate without a CRM subscription
- Freelance consultants delivering structured KPI reports to clients
Not a fit if:
- You need real-time API integration with CRM platforms like Salesforce, Zendesk, or Intercom
- Your organization requires automated data refresh from live customer databases
- You need role-based access controls, SSO, and SOC 2 compliance for enterprise governance
Real-World Use Cases
🛍️ Click here to Purchase Customer Engagement KPI Scorecard in Google Sheets
Anita manages customer success at a 60-person B2B SaaS company. She uses the Customer Engagement KPI Scorecard in Google Sheets to track NPS, CSAT, and churn rate across quarterly reviews. The MTD/YTD toggle lets her show the leadership team both monthly snapshots and cumulative trends — replacing the $450/month HubSpot Service Hub they were considering. She pairs this with the Customer Journey Mapping KPI Dashboard in Google Sheets for funnel-level analysis.
David runs a 15-person e-commerce support team. He tracks first contact resolution rate, average response time, and support ticket volume monthly using this scorecard. The conditional formatting instantly flags metrics that drop below target, and he shares the Google Sheets link with his director for transparent reporting — no expensive helpdesk analytics add-on needed.
Priya is a freelance customer experience consultant. She uses the Customer Engagement KPI Scorecard for client engagements, entering each client’s engagement data and presenting the trend charts during monthly strategy calls. The KPI Definition sheet ensures both she and her clients agree on how each metric is calculated. She also uses the Customer Experience & Service Quality Dashboard in Google Sheets for deeper service quality analysis.
Advantages of Customer Engagement KPI Scorecard in Google Sheets
The primary advantage is cost efficiency — at $8.99 one-time versus $450+/month for HubSpot Service Hub, a 5-person team saves over $5,391 in the first year alone. The cloud-based Google Sheets platform means anyone on your team can access the scorecard from any device with a browser, with real-time collaboration built in.
The MTD/YTD toggle and previous year comparison give you three dimensions of analysis from a single dropdown, which most paid tools require custom report builders to achieve. The conditional formatting with traffic light indicators means you can identify underperforming KPIs in seconds without reading through data tables. And because the KPI Definition sheet enforces standardized metric definitions, your team avoids the common pitfall of different departments calculating the same KPI differently.
Opportunities for Improvement
🛍️ Click here to Purchase Customer Engagement KPI Scorecard in Google Sheets
This scorecard uses manual data entry rather than automated data feeds. If your team needs real-time data sync from CRM platforms like Salesforce or Zendesk, you would need to export data periodically and paste it into the Input Data sheet. The template does not include automated email alerts when KPIs drop below thresholds — monitoring is visual only. For teams larger than 50 users who need audit trails and role-based permissions, a dedicated SaaS tool would be more appropriate. That said, for teams of 1-50 people who update engagement data monthly or weekly, the manual workflow takes under 10 minutes and the cost savings are significant.
Best Practices
Update the scorecard at the same cadence as your reporting cycle — weekly for fast-moving support teams, monthly for strategic engagement tracking. Always fill in the KPI Definition sheet first before entering data to ensure every team member interprets metrics the same way. Use the KPI Trend sheet during monthly reviews rather than just the Scorecard sheet — trends reveal patterns that single-month snapshots miss. Share the Google Sheets link with view-only access for stakeholders who need visibility but shouldn’t edit the data. According to Google’s sharing documentation, you can set granular permissions to control who can edit versus view.
Explore Relevant Templates
📊 Customer Engagement KPI Scorecard in Google Sheets — The product featured in this article. Track 10+ engagement KPIs with MTD/YTD toggles and trend charts.
📊 Customer Onboarding Effectiveness Dashboard in Google Sheets — Track onboarding funnels, time-to-value, and activation metrics for new customers.
📊 Customer Journey Mapping KPI Dashboard in Google Sheets — Visualize customer touchpoints and journey-stage metrics with interactive charts.
📊 Customer Experience & Service Quality Dashboard in Google Sheets — Monitor service quality KPIs including CSAT, response time, and resolution rates.
📊 Onboarding Experience KPI Dashboard in Google Sheets — Dedicated onboarding experience analytics with NPS and completion tracking.
Browse all Google Sheets Dashboard Templates for more analytics solutions.
Frequently Asked Questions
🛍️ Click here to Purchase Customer Engagement KPI Scorecard in Google Sheets
What KPIs does the Customer Engagement KPI Scorecard in Google Sheets track?
The Customer Engagement KPI Scorecard in Google Sheets tracks 10+ metrics including CSAT, NPS, Customer Retention Rate, Churn Rate, Average Response Time, First Contact Resolution Rate, CLV, Repeat Purchase Rate, Engagement Rate, and Support Ticket Volume. All metrics update automatically when you enter your data in the Input Data sheet.
How does this compare to using HubSpot for customer engagement tracking?
HubSpot Service Hub Professional costs $450+ per month and requires weeks of onboarding. The Customer Engagement KPI Scorecard in Google Sheets costs $8.99 one-time, works in any browser in under 10 minutes, and tracks the same core engagement KPIs with conditional formatting and trend charts. For teams that need structured KPI reporting without a SaaS subscription, this template delivers equivalent visibility at a fraction of the cost.
Can I customize the KPIs in this Google Sheets scorecard?
Yes. All KPIs are defined in the KPI Definition sheet where you can modify names, groups, units, formulas, and descriptions. The Input Data sheet accepts your actual numbers and targets. No coding or advanced Google Sheets skills are required to customize the scorecard to your business.
Does the scorecard support team collaboration?
Yes. Since this is built in Google Sheets, you can share the file via Google Drive link with your entire team. Multiple users can view and edit simultaneously with real-time updates — a key advantage over desktop-only Excel scorecards.
How long does it take to set up this customer engagement scorecard?
Setup takes under 10 minutes. Open the PDF guide, click the Google Sheets copy link, enter your KPI definitions and data in the input sheets, and the Scorecard and KPI Trend sheets populate automatically with your engagement metrics, trend charts, and visual indicators.
Can I track both MTD and YTD performance in this scorecard?
Yes. The Scorecard sheet displays both Month-to-Date and Year-to-Date comparisons for every KPI. You can toggle between MTD and YTD views, compare actuals against targets, and benchmark against previous year figures — all from a single dropdown selector.
What is the best Google Sheets template for tracking customer engagement KPIs?
The Customer Engagement KPI Scorecard in Google Sheets from NextGenTemplates is one of the best options available. It includes 4 dedicated worksheets covering Scorecard, KPI Trend, Input Data, and KPI Definition — all with conditional formatting, trend charts, and MTD/YTD comparison for structured customer engagement tracking.
About the Author
Built by PK — Microsoft Certified Professional with 15+ years of Excel, Google Sheets, and Power BI experience. Founder of NextGenTemplates, reaching 300K+ subscribers across YouTube channels. Every template is hand-built and tested before release.
Conclusion
The Customer Engagement KPI Scorecard in Google Sheets gives customer success teams, support managers, and business analysts a structured, cloud-based scorecard for tracking engagement metrics without paying for expensive SaaS subscriptions. With 10+ KPIs, MTD/YTD toggles, conditional formatting, and trend charts across 4 worksheets, it replaces manual reporting with a professional scorecard that updates in minutes.
🛍️ Click here to Purchase Customer Engagement KPI Scorecard in Google Sheets
✅ Instant download · One-time payment · No subscription