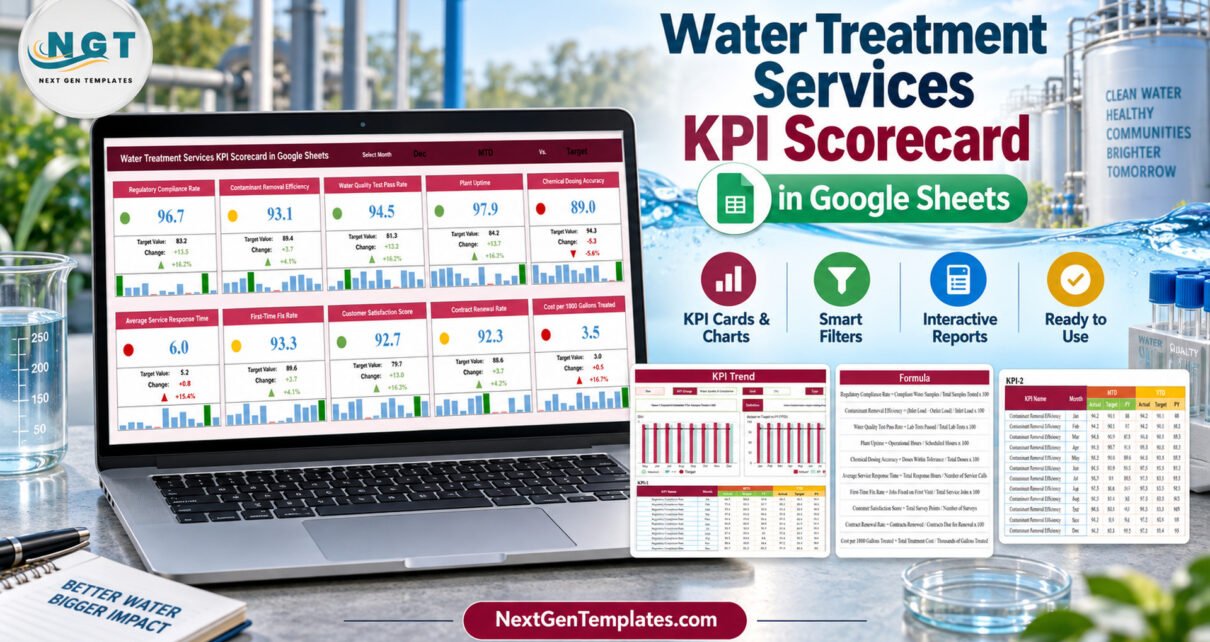
The Water Treatment Services KPI Scorecard in Google Sheets puts 10 water treatment KPIs from five groups on one page: three water quality and compliance measures, two plant operations measures, two service and response measures, two customer and contract measures and one financial measure. Every KPI gets a traffic-light card with a 12-month mini chart, a second page trends one KPI at a time against Target and prior year, and the sample file carries 120 monthly records. Eight KPIs are upper-the-better and two are lower-the-better, and the lights respect that direction.
Water treatment service companies watch sample results, plant uptime, dosing accuracy, technician response, contract renewals and treatment cost, usually in separate logs that never meet at month end. This scorecard gives an owner or operations manager one shared Google Sheets file where those numbers sit side by side, with a month picker and switches for MTD/YTD and Target/PY. It belongs to the KPI Scorecard family, not the KPI Dashboard line, and it is a reporting sheet rather than a work order, lab or compliance system. This guide explains exactly what it does, including four issues we found while testing the current build.
Get the Water Treatment Services KPI Scorecard in Google Sheets
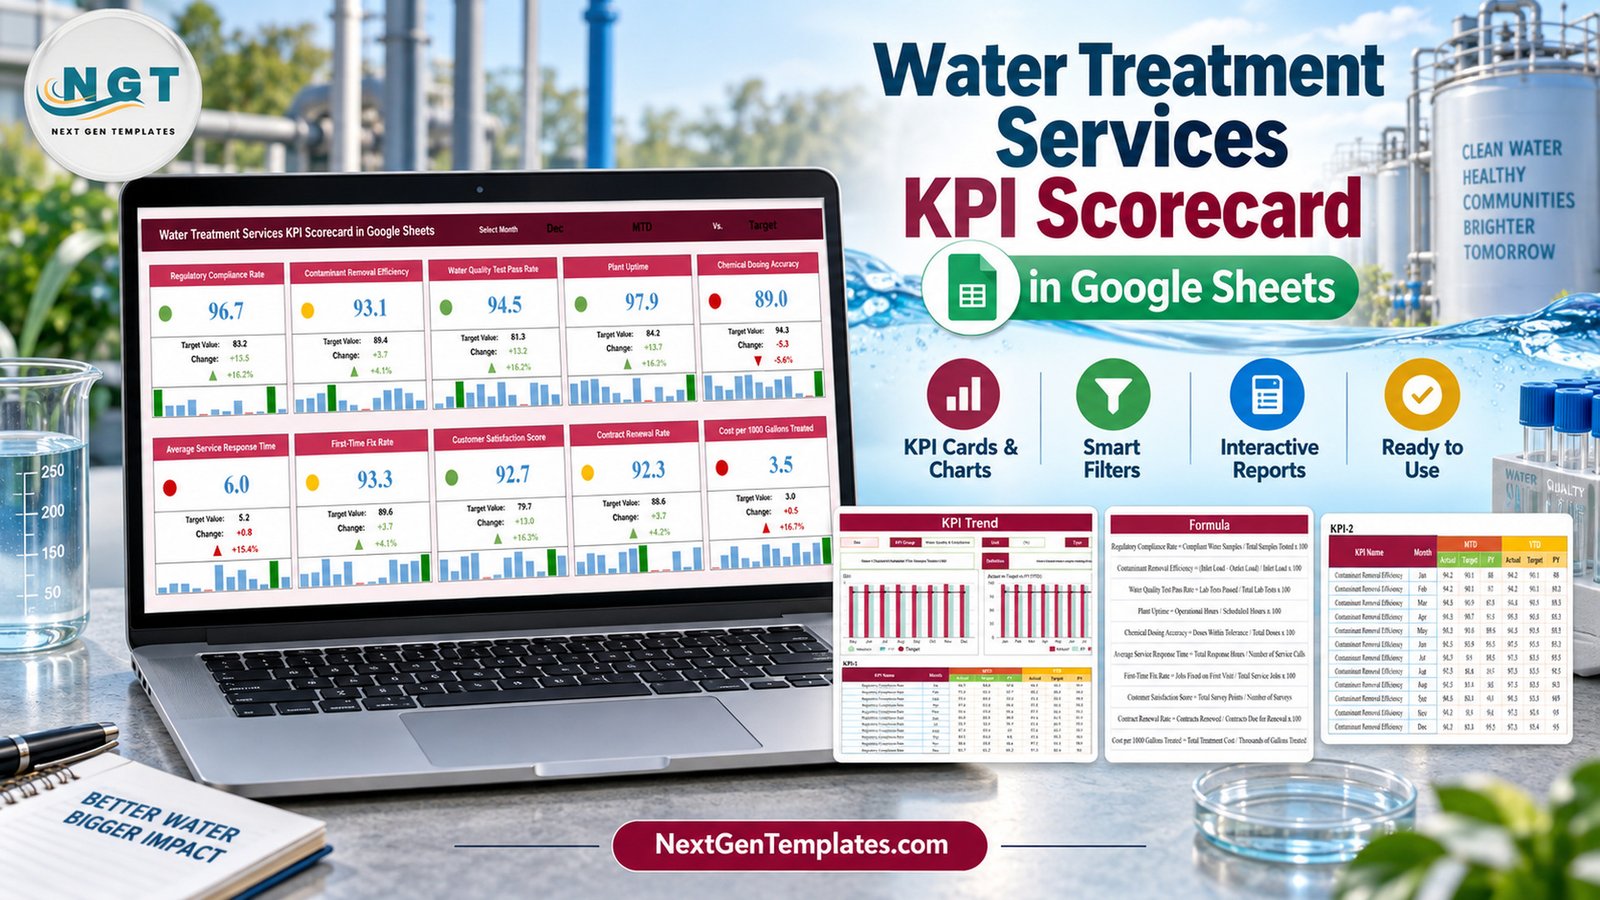
Key Features of the Water Treatment Services KPI Scorecard
- Three selectors on the Scorecard: Month (Jan to Dec), MTD or YTD, and a comparison against Target or PY. All 10 cards recalculate from the Input Data sheet with SUMIFS formulas, with no scripts or add-ons.
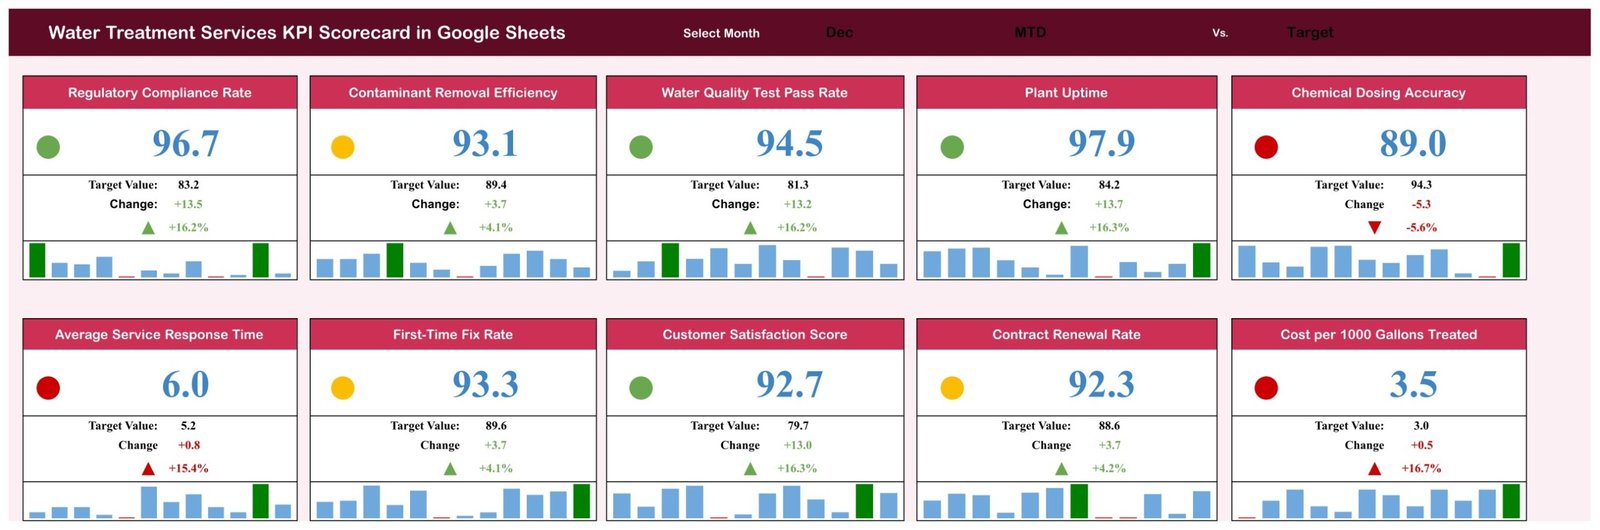
- Direction-aware traffic lights: for an upper-the-better (UTB) KPI, a result at or below the comparison value is red, up to 10% above is amber and more than 10% above is green. Lower-the-better (LTB) KPIs use the mirror rule.
- Complete cards: each card shows the value, the Target or PY value, the absolute change, the change %, an arrow and a 12-month mini column chart with the selected month highlighted.
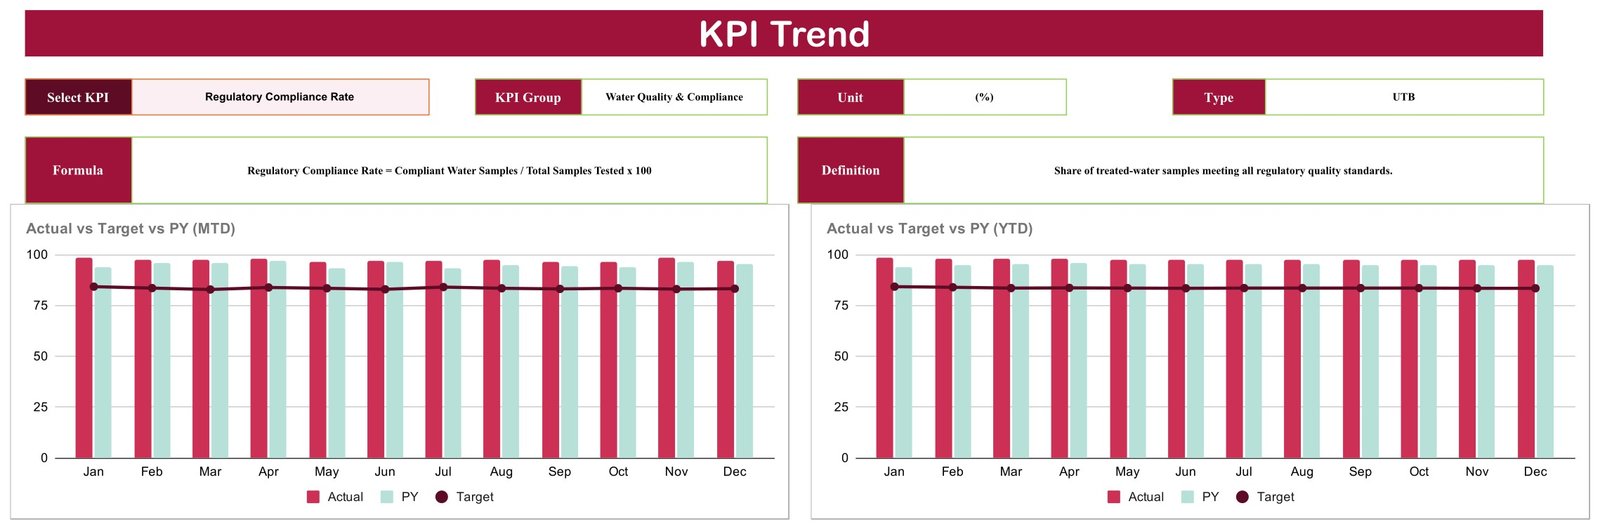
- KPI Trend page: choose one KPI to see its group, unit, type, formula and definition, plus Actual vs Target vs PY charts by month for MTD and for YTD.
- Documented metrics: the KPI Definition sheet lists a unit, formula, definition and UTB/LTB type for each KPI.
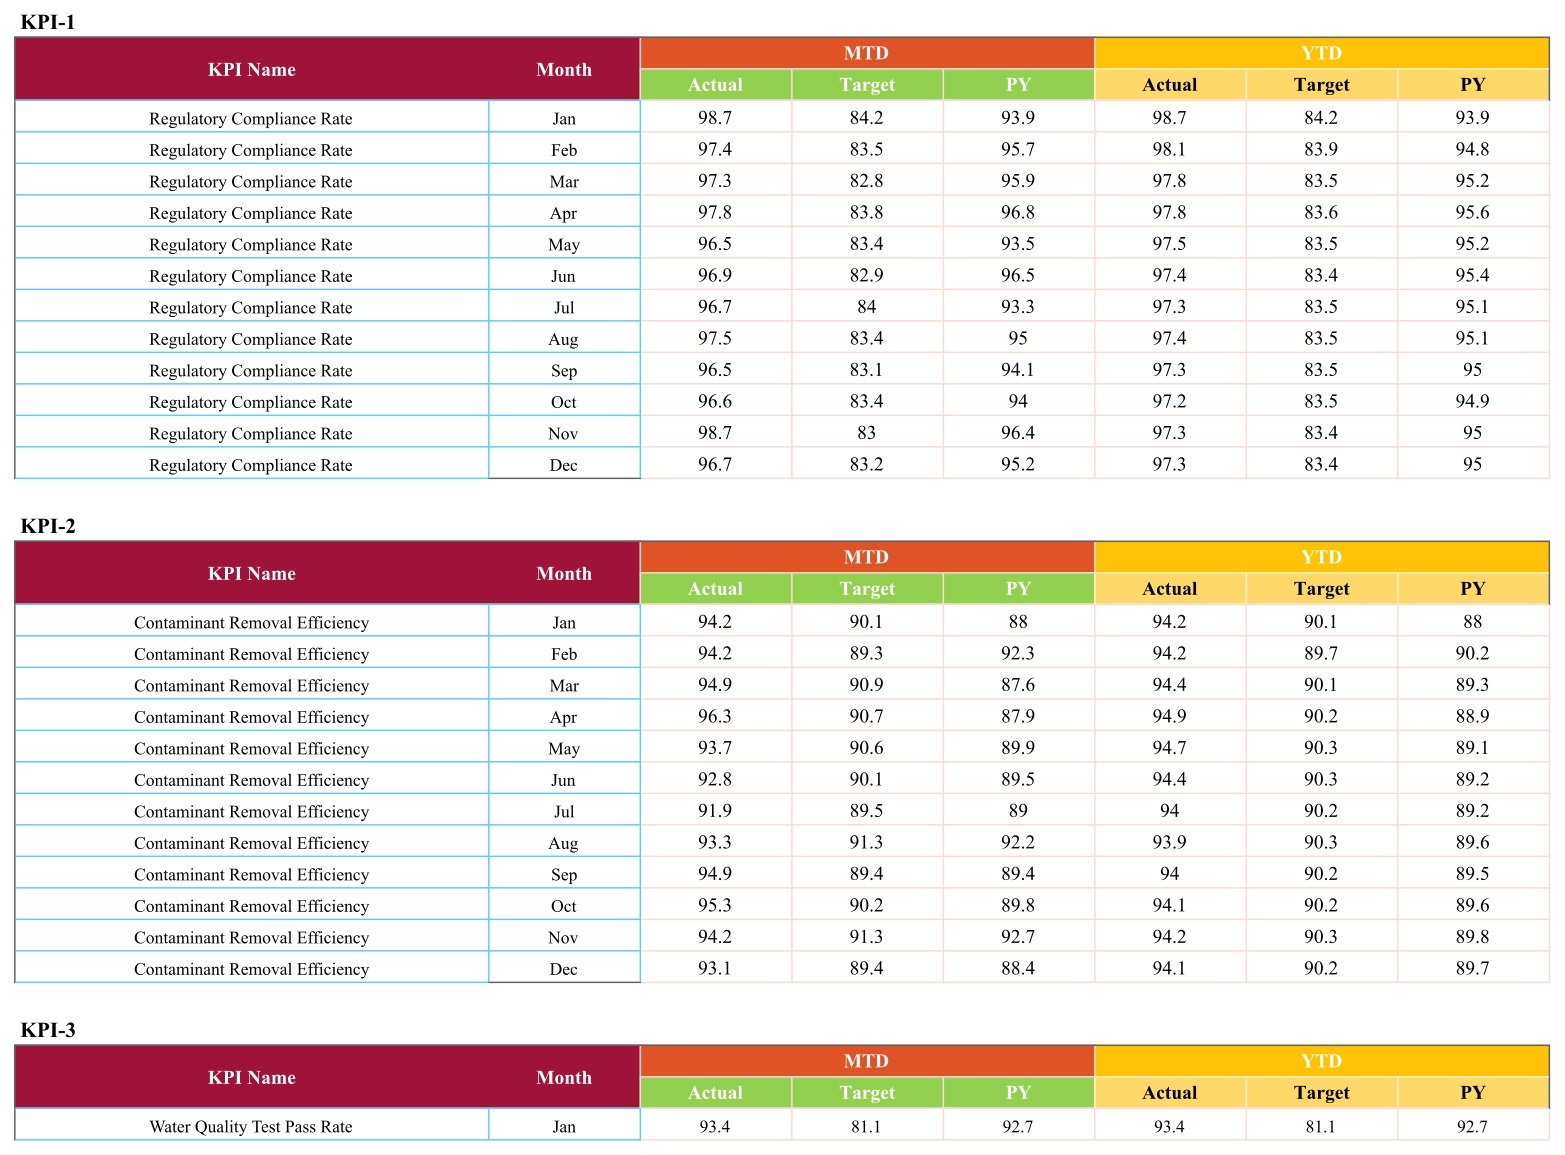
- Plain monthly input: Input Data stores MTD and YTD Actual, Target and PY for 12 months per KPI. YTD is typed, not calculated.
The 10 KPIs
- Water Quality & Compliance: Regulatory Compliance Rate (%), Contaminant Removal Efficiency (%), Water Quality Test Pass Rate (%)
- Plant Operations: Plant Uptime (%), Chemical Dosing Accuracy (%)
- Service & Response: Average Service Response Time (hrs, LTB), First-Time Fix Rate (%)
- Customers & Contracts: Customer Satisfaction Score (pts), Contract Renewal Rate (%)
- Financial: Cost per 1000 Gallons Treated ($, LTB)
The three quality and compliance KPIs are percentages you type in from your own sample and lab results. The sheet does not test water, store lab reports or demonstrate compliance with any drinking-water or discharge regulation.
Scorecard Pages Explanation
Page 1: Scorecard
The main page holds 10 cards in two rows of five under a header with the Month, MTD/YTD and Target/PY selectors. With December, MTD and Target selected, the sample reads 4 green, 3 amber and 3 red. Regulatory Compliance Rate shows 96.7 against an 83.2 target (green, up 16.2%), Contaminant Removal Efficiency shows 93.1 against 89.4 (amber, up 4.1%), Chemical Dosing Accuracy shows 89.0 against 94.3 (red, down 5.6%) and Average Service Response Time shows 6.0 hours against 5.2 (red, up 15.4%, where lower is better).
Page 2: KPI Trend
Select a KPI and the page fills in KPI Group, Unit, Type, Formula and Definition, then plots Actual vs Target vs PY (MTD) by Month and Actual vs Target vs PY (YTD) by Month for all 12 months, with Actual and PY as columns and Target as a line. The sample shows Regulatory Compliance Rate, a Water Quality & Compliance KPI measured in percent, where each monthly actual sits between about 96 and 99 against a target near 83.
Page 3: KPI Definition
A table of the 10 KPIs with #, KPI Group, KPI Name, Unit, Formula, Definition and Type. For example, Plant Uptime = Operational Hours / Scheduled Hours x 100, and First-Time Fix Rate = Jobs Fixed on First Visit / Total Service Jobs x 100.

Page 4: Input Data
Ten blocks labelled KPI-1 to KPI-10, each with 12 monthly rows and six figures per row: MTD Actual, Target and PY, then YTD Actual, Target and PY. This is the only sheet you update each month.
Behind these pages sit a Read Me tab, a Color Settings tab and two helper tabs, Support and Trend_Support, which do the lookups for the cards and charts.
Google Sheets Scorecard vs. Excel Workbook vs. Operations Software: Feature Comparison
| Feature | Water Treatment Services KPI Scorecard (Google Sheets) | Excel KPI scorecard workbook | Field service or plant operations software |
|---|---|---|---|
| Cost | ✅ $8.99 one-time | One-time, plus an Excel licence | Usually a monthly subscription, often per user |
| Platform | ✅ Any browser with a Google account | Desktop Excel | Vendor web and mobile apps |
| Setup time | ✅ Under an hour of data entry | Similar | Days to weeks of onboarding |
| Real-time team collaboration | ✅ Google Sheets sharing | Limited without OneDrive | ✅ Built in |
| Mobile access | View in the Google Sheets app | Excel mobile app | ✅ Native technician apps |
| Customizable KPIs | ✅ Rename KPIs and edit definitions | ✅ Yes | Fixed report set |
| Work orders, sensor data and lab records | ❌ Not included | ❌ Not included | ✅ Core feature |
| Monthly traffic-light KPI cards | ✅ 10 cards with trend charts | Depends on the workbook | Usually custom reports |
| Year-1 cost at 5 users | ✅ $8.99 | Price plus Microsoft 365 seats | Hundreds to thousands of dollars |
For water treatment service owners who want one monthly view of plant uptime, service response, renewals and treatment cost without paying for an operations platform, this scorecard sits in the sweet spot.
Who Should Use This Template
Perfect for:
- Owners of water treatment service companies that install, run and maintain treatment systems for clients
- Operations and service managers who prepare a month-end or quarterly KPI review
- Bookkeepers and consultants who report performance to water treatment clients
Not a fit if:
- You need work orders, dispatch, SCADA or sensor data
- You need a lab information system, a compliance record or reports for a regulator
- You want figures to flow in automatically from field service or accounting software
Real-World Use Cases
Elena owns a water treatment service firm with six technicians. At month end she types in service calls, response hours, first-visit fixes and survey scores. Average Service Response Time and First-Time Fix Rate show her when the team is stretched, and the KPI Trend page tells her whether an extra on-call shift actually held its gains over the following months.
Rahul manages operations for a company running treatment units on client sites. For the owner’s quarterly review he switches the Scorecard to YTD against PY. Plant Uptime, Chemical Dosing Accuracy and Cost per 1000 Gallons Treated show whether the units are running well and economically, and the red cards set the meeting agenda.
Grace is a bookkeeper with two water treatment clients. She keeps one copy per client, shares each view-only and walks the owner through Contract Renewal Rate and Customer Satisfaction Score, the two measures that usually explain next year’s recurring revenue.
Advantages of the Water Treatment Scorecard
- One page for the monthly review: 10 KPIs, their targets and their direction on a single screen instead of five separate logs.
- Low cost: $8.99 once, shared with the whole office through Google Drive, with no per-user fee.
- Honest lights: lower-the-better KPIs such as Average Service Response Time turn red when they rise, and all ten change-colour rules are correct in this build.
- Readable definitions: every formula is written out on KPI Definition, so staff and advisers argue about performance rather than about what a number means.
- Nothing to install: plain formulas and named ranges, no Apps Script permissions or add-ons.
Opportunities for Improvement
We export and test each live sheet before listing it. These four issues are present in the current build:
- June and July blank all ten cards. The month dropdown in Scorecard cell N1 lists “June” and “July”, while Input Data stores “Jun” and “Jul”. The Support tab matches the month by exact text, so those two months return nothing. One-minute fix: select Scorecard cell N1, open Data > Data validation, change June to Jun and July to Jul in the list, click Done and choose Jun again.
- The Read Me tab is empty. Follow the steps in this guide and the PDF in your download instead.
- Color Settings is not connected to anything. It displays a red, amber and green table, but no formula reads it. The bands actually used are typed into the Support tab, cells Z4:Z6 for UTB KPIs and AD4:AD6 for LTB KPIs, so edit those cells to change the 0% and 10% thresholds.
- The selector text is hard to read. The Month, MTD/YTD and Target/PY values in cells N1, Q1 and V1 are black on the dark maroon header. Select the three cells and set the text colour to white.
Beyond those, YTD values are typed rather than calculated from the monthly rows, the sheet holds one year at a time, and there is no automatic import. All figures shipped in the file are fictional sample data.
Best Practices
- Apply the June/July dropdown fix and the selector colour change the moment you make your copy, before you share it.
- Agree the definitions on KPI Definition with your technicians and plant staff before entering a single number.
- Take quality percentages from your own lab and sampling records; the scorecard only summarises what you enter.
- Review red LTB cards first; response time and treatment cost move client satisfaction and margin fastest.
- Keep last year’s copy and start a fresh one each year, so PY figures stay traceable.
- Learn the formula pattern with Google’s SUMIFS function guide and its guide to dropdown lists and data validation.
Explore Relevant Templates
Other water-service scorecards built on the same pattern include the Swimming Pool Service KPI Scorecard in Google Sheets and the Septic Tank Service KPI Scorecard in Google Sheets. For a public-sector take on the same card layout, read the Public Health KPI Scorecard in Google Sheets guide.
Working on the utility side instead? The Water Supply KPI Scorecard in Excel is a different build with its own utility KPIs. On the store, browse the full range of Google Sheets KPI templates. Excel editions of a water treatment services KPI scorecard and KPI dashboard are being prepared as separate builds.
If you want to build KPI reports like this yourself, the Excel Pivot Tables & Dashboards course on NextGenTemplates Academy walks you through the skills step by step, with practice files.
Get the Water Treatment Services KPI Scorecard in Google Sheets
Frequently Asked Questions
What does the water treatment services scorecard measure?
The Water Treatment Services KPI Scorecard in Google Sheets measures 10 KPIs across water quality and compliance, plant operations, service and response, customers and contracts, and finance, including Plant Uptime, Chemical Dosing Accuracy, First-Time Fix Rate, Contract Renewal Rate and Cost per 1000 Gallons Treated, each against Target or prior year.
Is this the same as a water treatment KPI dashboard?
No. This is the KPI Scorecard family: one page of 10 traffic-light cards with a month picker, a KPI Trend page, KPI Definition and Input Data. The KPI Dashboard line is a separate build with more analysis pages, so treat the two as different products.
Does the scorecard prove regulatory compliance?
No. Regulatory Compliance Rate and Water Quality Test Pass Rate are percentages you type in. The sheet performs no testing, keeps no lab certificates and makes no claim about compliance with drinking-water, discharge or any other regulation.
How long does setup take?
Making your copy takes a minute and the two small fixes another two. Entering twelve months for 10 KPIs means 120 rows of figures, which most owners complete in under an hour from existing reports.
Can I change the traffic-light thresholds?
Yes, in the Support tab, not in Color Settings. In this build no formula reads Color Settings. Edit Support cells Z4:Z6 for upper-the-better KPIs and AD4:AD6 for lower-the-better KPIs; the current bands are 0% and 10% either side of the comparison.
Is the sample data real?
No. The sample figures are fictional and exist only to show how the cards and charts behave. Replace them with your own monthly numbers.
About the Author
Built by PK, Microsoft Certified Professional with 15+ years of Excel, Google Sheets and Power BI experience, and founder of NextGenTemplates. Tutorials run on YouTube across @PKAnExcelExpert, @NextGenTemplates and @NeoTechNavigators. Every template is built and tested before release, and the issues listed above come from that testing.
Conclusion
The Water Treatment Services KPI Scorecard in Google Sheets gives a water treatment service owner a single monthly page for quality results, plant uptime, dosing, response, renewals and treatment cost, with lights that understand which direction is good. Apply the one-minute June/July fix, make the selector text white, adjust the Support bands if you need to, and it is ready for your next month-end review.
✅ Instant download · One-time payment · No subscription
Last updated: September 2026