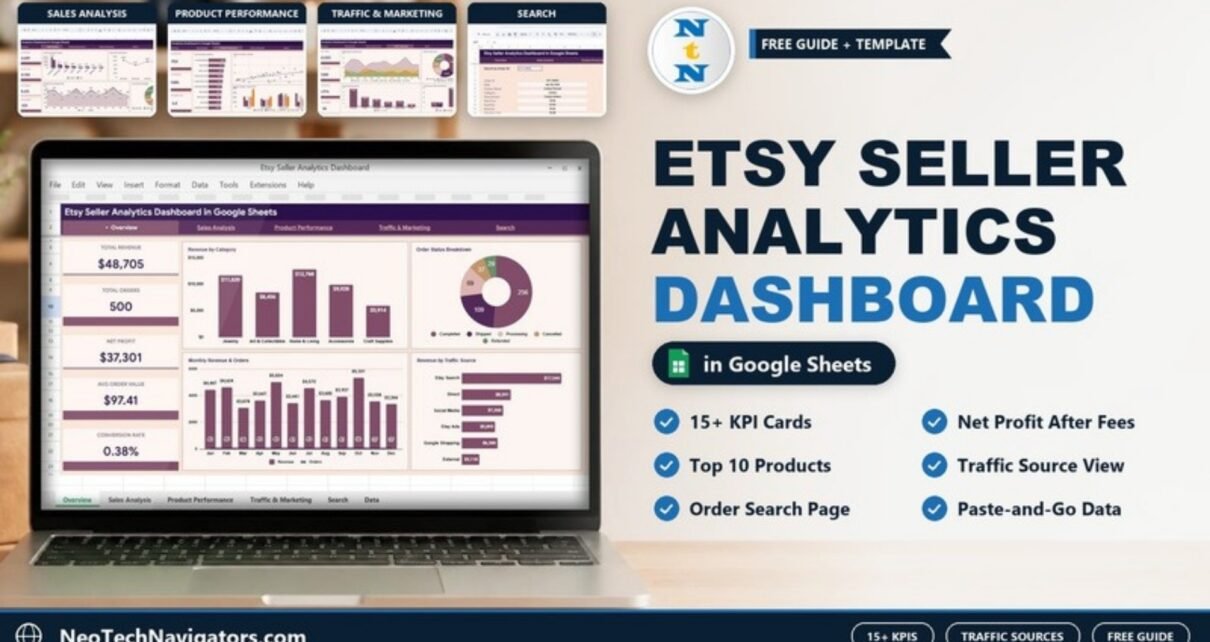
Etsy’s own Stats page tells you about visits and orders, but not how much you kept after Etsy fees, shipping and other costs. The Etsy Seller Analytics Dashboard in Google Sheets brings revenue, net profit, product performance and traffic sources into one workbook, so you can see which listings and channels actually make money.
It is built for Etsy shop owners selling handmade goods, vintage items or digital downloads who want a clear weekly or monthly view without learning a BI tool. Below you will find what each of the six tabs shows, the KPIs with the formulas behind them, a worked example from the sample data, setup steps, use cases and honest limitations.
🎥 Watch the Video Tutorial
Get the Etsy Seller Analytics Dashboard
What the Etsy Seller Dashboard Helps You Answer
- What is my net profit, and what share of revenue do I keep?
- Which categories, shop sections and products earn the most?
- Which countries buy most, and how much profit do they leave after costs?
- Which traffic sources (Etsy Search, Direct, Social Media, Etsy Ads, Google Shopping, External) bring orders, not just views?
- Do coupons increase orders, or just lower the average revenue per order?
The Six Tabs at a Glance
| Tab | KPI cards | Charts |
|---|---|---|
| Overview | Total Revenue, Total Orders, Net Profit, Avg Order Value, Conversion Rate | Revenue by Category, Order Status Breakdown, Monthly Revenue & Orders, Revenue by Traffic Source |
| Sales Analysis | Total Shipping, Total Etsy Fees, Profit Margin, Coupon Orders | Revenue & Profit by Country, Revenue by Shop Section, Monthly Fees & Shipping Costs, Shop Section Distribution |
| Product Performance | Total Items Sold, Total Favorites, Avg Processing Days | Top 10 Products by Revenue, Views vs Favorites Correlation, Revenue: Category × Shop Section |
| Traffic & Marketing | Total Views, Total Favorites, Fav/View Ratio, Etsy Ads Orders | Monthly Orders by Traffic Source, Views by Traffic Source, Views & Favorites by Source, Coupon Impact: Orders & Avg Revenue |
| Search | Pick an Order ID from a dropdown to see all 18 fields for that order | |
| Data | Where you paste your order data in the sample’s 18-column format | |
A navigation bar across the top of every page links to Overview, Sales Analysis, Product Performance, Traffic & Marketing, Search and Data. According to the product page, slicers also let you filter the dashboard by fields such as category, country, traffic source and shop section.
Overview
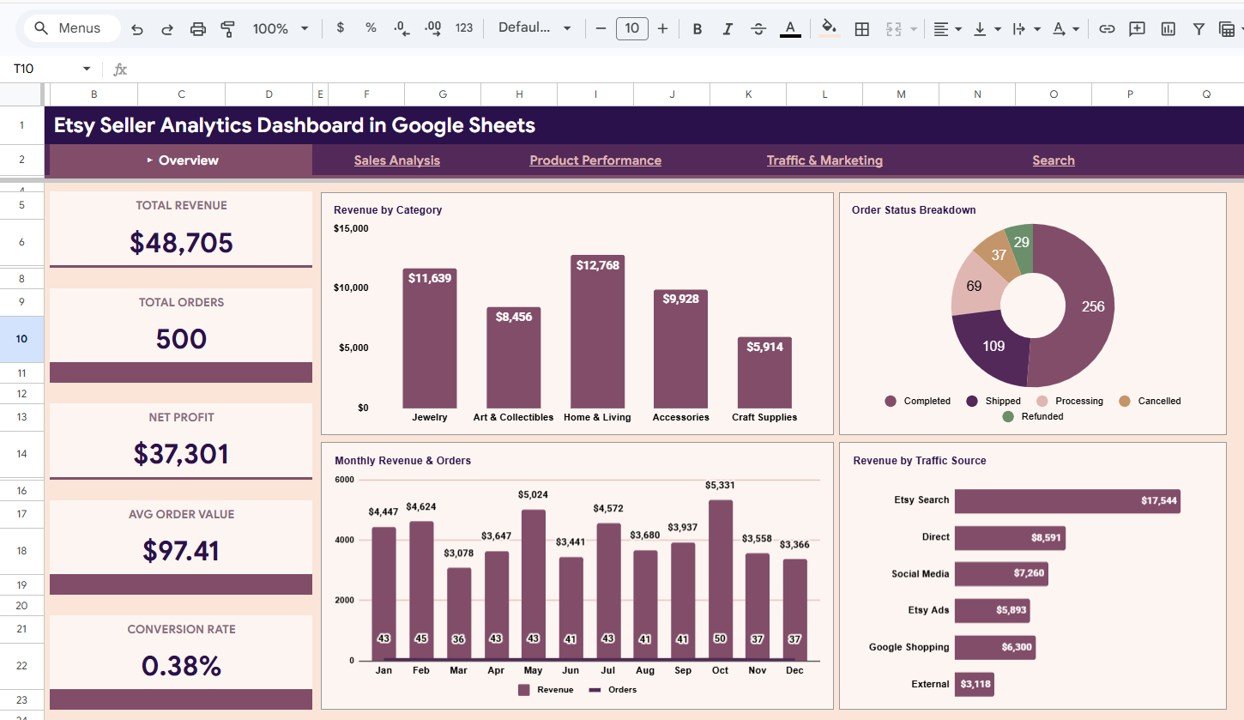
The landing page. Five cards give the headline numbers; with the 500 sample orders they show Total Revenue $48,705, Net Profit $37,301, Avg Order Value $97.41 and Conversion Rate 0.38%. Four charts show revenue by category (Jewelry, Art & Collectibles, Home & Living, Accessories, Craft Supplies), the split of orders by status (Completed, Shipped, Processing, Cancelled, Refunded), monthly revenue and orders, and revenue by traffic source.
Sales Analysis
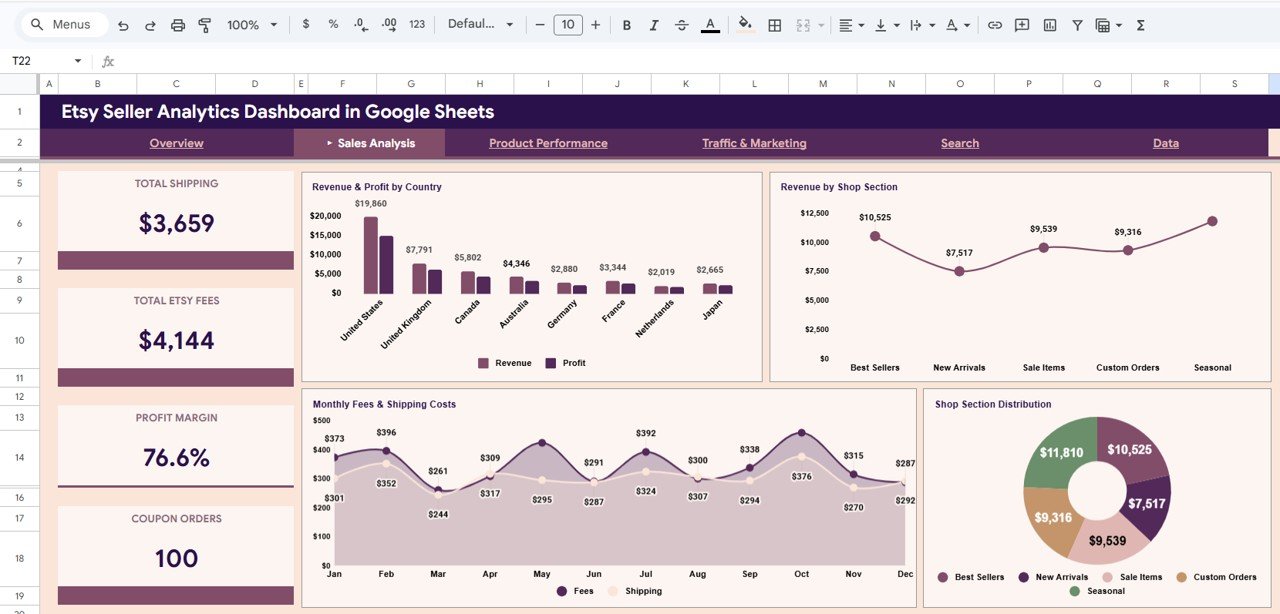
This is the cost and profit page. It separates Total Shipping ($3,659) and Total Etsy Fees ($4,144), shows Profit Margin (76.6%) and Coupon Orders (100), and compares revenue and profit by buyer country and by shop section (Best Sellers, New Arrivals, Sale Items, Custom Orders, Seasonal). A country with strong revenue but thin profit is often a shipping-price problem.
Product Performance
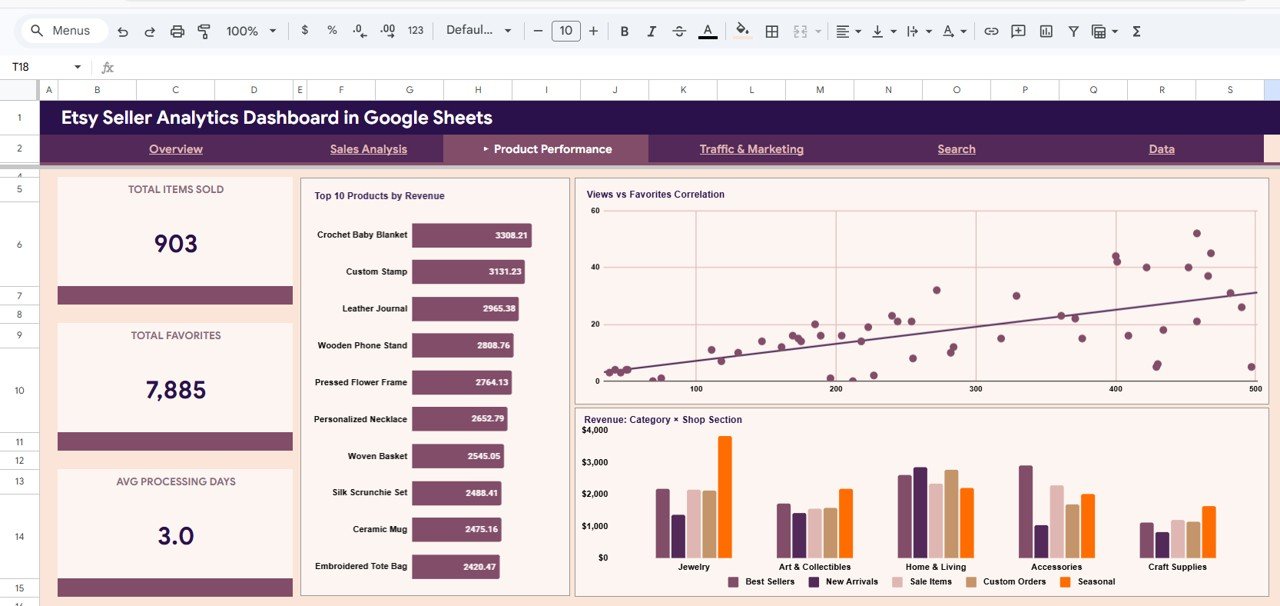
Find your top 10 listings by revenue and compare views with favorites to see which products attract attention but do not convert. Average processing days (3.0 in the sample) helps you keep dispatch times in line with what your listings promise, and the Category × Shop Section chart shows which section sells best inside each category.
Traffic & Marketing
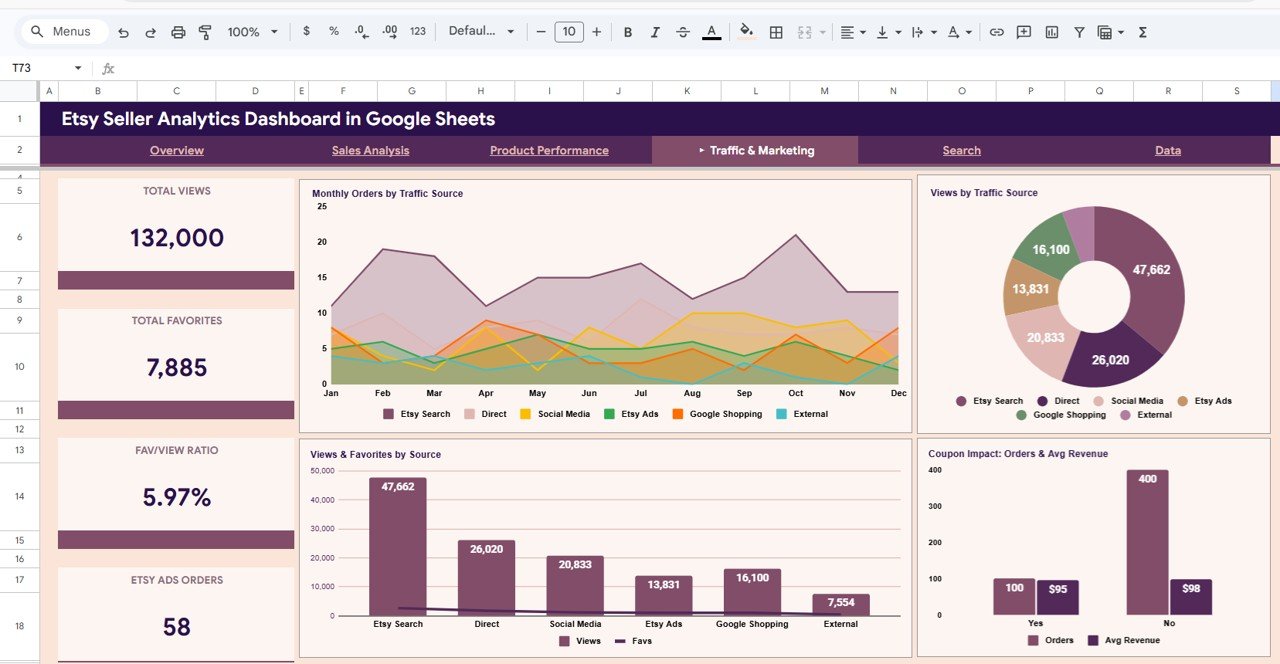
Compares traffic sources by views, favorites and orders, counts orders from Etsy Ads (58 in the sample), and shows how coupon orders compare with full-price orders: 100 coupon orders averaging $95 against 400 non-coupon orders averaging $98.
Search
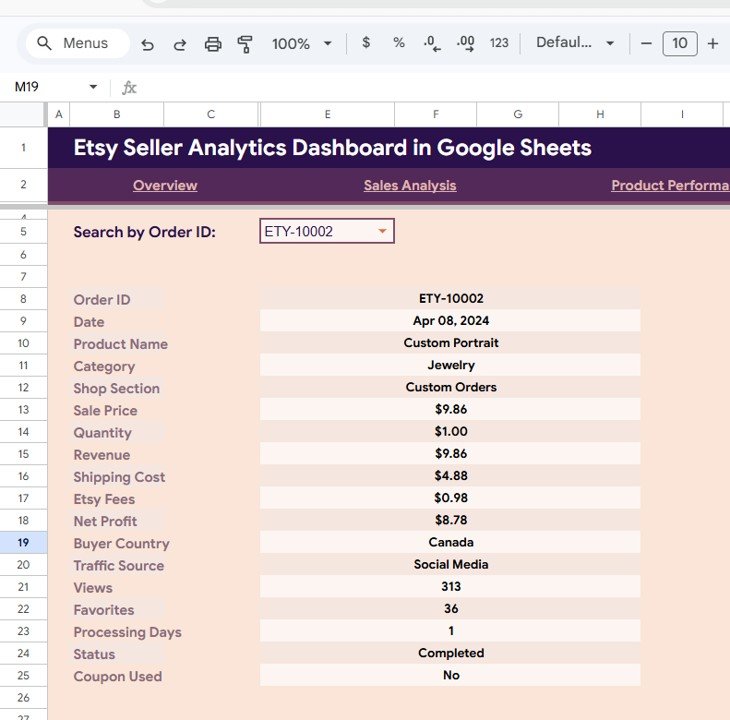
Select an Order ID in Search by Order ID and see every field for it: order ID, date, product name, category, shop section, sale price, quantity, revenue, shipping cost, Etsy fees, net profit, buyer country, traffic source, views, favorites, processing days, status and coupon used. Useful when a buyer asks about an order or you want to check one sale’s profit.
Data
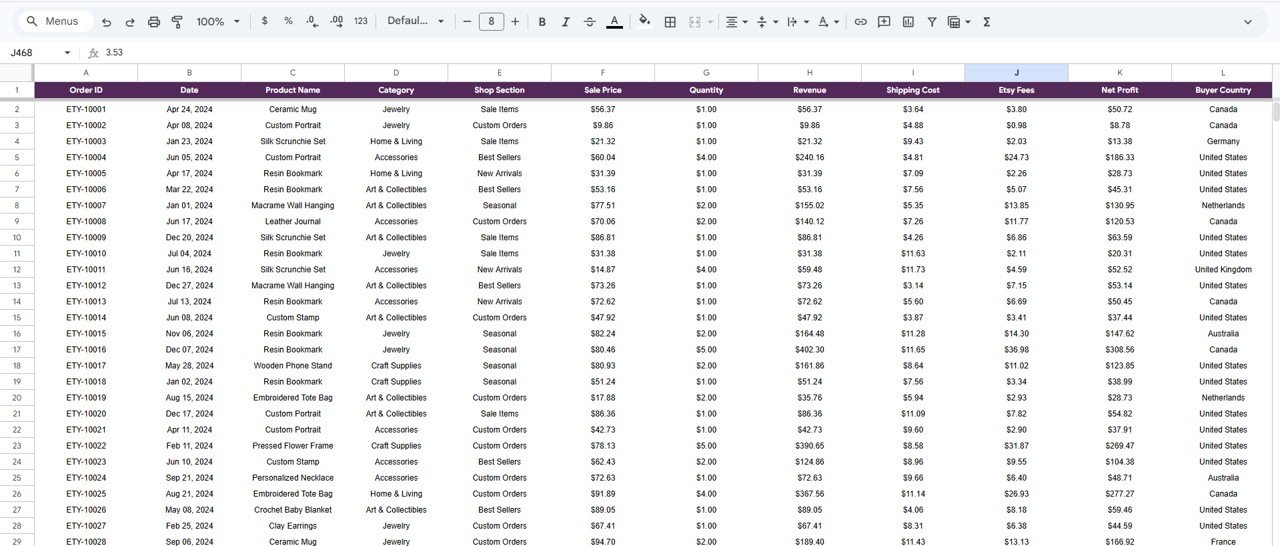
The input table with the same 18 columns. Paste your orders in the sample’s format and every page updates. Note that Net Profit is its own column, entered per order, so you decide which costs are deducted.
Etsy Seller KPIs and How They Are Calculated
| KPI | What it measures | Formula | Sample result | Better when |
|---|---|---|---|---|
| Total Revenue | Gross sales value | Sum of Revenue | $48,705 | Higher |
| Net Profit | What you keep after the costs recorded per order | Sum of the Net Profit column | $37,301 | Higher |
| Profit Margin | Share of revenue kept | Net Profit / Total Revenue | 76.6% | Higher |
| Avg Order Value | Revenue per order | Total Revenue / Total Orders | $97.41 | Higher |
| Conversion Rate | How often views turn into orders | Total Orders / Total Views | 0.38% | Higher |
| Fav/View Ratio | How appealing listings are | Total Favorites / Total Views | 5.97% | Higher |
| Total Etsy Fees | Platform costs | Sum of Etsy Fees | $4,144 | Lower (relative to revenue) |
| Avg Processing Days | Time from order to dispatch | Average of Processing Days | 3.0 | Lower |
Worked Example
The sample data has 500 orders, revenue of $48,705, 132,000 views and 7,885 favorites. Average order value is 48,705 ÷ 500 = $97.41, conversion rate is 500 ÷ 132,000 = 0.38%, and Fav/View ratio is 7,885 ÷ 132,000 = 5.97%. Profit margin is 37,301 ÷ 48,705 = 76.6%. Revenue minus shipping and Etsy fees alone would be 48,705 − 3,659 − 4,144 = 40,902, so the Net Profit column in the sample also takes off other costs. When you load your own data, include materials, packaging or ad costs in Net Profit if you want a true margin.
How to Use It with Your Own Etsy Data
- Make your own editable copy in Google Drive using the link in the included PDF guide.
- In Etsy Shop Manager, go to Settings > Options > Download Data and export your orders or order items CSV for the period.
- Arrange the columns to match the Data headers: Order ID, Date, Product Name, Category, Shop Section, Sale Price, Quantity, Revenue, Shipping Cost, Etsy Fees, Net Profit, Buyer Country, Traffic Source, Views, Favorites, Processing Days, Status, Coupon Used.
- Fill fields that are not in the order export, such as Etsy fees, net profit, traffic source, views and favorites, from your Etsy payment and Stats pages and your own cost records.
- Remove the sample rows and paste your data.
- Open Overview and move between pages with the navigation bar.
- Repeat weekly or monthly, appending new orders.
Three Real-World Use Cases
- Handmade jewelry shop: spot that international orders have strong revenue but thin profit on the Revenue & Profit by Country chart, then adjust shipping profiles.
- Digital download seller: with no shipping, focus on conversion rate and Fav/View ratio to decide which listings need new thumbnails.
- Seller testing Etsy Ads: compare Etsy Ads orders with Etsy Search orders month by month before raising the ad budget.
Best Practices
- Update on a fixed day each week so monthly charts stay complete.
- Use one spelling for categories, shop sections and traffic sources.
- Decide once which costs go into Net Profit and apply the rule to every order.
- Review the top 10 products monthly and refresh photos or tags on high-view, low-order listings.
- Judge coupons by profit, not only by order count; in the sample, coupon orders average $95 against $98 without a coupon.
Limitations: Who Should Not Use It
The dashboard does not connect to Etsy’s API, so data is pasted in. Etsy’s order export does not include per-order views, favorites or traffic source, so those fields need extra work or estimates. There is no separate column for material or labour costs; net profit is only as accurate as the costs you deduct when you fill the Net Profit column. Very high-volume sellers who want daily automated reporting may prefer a connected tool.
Related Templates and Learning
The same dashboard is available as the Etsy Seller Analytics Dashboard in Excel and the Power BI version. On this site, see the Etsy Seller Analytics Dashboard in HTML, the E-Commerce Sales Performance Dashboard, the E-Commerce KPI Dashboard and the E-Commerce KPI Scorecard.
If you would like to build sales dashboards like this yourself, the Excel Pivot Tables and Dashboards course on NextGenTemplates Academy teaches the pivot and chart techniques behind them.
Frequently Asked Questions
What KPIs does the Etsy Seller Analytics Dashboard track?
Sixteen KPI cards across four pages: Total Revenue, Total Orders, Net Profit, Avg Order Value and Conversion Rate (Overview); Total Shipping, Total Etsy Fees, Profit Margin and Coupon Orders (Sales Analysis); Total Items Sold, Total Favorites and Avg Processing Days (Product Performance); Total Views, Total Favorites, Fav/View Ratio and Etsy Ads Orders (Traffic & Marketing).
Do I need advanced Google Sheets skills?
No. You paste data in the sample’s column format and the cards and charts update. No formulas or scripts to write.
How do I get my Etsy data into the dashboard?
Download your orders CSV from Etsy Shop Manager, arrange the columns to match the Data sheet, add fees, net profit and traffic details from your Etsy payment and Stats pages, and paste.
Can I see which traffic sources bring Etsy orders?
Yes. The Traffic & Marketing page shows orders, views and favorites by traffic source, plus Etsy Ads orders and coupon impact.
Does it include material costs?
Not as a separate column. Net Profit is entered per order, so deduct materials and other costs there if you want a true product margin.
Is there an Excel version?
Yes, there are Excel, Power BI and HTML versions of the same Etsy dashboard.
Wrapping Up
The Etsy Seller Analytics Dashboard shows the numbers Etsy’s own stats leave out: profit after costs, profit by country, and which traffic sources actually convert. Load one month of orders, start with the Sales Analysis page, and use what you see to fix shipping prices, listings and ad spend.
Get the Etsy Seller Analytics Dashboard
📅 Last updated: October 2026