Seller Analytics Dashboard in Google Sheets is built for marketplace sellers who want a clear view of revenue, orders, PPC spend, returns, inventory costs, shipping, and profit without paying for another monthly analytics tool. The template includes 5 high-level KPI cards, 4 dashboard analysis pages, 16 chart views, slicers for fast filtering, and a structured Data Sheet tab for entering your seller records.
If you sell on Amazon, Etsy, Shopify, Walmart Marketplace, eBay, or multiple channels, this Google Sheets dashboard helps turn raw seller data into a practical operating report. You can review sales, inventory, and profitability in one place and then drill into the pages that explain what is driving performance.
Get the Seller Analytics Dashboard in Google Sheets here.
Key Features of Seller Analytics Dashboard in Google Sheets
The dashboard is designed around the daily questions sellers ask when they review performance: how much revenue came in, how many orders were placed, what the average order value looks like, which marketplaces are strongest, whether ad spend is helping, and where returns or costs are reducing profit.
- Overview page with Total Revenue, Total Orders, Avg Order Value, Units Sold, and Return Rate KPI cards.
- Sales Analysis page for category trends, marketplace volume, returned units, and FBA vs FBM comparison.
- Inventory page for units, revenue, returns by category, COGS, shipping, and selling price distribution.
- Profitability page for monthly profit trend, cost breakdown, revenue vs cost, and marketplace profit.
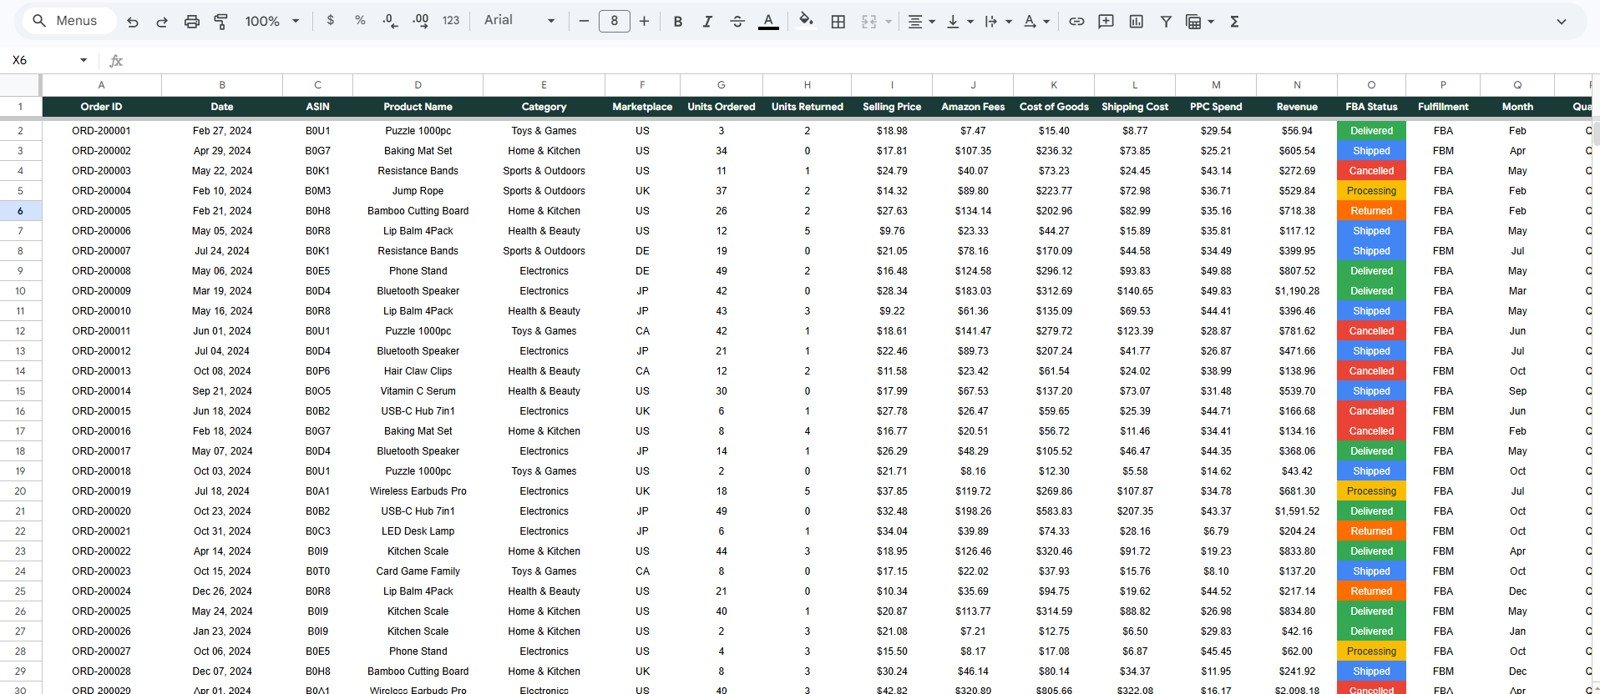
- Data Sheet tab with a consistent structure for updating or replacing seller records.
- Interactive slicers to filter the dashboard quickly by marketplace, category, status, fulfillment model, and date period.
- Editable Google Sheets format so you can copy the file to Google Drive and work in your browser.
For teams that already use Google Workspace, this format is useful because the file can be shared, duplicated, commented on, and updated without sending separate spreadsheet versions around. Google also maintains official help for using filters and slicers in Google Sheets, which makes this type of reporting workflow easier to maintain over time.
Dashboard Pages Explanation
Download the Seller Analytics Dashboard in Google Sheets from NextGenTemplates
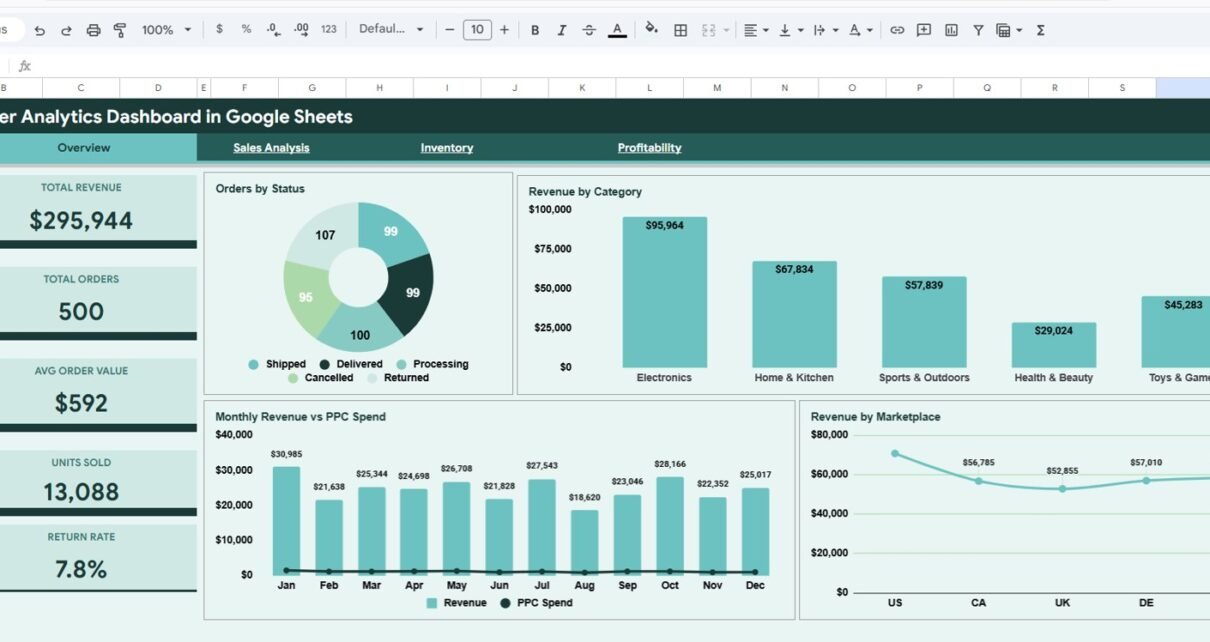
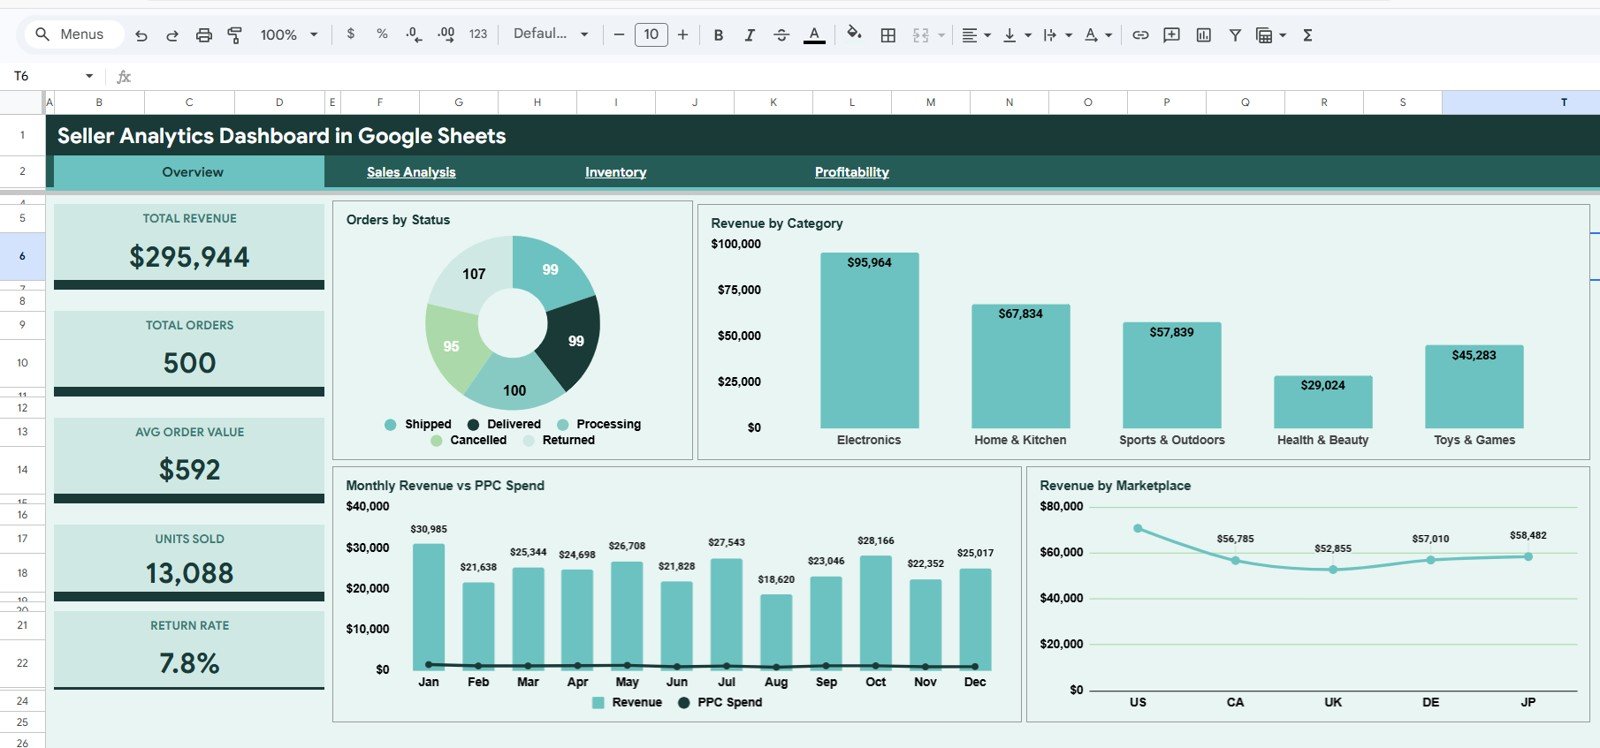
1. Overview Page
The Overview page is the main seller reporting page. At the top, it shows KPI cards for Total Revenue, Total Orders, Avg Order Value, Units Sold, and Return Rate, giving you a fast summary before you review the detailed charts.
Orders by Status. This chart shows how orders are distributed by status, such as completed, pending, cancelled, or returned.
It helps you identify fulfillment issues, return pressure, and operational delays that may require attention.
Revenue by Category. This chart compares revenue across product categories.
It helps you see which categories are driving sales and which product groups may need better pricing, promotion, or listing improvements.
Monthly Revenue vs PPC Spend. This chart compares monthly revenue against advertising spend.
It helps you review whether PPC investment is supporting growth or whether ad cost is rising faster than sales.
Revenue by Marketplace. This chart breaks revenue down by selling channel or marketplace.
It helps you compare Amazon, Etsy, Shopify, eBay, Walmart, or other channels and focus effort where the strongest revenue is coming from.
Download the Seller Analytics Dashboard in Google Sheets from NextGenTemplates
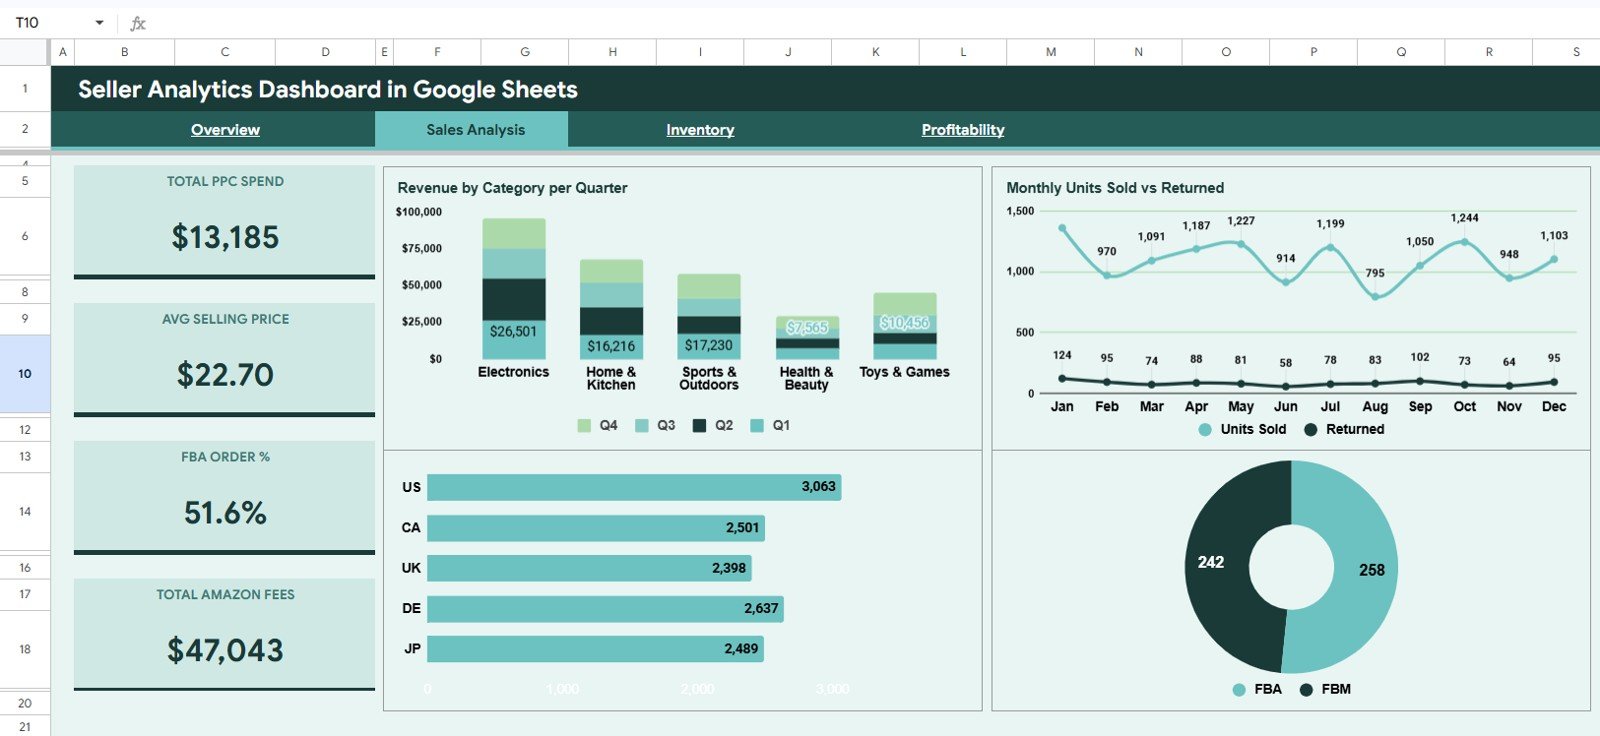
2. Sales Analysis
The Sales Analysis tab gives a more focused view of sales movement, returns, marketplace units, and fulfillment type. It is useful for monthly review meetings, product category planning, and marketplace performance checks.
Revenue by Category per Quarter. This chart shows quarterly revenue by product category.
It helps you identify seasonal patterns, category momentum, and areas where sales are weakening or improving.
Monthly Units Sold vs Returned. This chart compares sold units against returned units by month.
It helps you catch return spikes and understand whether higher sales volume is also creating product quality or expectation issues.
Units Sold by Marketplace. This chart compares sales volume across marketplaces.
It helps you see where demand is strongest and where inventory planning should be adjusted.
FBA vs FBM. This chart compares fulfillment performance across FBA and FBM style order types.
It helps sellers understand whether platform fulfillment or merchant fulfillment is creating stronger operational results.
Download the Seller Analytics Dashboard in Google Sheets from NextGenTemplates
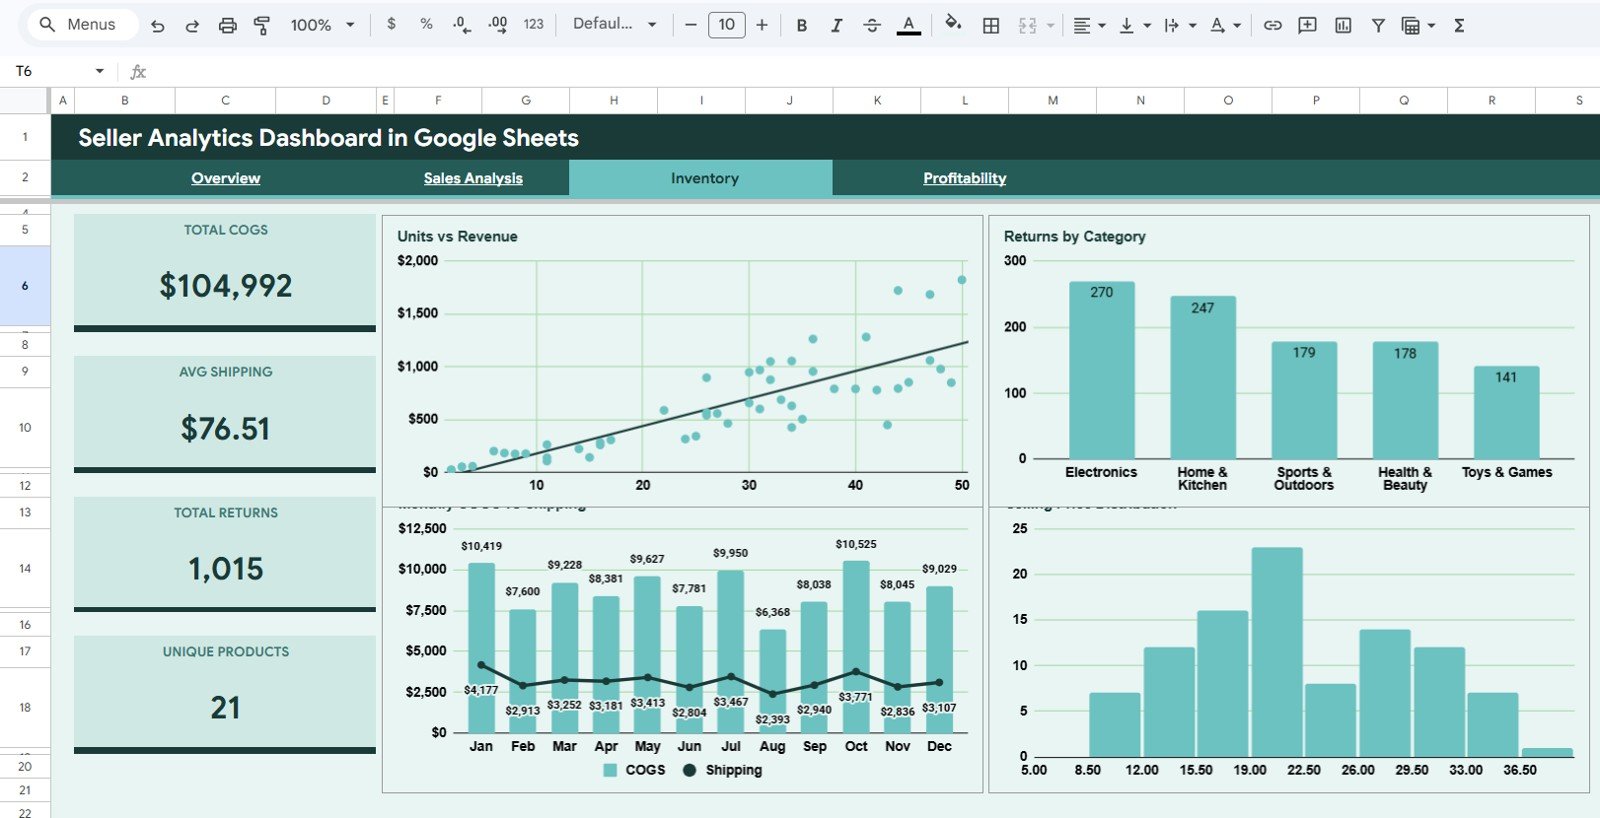
3. Inventory
The Inventory tab connects units, revenue, returns, COGS, shipping, and pricing. This is where sellers can look beyond top-line sales and understand whether products are moving efficiently.
Units vs Revenue. This chart compares sold units with revenue contribution.
It helps you understand whether high-volume products are also creating meaningful revenue or simply adding operational workload.
Returns by Category. This chart shows which categories are responsible for the most returns.
It helps you identify product groups that may need better descriptions, packaging, quality checks, sizing guidance, or customer education.
Monthly COGS vs Shipping. This chart compares cost of goods sold with shipping costs over time.
It helps you track cost pressure and understand whether logistics expenses are reducing margin.
Selling Price Distribution. This chart shows the spread of product selling prices.
It helps you evaluate pricing mix, low-ticket dependency, premium product opportunities, and bundle potential.
Download the Seller Analytics Dashboard in Google Sheets from NextGenTemplates
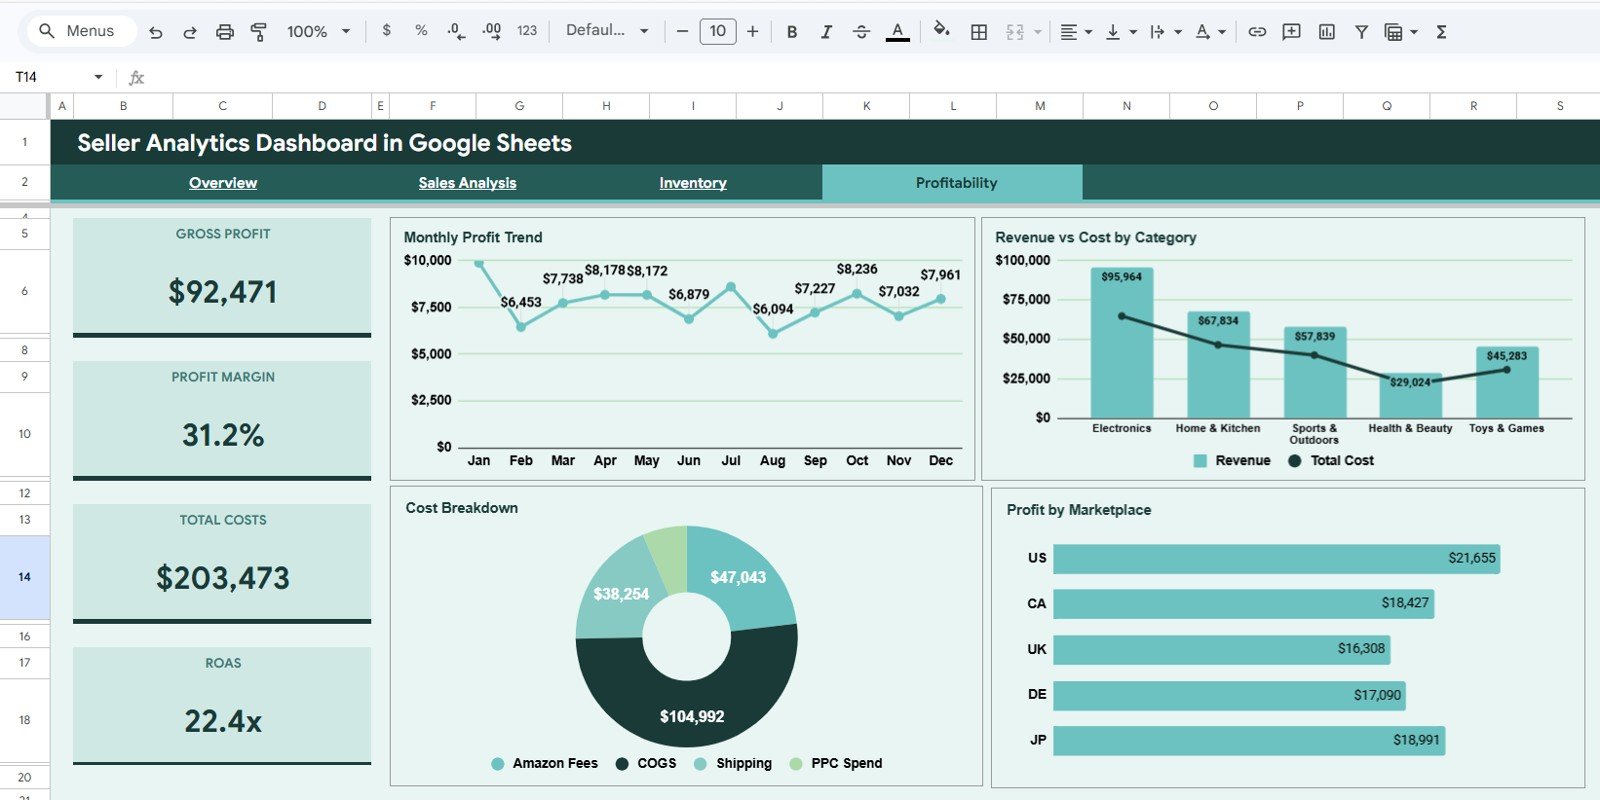
4. Profitability
The Profitability page is where the dashboard becomes most useful for decision-making. Revenue alone can hide weak margins, so this page brings cost and profit views together.
Monthly Profit Trend. This chart shows profit movement month by month.
It helps you see whether revenue growth is actually creating profit or being absorbed by fees, returns, PPC spend, shipping, and COGS.
Revenue vs Cost by Category. This chart compares category revenue against category cost.
It helps identify categories that look healthy in sales but may be underperforming when costs are included.
Cost Breakdown. This chart separates major cost components into a clear view.
It helps you see whether COGS, shipping, platform fees, or advertising are the biggest pressure points.
Profit by Marketplace. This chart compares profit by selling channel.
It helps you focus on marketplaces that create stronger net results instead of only chasing top-line revenue.
Download the Seller Analytics Dashboard in Google Sheets from NextGenTemplates
5. Data Sheet Tab
The Data Sheet tab is the source table for the dashboard. This is where you paste or enter your seller records in the same format as the sample data. Keeping the same columns lets the KPI cards, charts, and slicers continue working properly.
Seller Analytics Dashboard in Google Sheets vs Excel Dashboard vs Paid Ecommerce SaaS
| Option | Best For | Strength | Limitation |
|---|---|---|---|
| Seller Analytics Dashboard in Google Sheets | Marketplace sellers, small teams, and ecommerce operators | Shareable, editable, affordable, and browser-based | Requires consistent data entry or pasted exports |
| Microsoft Excel Dashboard | Users who prefer desktop files or advanced Excel features | Strong spreadsheet control and offline work | Collaboration is less convenient than Google Sheets |
| Paid ecommerce SaaS | Larger teams needing automated connectors and alerts | Live integrations and advanced automation | Recurring subscription cost can be high for smaller sellers |
This Google Sheets template fits sellers who want structured reporting without a complex setup. It is not a replacement for a fully automated analytics platform, but it is a strong option when you want control, speed, and a low one-time cost.
Who Should Use This Seller Analytics Dashboard?
Download the Seller Analytics Dashboard in Google Sheets from NextGenTemplates
This template is useful for Amazon sellers, Etsy sellers, Shopify store owners, eBay sellers, Walmart Marketplace sellers, multi-channel ecommerce operators, virtual assistants, analysts, and founders who need a simple way to review seller performance. It is especially helpful when you already export seller data and want a clean dashboard for recurring reviews.
It may not be the right fit if you need live API syncing, warehouse-level inventory automation, or custom enterprise reporting. In those cases, a dedicated ecommerce analytics SaaS tool or a custom dashboard build may be more suitable.
How to Use the Template
- Open the PDF guide included with your purchase.
- Click the Google Sheets copy link and create your own editable file in Google Drive.
- Open the Data Sheet tab and replace the sample rows with your seller data.
- Keep the same column structure so formulas, charts, and slicers continue working.
- Review the Overview page first, then move into Sales Analysis, Inventory, and Profitability.
- Use slicers to filter the dashboard by marketplace, category, status, fulfillment type, or period.
- Review the dashboard weekly or monthly to monitor trends, costs, returns, and profit.
Frequently Asked Questions
Is this dashboard built in Google Sheets?
Yes. It is a Google Sheets dashboard template. After purchase, you use the copy link from the guide to create your own editable Google Drive version.
Can I use it for more than one marketplace?
Yes. The dashboard is designed for marketplace-style seller data and can be used for Amazon, Etsy, Shopify, eBay, Walmart, or other sales channels.
Does it track profitability?
Yes. The Profitability page includes monthly profit trend, revenue vs cost by category, cost breakdown, and profit by marketplace.
Does it include a data sheet?
Yes. The Data Sheet tab is included so you can add your data in the same format and keep the dashboard updated.
Do I need advanced spreadsheet skills?
No. The dashboard is already designed. You mainly need to update the Data Sheet and use the dashboard tabs and slicers.
Final Thoughts
The Seller Analytics Dashboard in Google Sheets gives sellers a practical way to review sales, inventory, returns, ad spend, and profit without building a dashboard from zero. It is detailed enough for real analysis but simple enough for weekly use.
Download the Seller Analytics Dashboard in Google Sheets from NextGenTemplates and start turning seller data into cleaner decisions.
For more spreadsheet and automation tutorials, visit YouTube.com/@NeoTechNavigators.