The Franchise Performance Dashboard in Google Sheets Dashboard in Google Sheets tracks 4 KPIs, 12+ interactive charts, and slicer-driven filters across 5 dashboard pages — covering revenue, COGS, operating costs, and franchise mix for multi-location operators. Built on native Google Sheets formulas and pivot tables, it handles 50–100 franchise locations with zero add-ons and zero monthly fees.Franchise Performance Dashboard in Google Sheets
Whether you run a QSR franchise chain, a retail outlet network, or a service-based franchise system, tracking location-level revenue and cost performance is the difference between growing margin and bleeding money. Most franchise management platforms like FranConnect or Naranga charge $200–$1,500/month — this Franchise Performance Dashboard in Google Sheets delivers the same multi-location analytics at $9.99 once.
Key Features of Franchise Performance Dashboard in Google Sheets
👉 Click here to Purchase the Franchise Performance Dashboard in Google Sheets
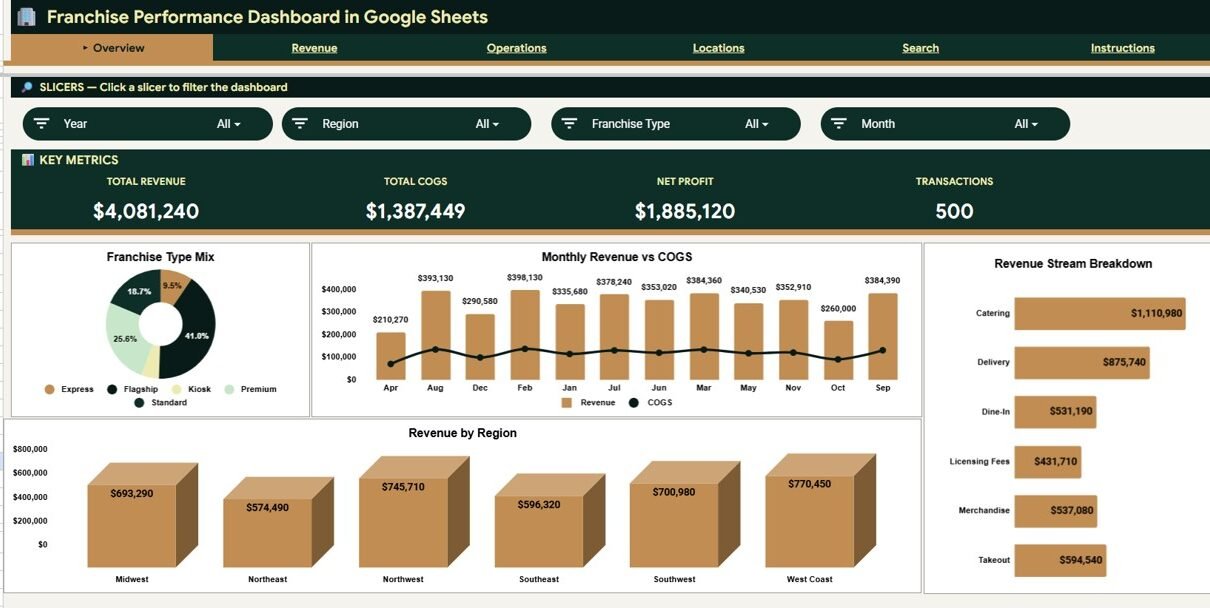
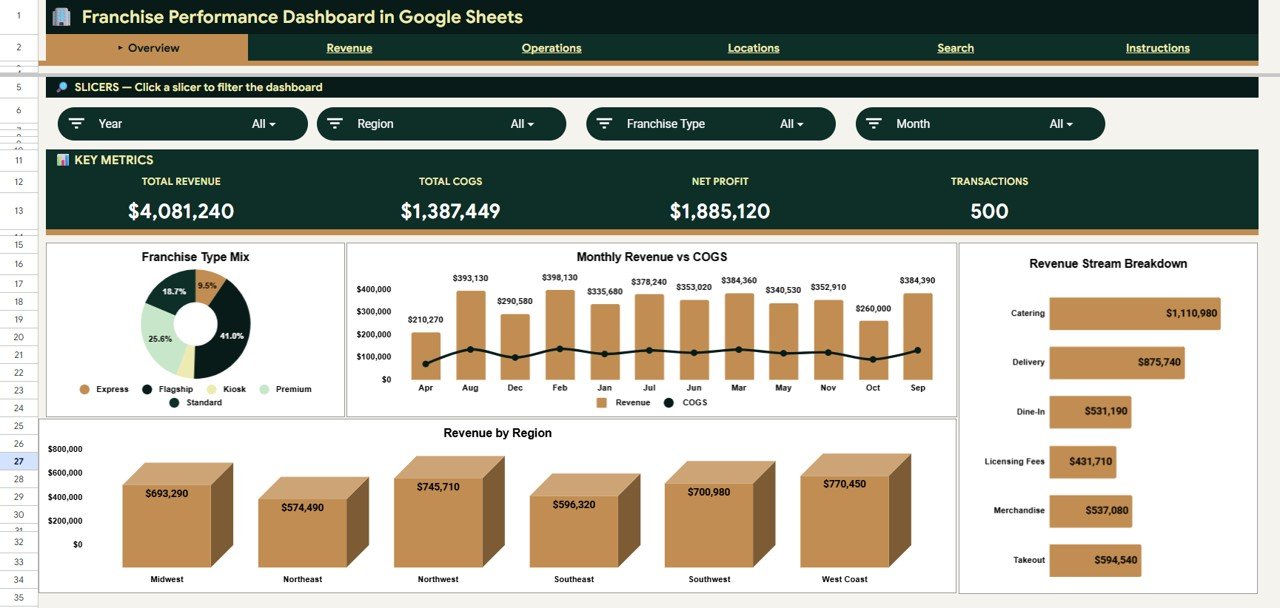
The Franchise Performance Dashboard in Google Sheets ships with 4 KPI cards on the Overview page — Total Revenue, Total COGS, Net Profit, and Transactions. These headline numbers give franchise owners and regional managers a snapshot of network health in under 5 seconds, with slicer filters to isolate any region, franchise type, or revenue stream.Franchise Performance Dashboard in Google Sheets
Across 5 analysis pages, the dashboard includes 12+ pre-built charts: Franchise Mix by Type, Revenue and COGS by Month, Revenue by Revenue Stream, Revenue by Region, Revenue by Month, Revenue by Revenue Stream and Month, Revenue by Location, Franchise Mix by Status, COGS and Operating Cost by Month, Cost by Franchise Type, Units Sold by Region, and Revenue COGS and Operating Cost by Location. Every chart responds to the slicer panel at the top of each page.
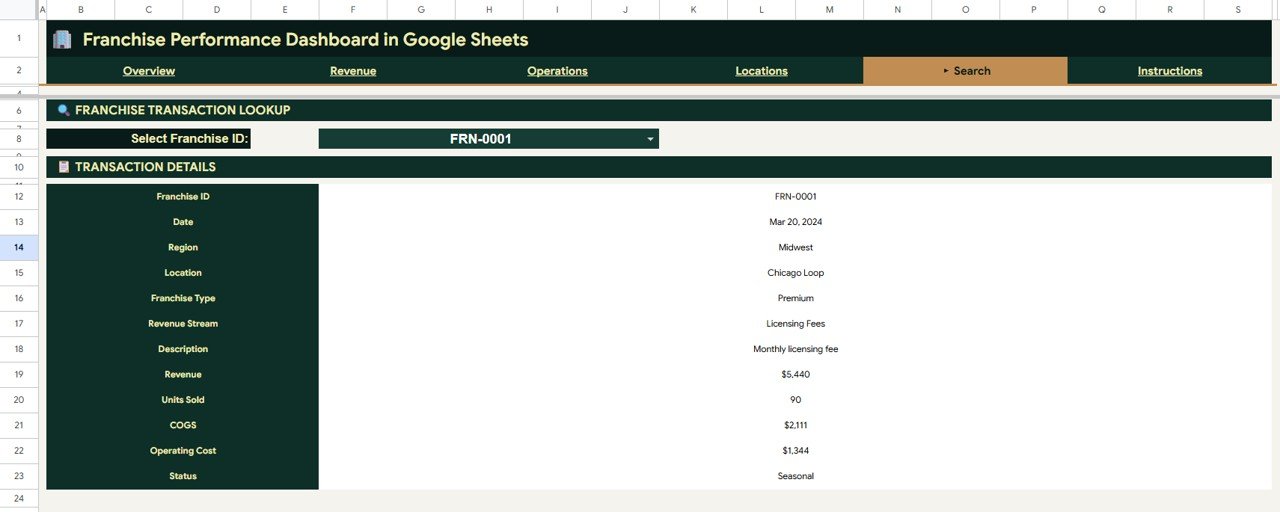
A dedicated Search Sheet lets users select any Franchise ID from a dropdown and instantly see complete transaction details — Date, Region, Location, Franchise Type, Revenue Stream, Description, Revenue, Units Sold, COGS, Operating Cost, and Status. The Data Sheet is where you paste your franchise records, and every page reads from this single source of truth.Franchise Performance Dashboard in Google Sheets
Dashboard Pages Explanation
👉 Click here to Purchase the Franchise Performance Dashboard in Google Sheets
1. Overview Page
The Overview page features 4 KPI cards (Total Revenue, Total COGS, Net Profit, Transactions) plus charts covering Franchise Mix by Type, Revenue and COGS by Month, Revenue by Revenue Stream, and Revenue by Region. Slicers at the top filter all elements at once. This is the page you open during weekly franchise review meetings.
Overview Page
2. Revenue Page
Dives into revenue trends with Revenue by Month, Revenue by Revenue Stream and Month, and Revenue by Location. Helps franchise operators identify which months, streams, and locations drive the most income — so marketing and staffing can be timed accordingly.
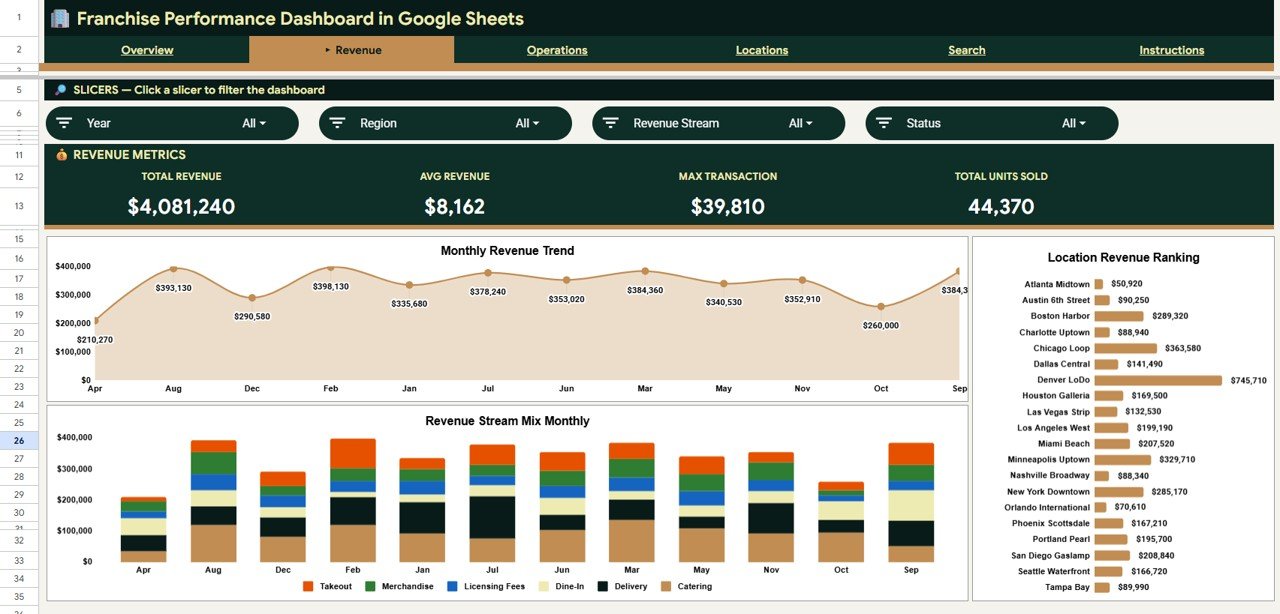
Revenue Page
3. Operations Page
Analyzes cost structure with Franchise Mix by Status, COGS and Operating Cost by Month, Cost by Franchise Type, and Units Sold by Region. This page answers where costs concentrate and which franchise types have the widest margins — essential data for franchisors setting royalty tiers.
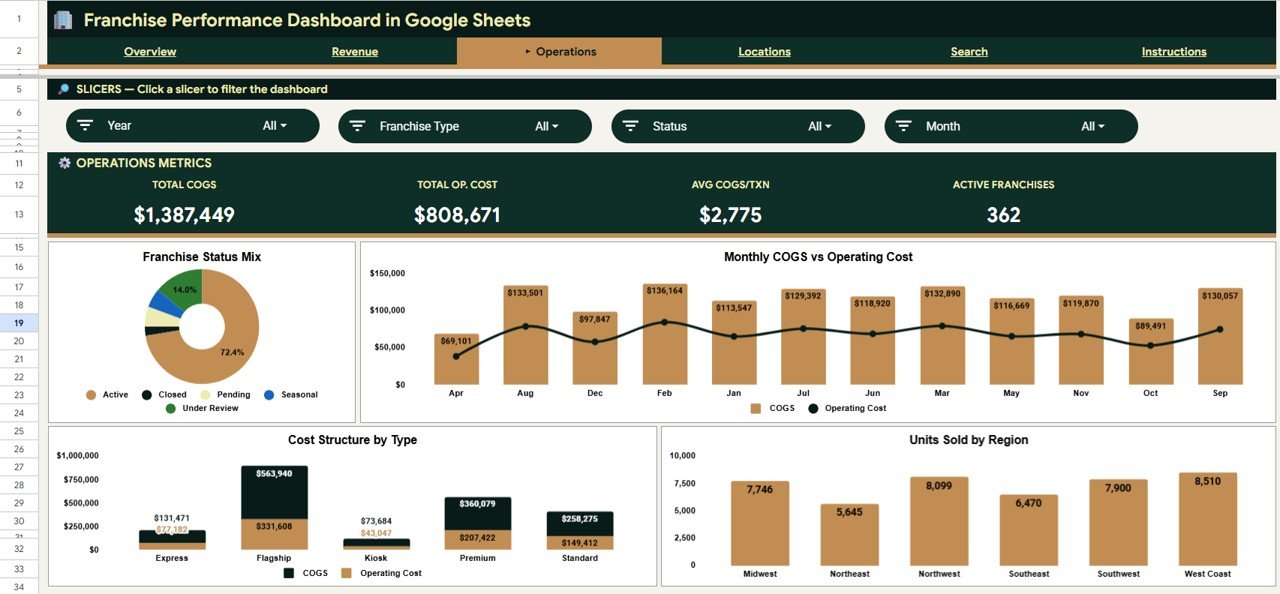
Operations Page
4. Locations Page
Regional and location-level analysis with Revenue and COGS by Region and Month, Revenue COGS and Operating Cost by Location, and Revenue by Location. Built for multi-location franchise operators comparing branches on revenue, cost, and profitability.
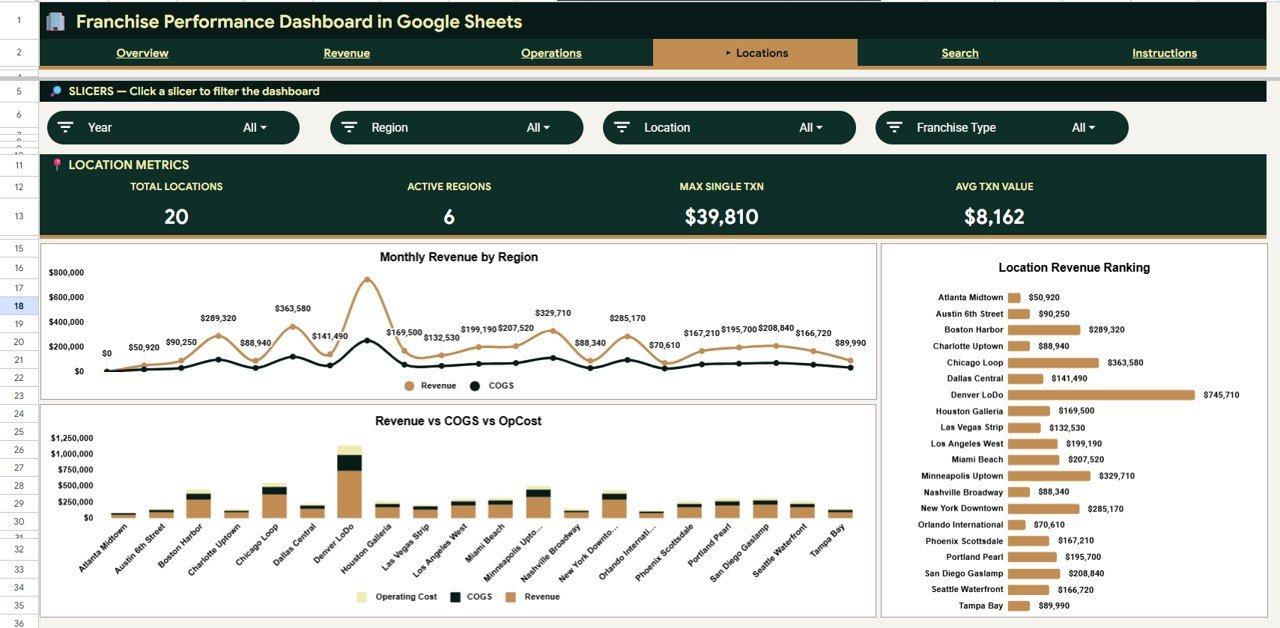
Locations Page
5. Search Sheet
Select a Franchise ID from the dropdown to instantly display the full transaction record: Date, Region, Location, Franchise Type, Revenue Stream, Description, Revenue, Units Sold, COGS, Operating Cost, and Status. No scrolling through raw data.
Search Sheet tab
6. Data Sheet
This is where you add your franchise data. Paste your records in the same column format and every dashboard page refreshes automatically.
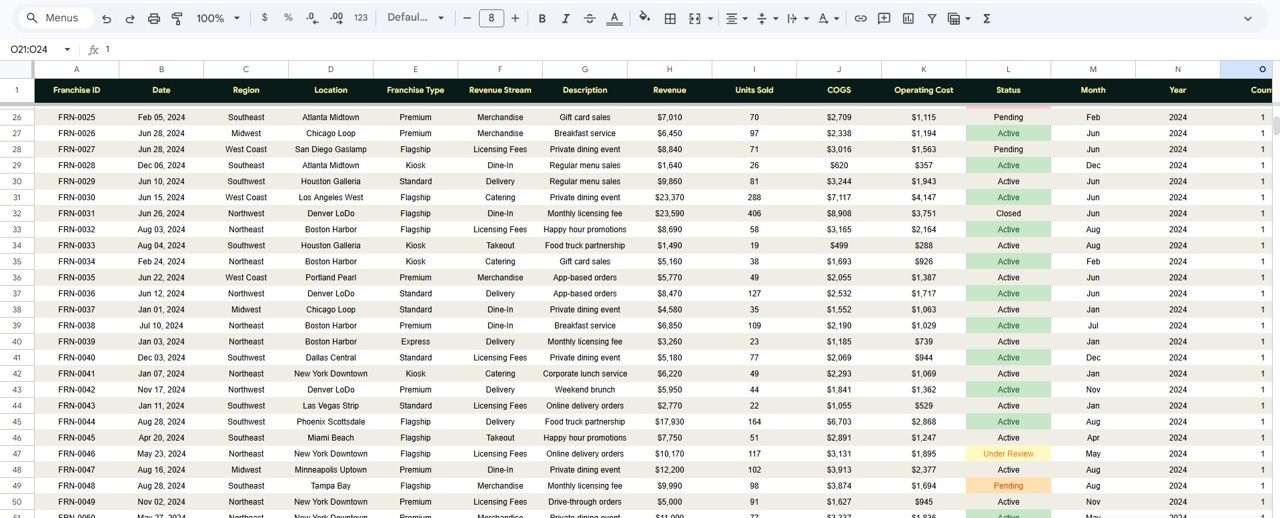
Data Sheet tab
Franchise Performance Dashboard in Google Sheets vs. Microsoft Excel Dashboard vs. FranConnect — Feature Comparison
| Feature | Franchise Performance Dashboard in Google Sheets | Excel Franchise Dashboard | FranConnect / Naranga / FranchiseSoft |
|---|---|---|---|
| Cost | $9.99 one-time | $17.99 one-time | $200–$1,500/month |
| Platform | Google Sheets (free account) | Microsoft Excel | Cloud SaaS |
| Setup Time | Under 10 minutes | Under 10 minutes | 4–12 weeks onboarding |
| Real-Time Collaboration | ✅ Built-in | ❌ Requires OneDrive | ✅ Yes |
| Mobile Access | ✅ Google Sheets app | Limited | ✅ Dedicated app |
| Customizable Fields | ✅ Fully editable | ✅ Fully editable | Limited to plan tier |
| Franchise ID Lookup | ✅ Dropdown search | ✅ VBA or manual | ✅ Built-in CRM |
| Year-1 Cost (5 Users) | $9.99 total | $17.99 + licenses | $2,400–$18,000 |
For franchise owners who want multi-location revenue and cost tracking without paying $200+/month for FranConnect, the Franchise Performance Dashboard in Google Sheets sits in the sweet spot.
Who Should Use This Template
Perfect for:
- Franchise owners managing 2–50 locations across multiple regions
- Restaurant and QSR franchise managers tracking revenue by stream
- Multi-unit retail franchise operators comparing COGS across branches
- Franchise consultants needing a client-ready reporting template
Not a fit if:
- Enterprise franchises with 100+ locations needing automated POS integration
- Franchise networks requiring royalty calculation or compliance tracking
- Teams needing SOC 2-certified data storage
Real-World Use Cases
👉 Click here to Purchase the Franchise Performance Dashboard in Google Sheets
Raj manages a 12-location fast-food franchise in Maharashtra. He uses the Franchise Performance Dashboard in Google Sheets every Monday to compare revenue by location and identify which branches have the highest COGS-to-revenue ratio. The Locations page flagged a branch running 15% above average operating costs — a staffing issue resolved before quarter-end.
Sarah operates a 6-unit coffee franchise across Texas. She tracks Revenue by Revenue Stream to see which locations generate more from takeaway versus dine-in, helping her decide where to invest in drive-through upgrades. The Restaurant P&L Dashboard in Google Sheets complements this template for deeper profit-and-loss analysis.
Carlos is a franchise consultant working with 4 QSR brands. He uses the same Google Sheets template across all clients, replacing a $500/month analytics tool with a $9.99 one-time purchase that delivers the same KPI visibility for regional reviews.
Advantages of Franchise Performance Dashboard in Google Sheets
The primary advantage is cost — $9.99 once versus $2,400–$18,000 per year for franchise management SaaS. Beyond price, the template runs in any free Google account with native collaboration built in, meaning every franchise manager and regional lead can view the same live data without per-seat licensing. The slicer-driven architecture means ad-hoc analysis takes seconds, not the 30+ minutes it takes to pull custom reports from FranConnect or similar platforms. Every chart, formula, and slicer is fully editable, so you can adapt the dashboard to your exact franchise model without vendor support tickets.
Opportunities for Improvement
👉 Click here to Purchase the Franchise Performance Dashboard in Google Sheets
This dashboard is a reporting layer, not a franchise operations platform. It does not include automated royalty calculations, franchisee portal access, or real-time POS data syncing. For franchises with 100+ locations generating thousands of daily transactions, Google Sheets cell limits may require splitting data by quarter or region. Teams needing real-time dispatch or compliance workflows should pair this with a dedicated franchise management system and use the dashboard for monthly performance reviews.
Best Practices
Update the Data Sheet weekly or monthly on the same day to maintain consistent trend lines across the Revenue and Operations pages. Use the slicer panel on the Overview page during franchise review meetings to focus the discussion on one region at a time. Hide rows in the Data Sheet for inactive franchises rather than deleting them — this preserves historical trend data for the Locations page. Share the Google Sheets file with regional managers using view-only access to prevent accidental formula edits, and grant edit access only to the central reporting team.
Explore Relevant Templates
📌 Restaurant P&L Dashboard in Google Sheets — Deeper profit-and-loss analysis for restaurant franchise operations.
📌 Food Truck Dashboard in Google Sheets — Mobile food business analytics with revenue and cost tracking.
📌 Food and Beverage Dashboard in Google Sheets — F&B operations tracking across menu items and outlets.
📌 Also see: Franchise Management KPI Dashboard in Google Sheets for a KPI-focused view with MTD/YTD tracking.
Browse all Google Sheets Dashboard Templates
Frequently Asked Questions
👉 Click here to Purchase the Franchise Performance Dashboard in Google Sheets
What KPIs does the Franchise Performance Dashboard in Google Sheets track?
The Franchise Performance Dashboard in Google Sheets tracks 4 KPIs — Total Revenue, Total COGS, Net Profit, and Transactions — plus 12+ supporting charts across Revenue, Operations, Locations, and a Search Sheet. All metrics update automatically when you replace the sample data.
Can I use this with a free Google account?
Yes. The Franchise Performance Dashboard runs entirely on native Google Sheets formulas and pivot tables. No paid Workspace plan, add-ons, or macros are required.
How does this compare to FranConnect or franchise management software?
FranConnect starts at $200/month. This dashboard costs $9.99 once. It lacks automated POS integration and franchisee portals but delivers the same multi-location revenue and cost analytics that most small-to-mid franchise operators actually use weekly.
How long does setup take?
Under 10 minutes. Open the Google Sheets copy link from the PDF guide, paste your data into the Data Sheet, and every dashboard page, chart, and KPI card refreshes automatically.
Can I customize the charts and add my own metrics?
Yes. Every chart, KPI formula, and slicer is fully editable. You can add new columns to the Data sheet, create additional pivot tables, and build extra charts using standard Google Sheets features.
How many franchise locations can this handle?
The dashboard handles 50–100 locations with thousands of transaction records smoothly in Google Sheets. For larger datasets, consider splitting by quarter or region.
Is this template available in Excel or Power BI?
Yes. NextGenTemplates offers franchise dashboards in Excel and Power BI formats.
About the Author
Built by PK — Microsoft Certified Professional with 15+ years of Excel, Google Sheets, and Power BI experience. Founder of NextGenTemplates, reaching 300K+ subscribers across YouTube channels. Every template is hand-built and tested before release.
Conclusion
The Franchise Performance Dashboard in Google Sheets gives franchise owners and operators a 5-page, slicer-driven analytics tool that tracks revenue, COGS, operating costs, and franchise mix across every location — all for $9.99 once.
👉 Click here to Purchase the Franchise Performance Dashboard in Google Sheets
✅ Instant download · One-time payment · No subscription
🎥 Visit our YouTube channel: Youtube.com/@NeoTechNavigators