Running a daycare means tracking children, parents, staff, fees, meal plans, and safety all at once — and the moment the numbers live in ten different sheets, decisions slow down. The Daycare Center Dashboard in Google Sheets solves this by turning every data point into a clean, interactive dashboard that updates in real time as you enter records. This guide walks through every sheet tab in the template, what it shows, and how to use it to run a smarter, data-driven childcare operation.
👉 Click here to Purchase the Daycare Center Dashboard in Google Sheets
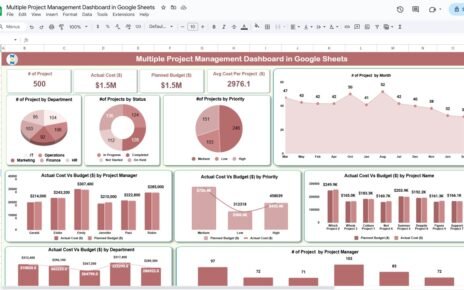
Built on Google Sheets, the template is cloud-native, shareable, and zero-install. Whether you run a single location or a multi-branch childcare network, you’ll have your Overview, Enrollment, Financial, and Staff insights at your fingertips.
Key Features of the Daycare Center Dashboard in Google Sheets
👉 Click here to Purchase the Daycare Center Dashboard in Google Sheets
- 6 Purpose-Built Sheet Tabs — Overview, Enrollment Analysis, Financial Analysis, Staff Analysis, Search Sheet, and Data Sheet.
- 5 KPI Cards — Total Children Enrolled, Daily Revenue, Average Daily Fee, Attendance Rate, and Average Parent Satisfaction.
- 10+ Pre-Built Charts — From age-group distribution to revenue actual-vs-target comparisons.
- Interactive Slicers — Filter any page by age group, program type, classroom, or month in one click.
- Smart Search Sheet — Dropdown-driven lookup for any child record, with a live Recent Records panel.
- Cloud-Native — No installation, no compatibility headaches. Works on any browser, any device.
- Share-Ready — Use Google’s native sharing to give parents view-only access and staff edit rights.
Dashboard Pages Explanation
1. Overview Page
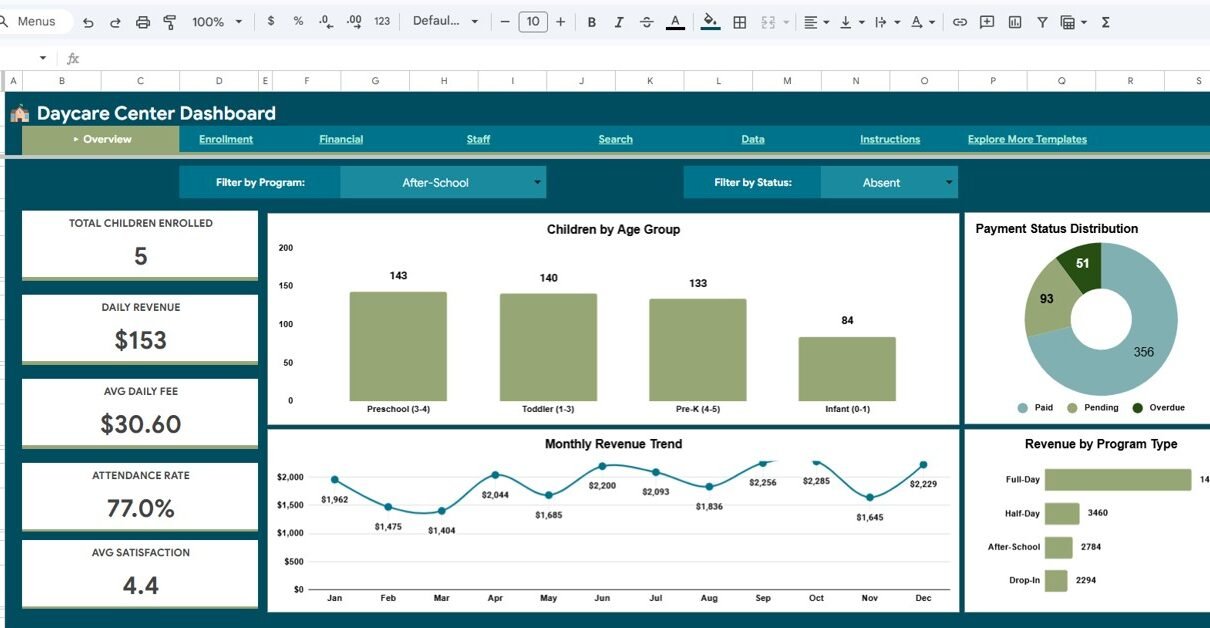
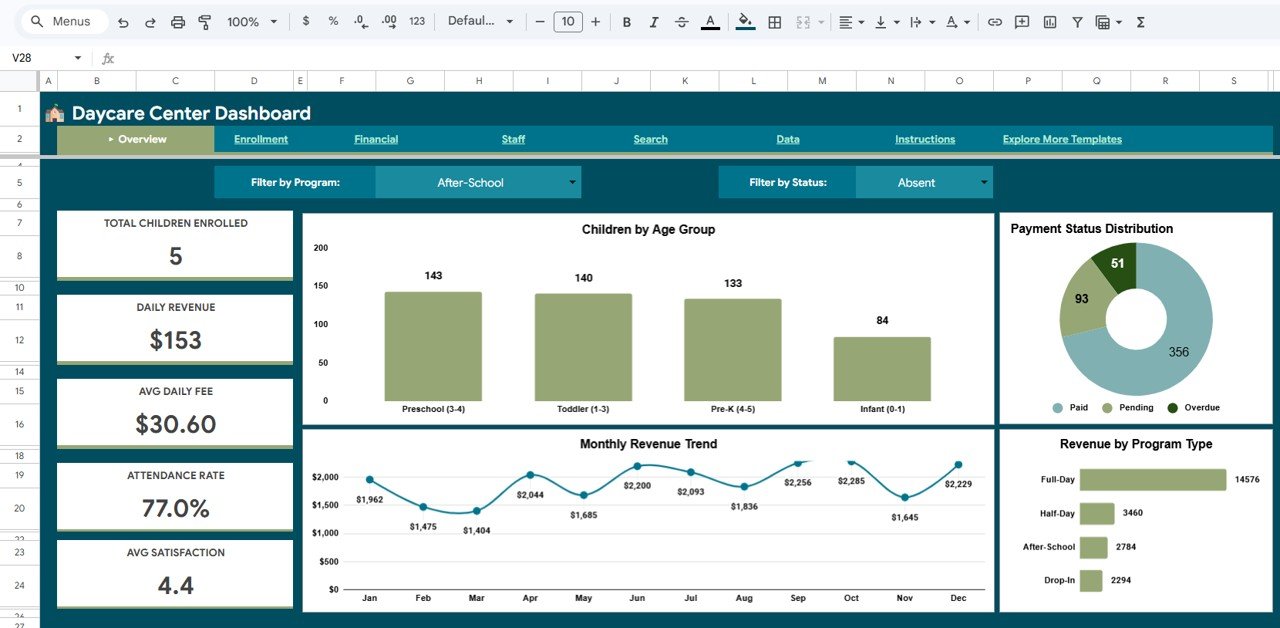
The Overview Page is the executive summary of your daycare. Five KPI cards at the top show Total Children Enrolled, Daily Revenue, Average Daily Fee, Attendance Rate, and Average Parent Satisfaction. Below the cards, four charts visualize Children by Age Group, Payment Status Distribution, Monthly Revenue Trend, and Revenue by Program Type. Interactive slicers on the right let you instantly filter every chart by age group, program, classroom, or month.
2. Enrollment Analysis
👉 Click here to Purchase the Daycare Center Dashboard in Google Sheets
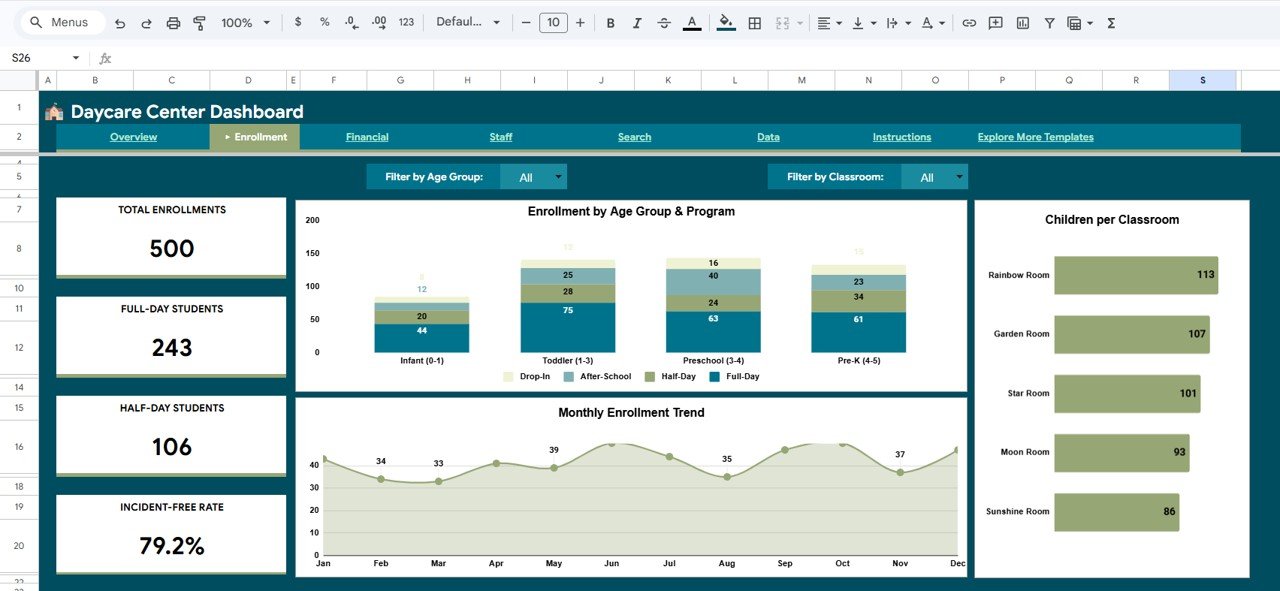
The Enrollment Analysis sheet focuses on how your center is growing and where the capacity is going. The page shows Enrollment by Age Group and Program, a Monthly Enrollment Trend, and a Children per Classroom breakdown. Together these help you decide when to open a new classroom, which age groups to promote harder, and which programs are under-utilized. For deeper admissions analytics, many centers pair this with our Student Enrollment KPI Dashboard in Google Sheets.
3. Financial Analysis
👉 Click here to Purchase the Daycare Center Dashboard in Google Sheets
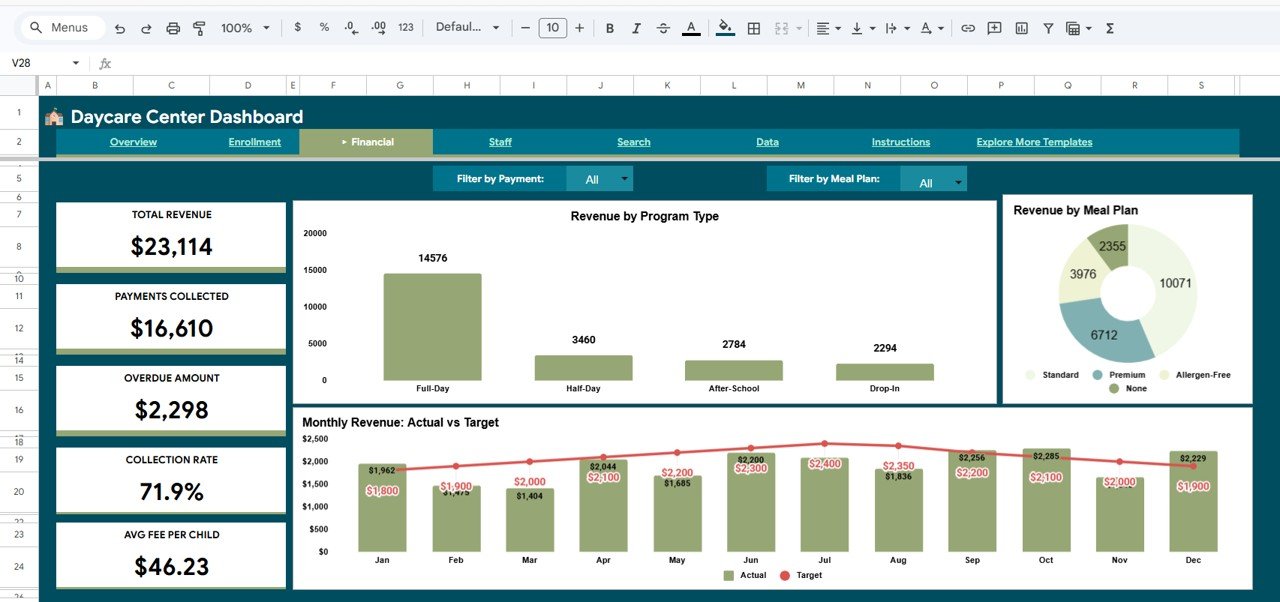
The Financial Analysis tab answers the question every owner asks: where is the money coming from, and are we on target? Revenue by Program Type surfaces your most profitable offerings. Revenue by Meal Plan highlights add-on revenue streams. And the Monthly Revenue Actual vs Target chart gives you an at-a-glance pulse on financial performance throughout the year.
4. Staff Analysis
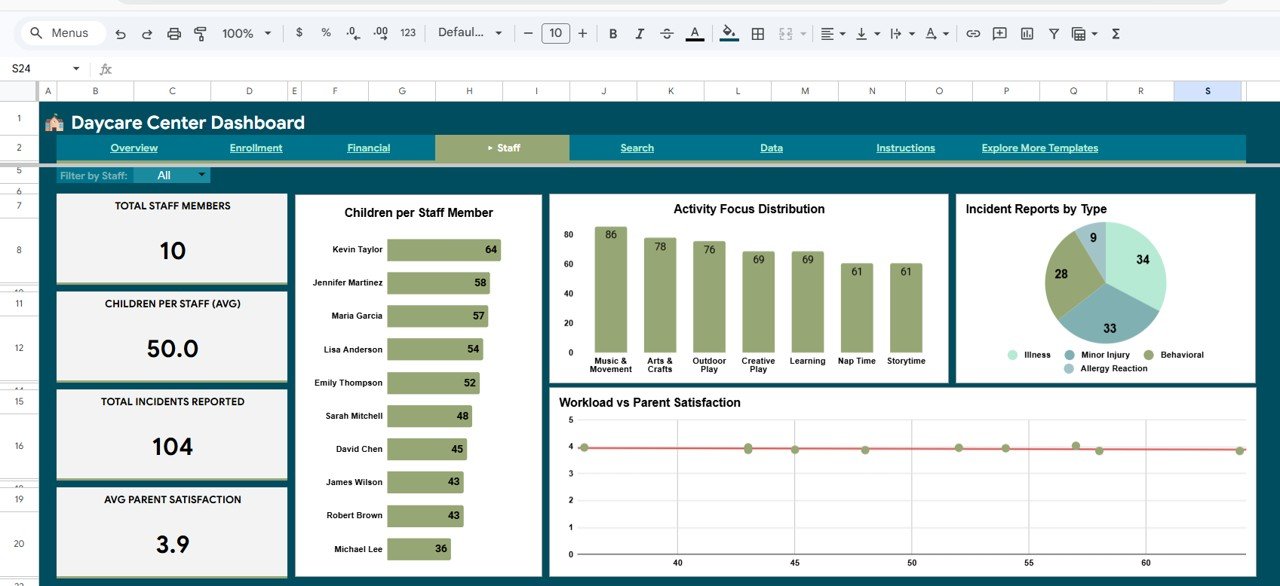
The Staff Analysis page keeps your team balanced. Charts include Children per Staff Member (ratio compliance at a glance), Activity Focus Distribution (what your staff are spending time on), Incident Reports by Type (safety hotspots), and a Workload vs Parent Satisfaction view so you can see whether over-worked staff correlate with unhappy parents. If you manage a larger network, our Education KPI Scorecard in Google Sheets adds senior-level KPI tracking on top.
5. Search Sheet
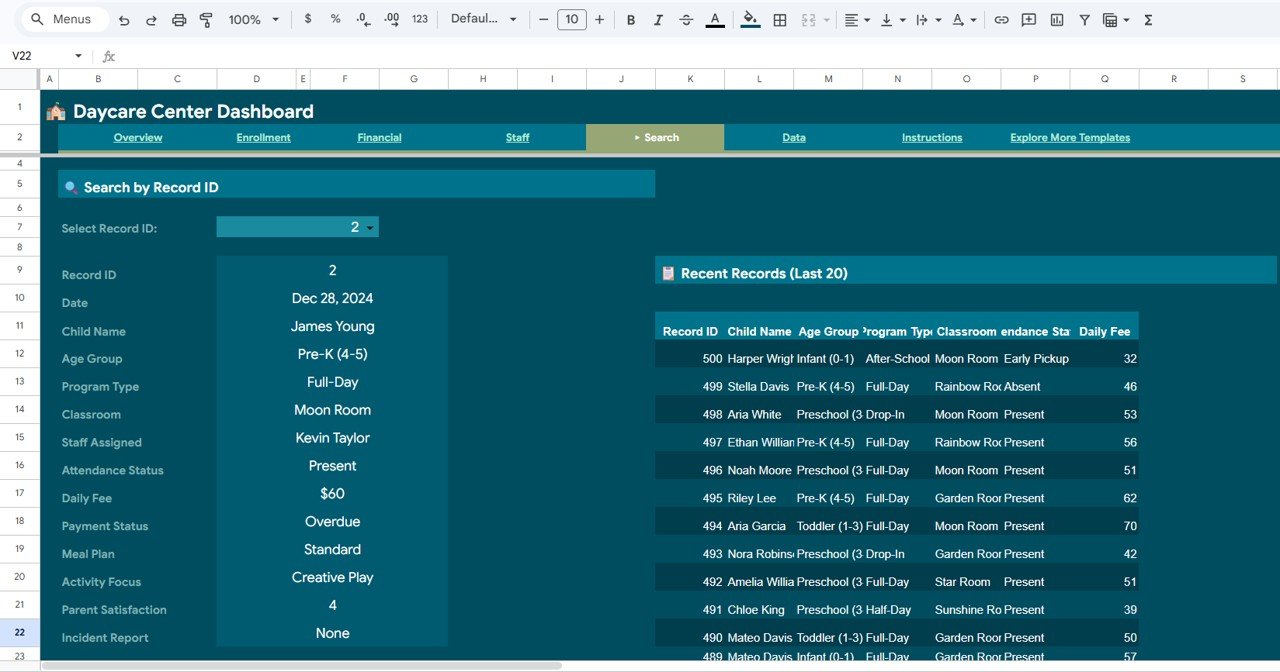
The Search Sheet is a quick lookup tool. Pick a Record ID from the dropdown and you’ll instantly see every field for that child: Date, Child Name, Age Group, Program Type, Classroom, Staff Assigned, Attendance Status, Daily Fee, Payment Status, Meal Plan, Activity Focus, Parent Satisfaction, and Incident Report. A Recent Records table on the right shows the last 20 entries so you can scan recent activity at a glance.
6. Data Sheet
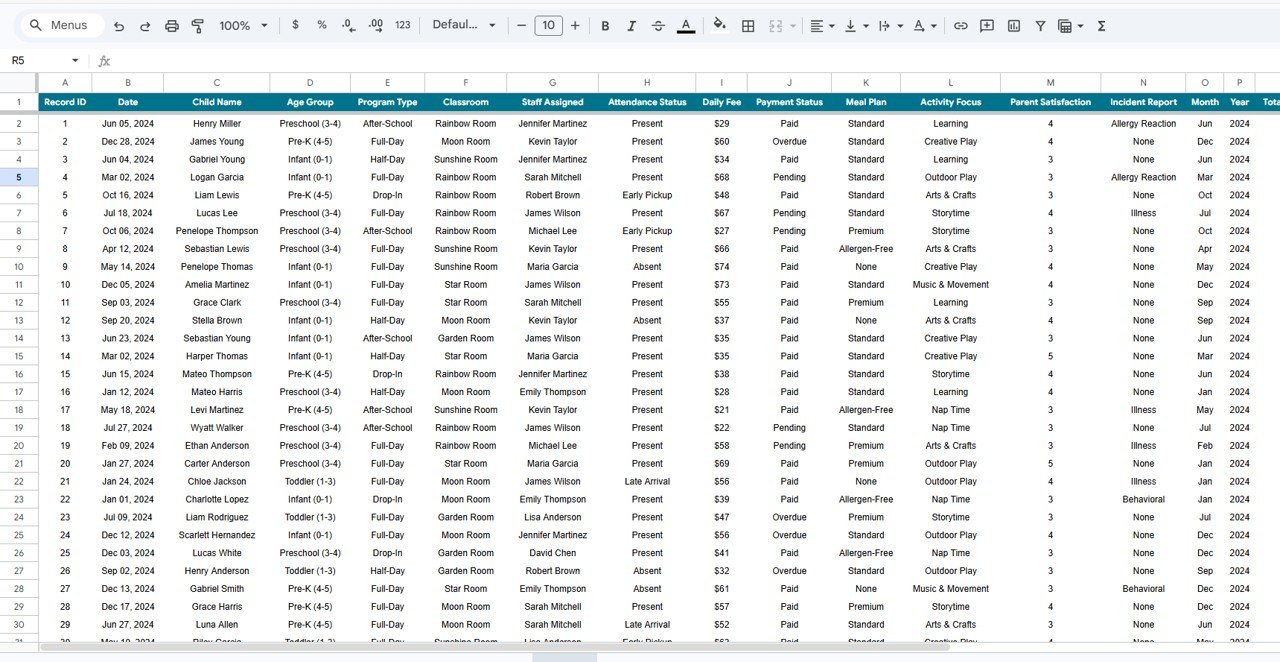
The Data Sheet is your source of truth. Every chart, KPI, and filter on the other pages reads from this sheet. To use your own data, just replace the sample rows using the same column structure — the rest of the template will automatically refresh thanks to the dynamic ranges and pivot-based charts wired throughout.
Advantages of the Daycare Center Dashboard in Google Sheets
- Cloud-native collaboration — share live dashboards with owners, managers, and parents with zero attachments or version conflicts.
- Zero installation — works on any computer, Chromebook, tablet, or phone with a browser.
- Already wired up — every formula, slicer, and chart is pre-built. You just add data.
- Cheaper than software — no monthly daycare-management SaaS fee. One-time template, lifetime use.
- Data ownership — your data stays in your Google Drive, not on a third-party server.
Opportunities for Improvement
👉 Click here to Purchase the Daycare Center Dashboard in Google Sheets
Like any Google Sheets template, there are a few honest trade-offs worth knowing:
- Not a full daycare CRM — it’s an analytics dashboard. Parent communications, billing, and compliance paperwork still live elsewhere.
- Manual data entry — if your center already uses a daycare software, you’ll need to export/import weekly.
- Google account required — each collaborator needs a Google account to edit.
- Performance with very large datasets — Google Sheets handles tens of thousands of rows well, but multi-year archives may benefit from splitting into yearly files.
Best Practices for Using the Daycare Center Dashboard
- Enter data daily. A dashboard is only as good as its freshness. Build a 5-minute end-of-day data habit.
- Keep column structure intact. Add columns to the right if you need custom fields — don’t rearrange existing ones.
- Share with view-only by default. Give parents view access only. Reserve edit access for managers.
- Archive yearly. At year-end, duplicate the file for the next year to keep the current file fast.
- Pair with a KPI scorecard. Use the Childcare Services KPI Dashboard in Excel for monthly board-level reporting alongside this operational dashboard.
Explore Relevant Templates
- 📌 Preschool KPI Dashboard in Google Sheets
- 📌 Student Enrollment KPI Dashboard in Google Sheets
- 📌 Education KPI Scorecard in Google Sheets
- 📌 Student Academic Performance Dashboard in Google Sheets
- 📌 Browse all Google Sheets Dashboards
Frequently Asked Questions
👉 Click here to Purchase the Daycare Center Dashboard in Google Sheets
What is the best Google Sheets template for running a daycare center?
The Daycare Center Dashboard in Google Sheets is a purpose-built operational dashboard for daycare and childcare centers. It covers enrollment, attendance, revenue, staff workload, and parent satisfaction in a single cloud-based template — without requiring any software installation or advanced Google Sheets skills.
How do I track daycare enrollment in Google Sheets?
Use the Enrollment Analysis page of this template. It automatically generates charts for Enrollment by Age Group and Program, a Monthly Enrollment Trend line, and Children per Classroom from the Data Sheet. Just add each new child record to the Data Sheet and the charts refresh automatically.
Can I use this daycare dashboard for multiple locations or branches?
Yes. You can duplicate the Google Sheets file for each branch, or add a Location column to the Data Sheet and filter the Overview page by location using the built-in slicers to get a consolidated multi-branch view.
Do I need to install any software to use this template?
No. The Daycare Center Dashboard runs entirely in Google Sheets. Once you click the copy link, the template lives in your Google Drive and works on any browser, Chromebook, tablet, or phone.
What KPIs are tracked in the Daycare Center Dashboard?
Five primary KPIs are tracked: Total Children Enrolled, Daily Revenue, Average Daily Fee, Attendance Rate, and Average Parent Satisfaction. In addition, 10+ charts cover payment status, enrollment by age group and program, monthly revenue trends, revenue by meal plan, staff workload, activity focus, and incident reports.
Is this template beginner-friendly?
Yes. All formulas, pivot tables, and charts are pre-built. You don’t need to know Google Sheets formulas — you just replace sample data on the Data Sheet with your own daycare records, and every other page refreshes automatically.
Conclusion
Running a daycare well is about paying attention to small numbers every day — how many children showed up, how many fees cleared, which classroom felt crowded, which staff member had an incident. The Daycare Center Dashboard in Google Sheets turns all of that noise into signal in a single, shareable cloud file. Stop juggling ten spreadsheets, start making confident decisions.
👉 Click here to Purchase the Daycare Center Dashboard in Google Sheets
🎥 For step-by-step video walkthroughs, subscribe to our YouTube channel:
YouTube.com/@NeoTechNavigators.