The Trucking and Logistics Dashboard in Google Sheets is a powerful, cloud-based analytics template built for fleet managers, logistics coordinators, trucking company owners, and supply chain professionals. It transforms raw shipment records into clear KPI cards, filterable charts, and actionable insights across 5 interactive pages — all inside a shareable, collaborative Google Sheets workbook that works on any device.Trucking and Logistics Dashboard in Google Sheets
Managing trucking operations across hundreds of shipments, multiple drivers, and dozens of vehicles is almost impossible without a centralized reporting tool. Spreadsheets get messy. Fuel costs go untracked. On-time delivery rates slip. This Google Sheets logistics dashboard solves those problems by giving you a live, single-pane-of-glass view of your entire trucking business — revenue, cost, profit, driver performance, route efficiency, and vehicle utilization — all refreshing automatically as you update the data.Trucking and Logistics Dashboard in Google Sheets
Key Features of the Trucking and Logistics Dashboard in Google Sheets
- 5 Interactive Dashboard Pages — Overview, Fleet Analysis, Route & Delivery, Financial, and Search Sheet for complete trucking visibility.
- 5 KPI Cards on Overview — Total Shipments, Total Revenue, Total Cost, On-Time Delivery %, and Avg Distance (km).
- 16+ Dynamic Charts — Covering delivery status, monthly revenue vs cost, vehicle and driver analytics, route efficiency, and quarterly profitability.
- Built-in Slicers — Filter any page by vehicle type, route type, driver, destination, or month with one click.
- Shipment Lookup Search — Select any Shipment ID from a dropdown and instantly see all 15 key fields.
- Cloud-Based and Shareable — Share with your team in one click, edit in real time, access from any browser or mobile device.
- No Add-ons or Macros — 100% native Google Sheets functions, pivots, and charts.
- Pre-loaded Sample Data — Ready-to-use dataset so you can explore the dashboard immediately.
- Fully Editable — Customize charts, formulas, columns, and dropdowns to match your fleet.Trucking and Logistics Dashboard in Google Sheets
Dashboard Pages Explanation
👉 Click here to Purchase the Trucking and Logistics Dashboard in Google Sheets
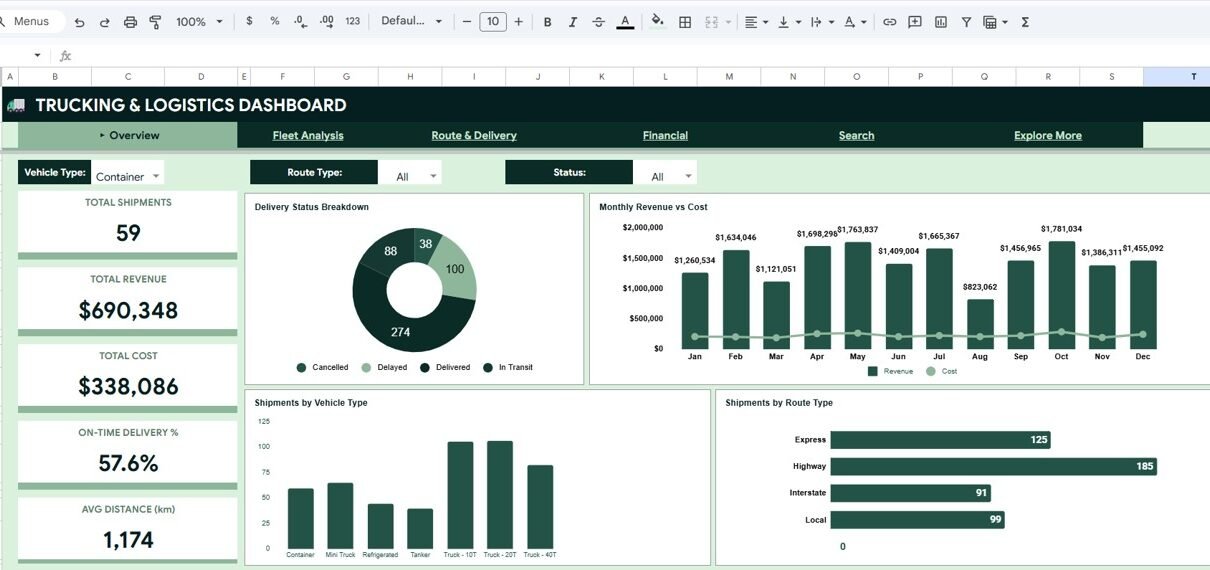
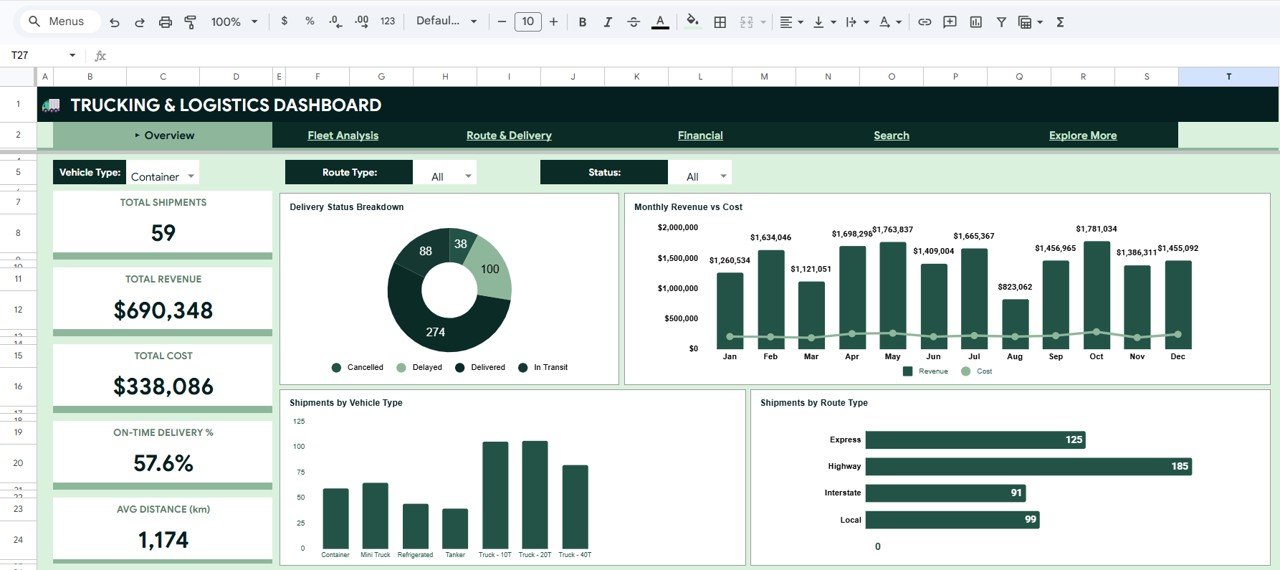
1. Overview Page
The Overview page is the executive cockpit of the dashboard. It opens with 5 high-level KPI cards — Total Shipments, Total Revenue, Total Cost, On-Time Delivery %, and Avg Distance (km) — giving fleet managers an instant pulse of the entire trucking operation. Four analytical charts dig deeper:
- Delivery Status Breakdown by Status — see how shipments are distributed across Delivered, In Transit, Delayed, and other statuses.
- Monthly Revenue vs Cost by Month — compare revenue and cost trends over the year to spot margin pressure.
- Shipments by Vehicle Type — understand which vehicle categories carry the bulk of your workload.
- Shipments by Route Type — see how short-haul, long-haul, and regional routes contribute to volume.Trucking and Logistics Dashboard in Google Sheets
Multiple slicers above the charts let you filter the entire page by vehicle, route, or month in a single click.
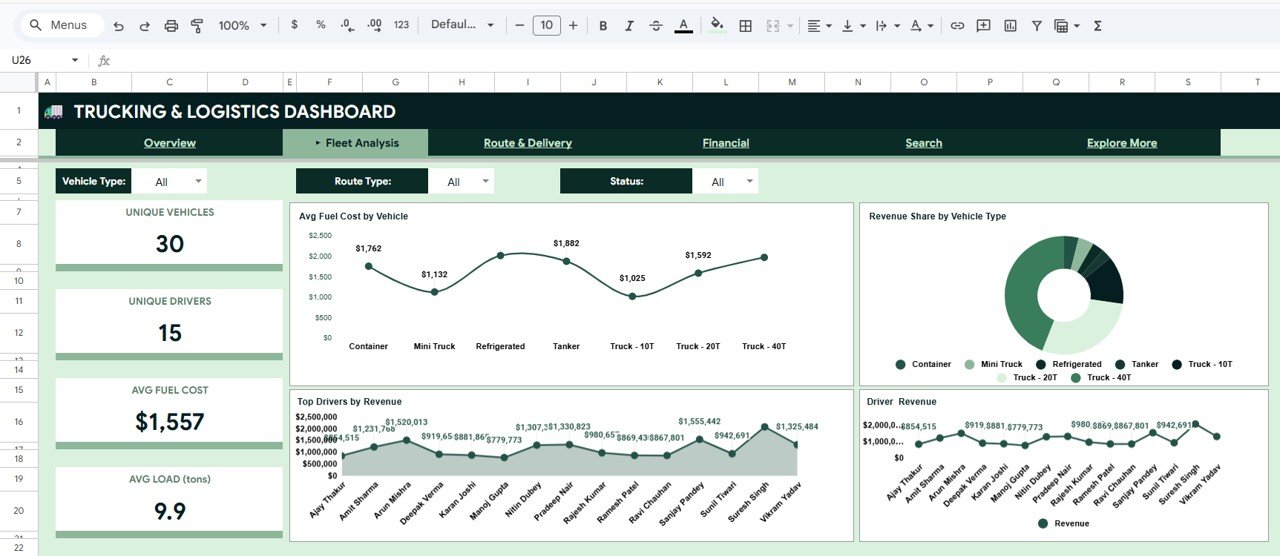
2. Fleet Analysis Page
The Fleet Analysis page focuses on vehicle and driver performance. It includes:
- Avg Fuel Cost by Vehicle — identify fuel-hungry vehicles that are eating into margins.
- Revenue Share by Vehicle Type — see which vehicle categories generate the largest share of revenue.
- Top Drivers by Revenue — reward high-performers with data, not guesswork.
- Driver Revenue by Driver Name — dig into per-driver revenue contribution across the full roster.
This page turns raw fleet data into clear decisions: which trucks to retire, which drivers deserve bonuses, and which vehicle types deserve more investment.
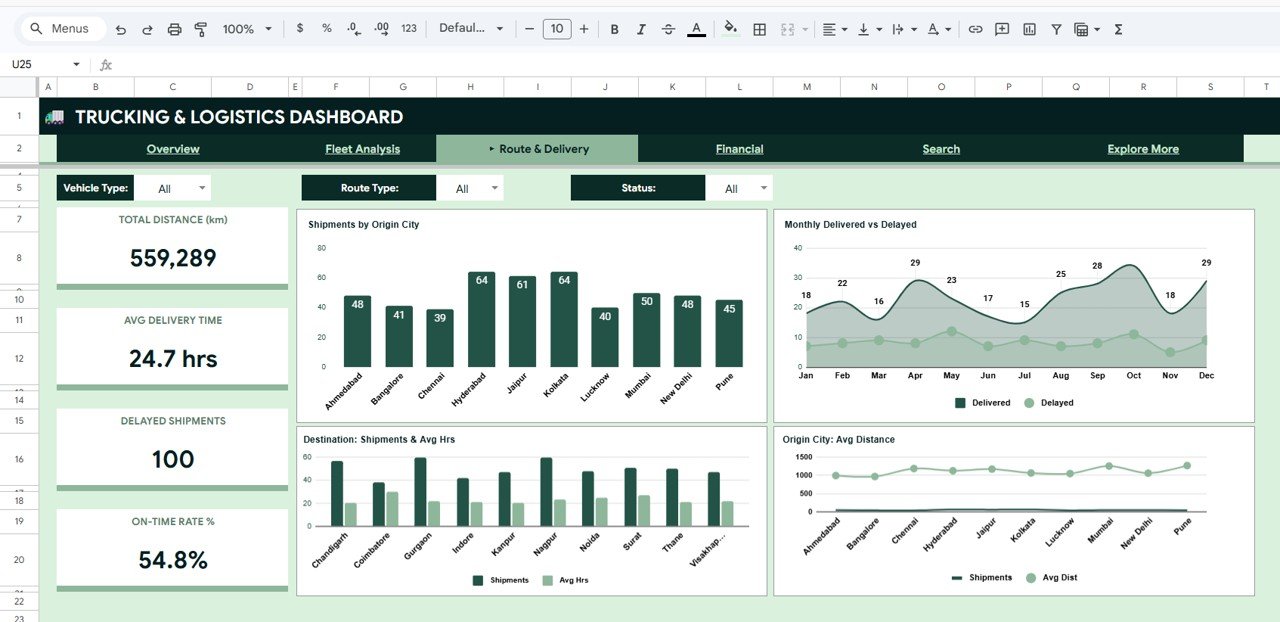
3. Route & Delivery Page
👉 Click here to Purchase the Trucking and Logistics Dashboard in Google Sheets
Route-level performance drives profitability in trucking. This page visualizes:
- Shipments by Origin City — see where your volume is concentrated.
- Monthly Delivered vs Delayed by Month — identify seasonal delay spikes and operational bottlenecks.
- Destination Shipments and Avg Hrs by Destination City — combine volume and delivery time in a single view.
- Origin City Avg Distance by Origin City — benchmark average trip length across hubs.
Together these charts help logistics coordinators optimize shipping lanes, reduce delivery delays, and right-size capacity at each origin hub.
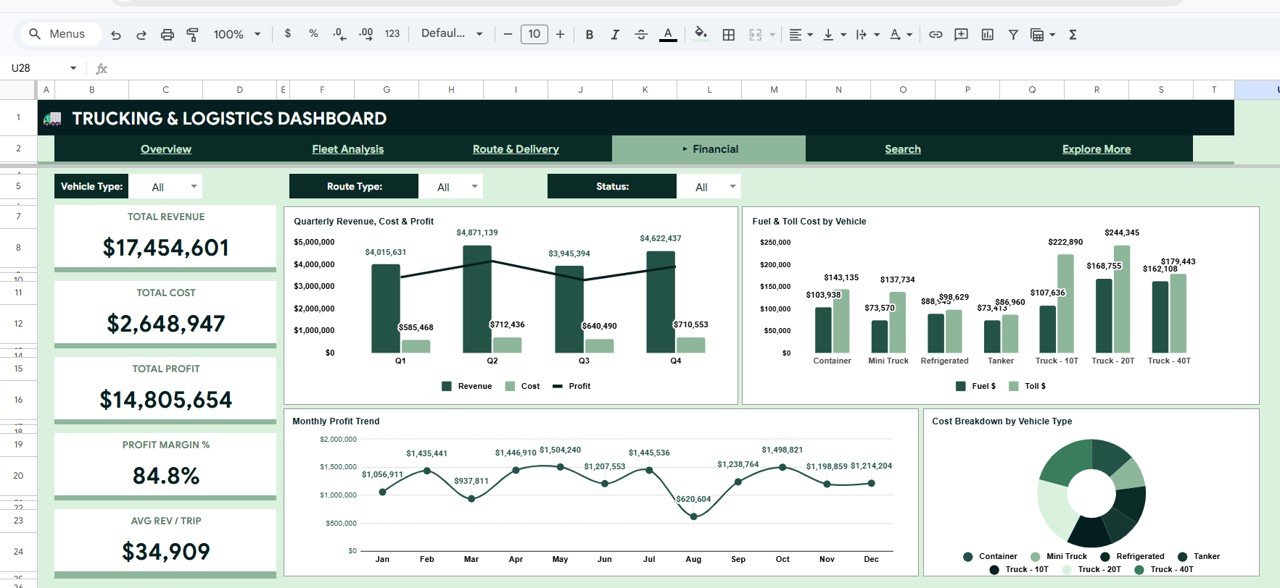
4. Financial Page
The Financial page is built for CFOs, business owners, and finance teams. It includes:
- Quarterly Revenue, Cost and Profit by Quarter — track the top line, bottom line, and margin over time.
- Fuel and Toll Cost by Vehicle Type — compare operating costs across vehicle categories.
- Monthly Profit Trend by Month — spot profit dips before they become losses.
- Cost Breakdown by Vehicle Type — understand total cost composition by asset class.
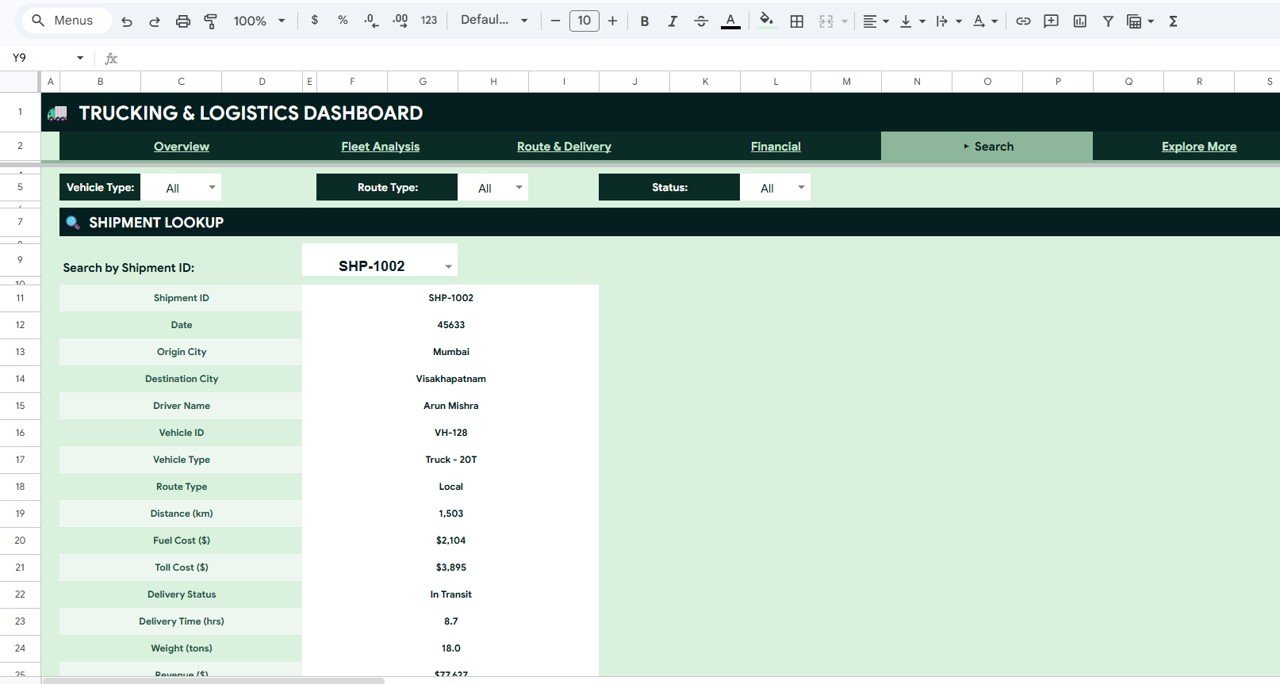
5. Search Sheet (Shipment Lookup)
👉 Click here to Purchase the Trucking and Logistics Dashboard in Google Sheets
Every fleet manager has been asked “What happened with shipment #X?” — usually urgently. The Search Sheet answers that in seconds. Select any Shipment ID from the dropdown and the sheet instantly displays all 15 fields for that shipment: Shipment ID, Date, Origin City, Destination City, Driver Name, Vehicle ID, Vehicle Type, Route Type, Distance (km), Fuel Cost, Toll Cost, Delivery Status, Delivery Time (hrs), Weight (tons), and Revenue. No filtering, no sorting — just a clean lookup.
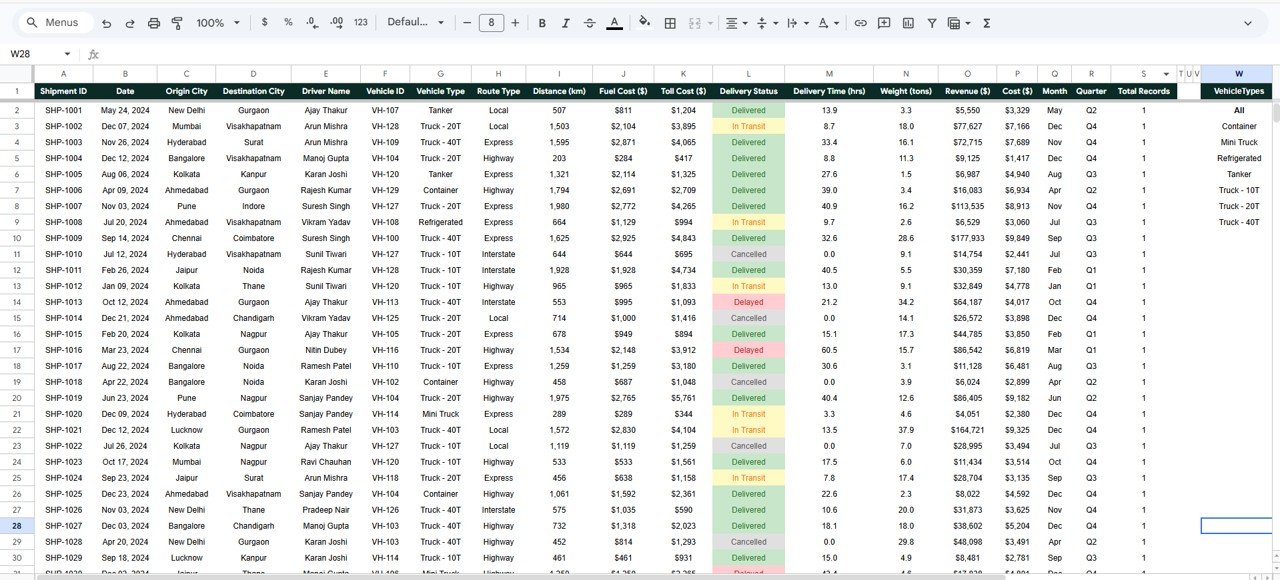
6. Data Sheet
👉 Click here to Purchase the Trucking and Logistics Dashboard in Google Sheets
The Data Sheet is where your trucking records live. Add new shipment rows in the same column structure as the sample data and every chart, KPI card, and dropdown on the other pages updates automatically. The sheet is designed to handle thousands of records without performance issues.
Advantages of the Trucking and Logistics Dashboard in Google Sheets
- Zero software installation — runs entirely in Google Sheets, so there’s nothing to install or license.
- Real-time collaboration — multiple dispatchers, managers, and analysts can work on the same sheet simultaneously.
- Shareable anywhere — send a link and your team can view the dashboard on desktop, tablet, or phone.
- Auto-refreshing charts — no “Refresh All” button needed; charts react to data changes instantly.
- Affordable — a fraction of the cost of enterprise transportation management systems (TMS).
- Beginner-friendly — if you can open Google Sheets, you can use this dashboard.
- Version history built-in — Google Drive keeps every version automatically; never lose a change.
Opportunities for Improvement
As with any template, there are areas where a custom build might serve you even better. For very large fleets (10,000+ shipments per month), performance may slow as the Data sheet grows — consider archiving older records or moving to BigQuery-backed Connected Sheets. Users who need predictive analytics (forecasted delivery time, churn risk by customer, dynamic fuel cost modeling) will want to layer on Google Apps Script or connect the sheet to a BI tool. And while the built-in slicers are fast, teams used to Power BI-style cross-filtering between charts may want the Excel version of this dashboard or a dedicated Power BI build. Finally, this template is a reporting dashboard — it does not replace a dispatch system or a GPS tracker.
Best Practices for Using This Trucking Dashboard
👉 Click here to Purchase the Trucking and Logistics Dashboard in Google Sheets
- Keep column structure identical. The charts depend on exact column names and positions. Add new columns at the right of the Data sheet rather than inserting them in the middle.
- Use consistent values for dropdown fields. Vehicle Type, Route Type, and Delivery Status should use a fixed set of values. Typos create duplicate chart categories.
- Update daily, not weekly. Trucking KPIs move fast. A 24-hour refresh cadence keeps the dashboard relevant for decision-making.
- Use slicers before exporting. Filter to the date range or region you care about, then export the view as PDF for management meetings.
- Duplicate the sheet by quarter. For long-term trend analysis, keep a rolling 12-month dashboard and an archive sheet for historical data.
- Protect the dashboard tabs. Use Google Sheets’ Protect Range feature so dispatchers can update the Data sheet but can’t accidentally break chart formulas.
Explore Relevant Templates
If you liked this trucking dashboard, you may also find these templates useful:
- Trucking and Logistics Dashboard in Excel — the Excel version with pivot-powered charts and 5 analysis pages for desktop users.
- Fleet Management Dashboard in HTML — browser-based fleet analytics with no software dependency.
- Warehouse Efficiency Dashboard in Excel — pair trucking with warehouse analytics for end-to-end supply chain visibility.
- Google Sheets Dashboards — explore our full collection of Google Sheets analytics templates.
- Shopify Store Dashboard in Google Sheets — great companion for e-commerce trucking businesses.
FAQs
👉 Click here to Purchase the Trucking and Logistics Dashboard in Google Sheets
What is the best Google Sheets template for tracking trucking and logistics performance?
The Trucking and Logistics Dashboard in Google Sheets from NextGenTemplates is a comprehensive trucking analytics template featuring 5 interactive pages, a Shipment Lookup search feature, 5 KPI cards, and 16+ dynamic charts covering revenue, cost, fleet, routes, and financials — making it one of the most complete Google Sheets logistics templates available for fleet managers and trucking businesses.
How do I track shipments and on-time delivery in Google Sheets?
Open the Trucking and Logistics Dashboard in Google Sheets, go to the Data tab, and enter each shipment as a row with fields like Shipment ID, Origin, Destination, Delivery Status, and Delivery Time. The Overview page automatically calculates Total Shipments and On-Time Delivery %, and the Route & Delivery page shows Monthly Delivered vs Delayed trends.
Do I need Google Sheets scripting or add-ons to use this dashboard?
No. The Trucking and Logistics Dashboard in Google Sheets uses only native Google Sheets features — formulas, pivot tables, dropdowns, and charts. There are no Apps Script files, no add-ons, and no permissions requests beyond making a copy of the sheet.
Can I share this Google Sheets trucking dashboard with my team?
Yes. After making your own copy in Google Drive, click the Share button in the top right and add team members by email with view or edit access. Multiple users can edit the Data sheet simultaneously and see live dashboard updates.
How many shipment records can the Trucking and Logistics Dashboard handle?
Google Sheets supports up to 10 million cells per workbook. In practice, this dashboard handles tens of thousands of shipment rows comfortably. For very large fleets, consider archiving records older than 12 months into a separate archive sheet.
How is this different from the Excel version of the trucking dashboard?
The Google Sheets version is cloud-based, collaborative, and requires no software — ideal for teams spread across multiple locations. The Excel version uses pivot tables and a dedicated Support sheet and is better suited for desktop users who prefer Excel’s formula engine and need offline access.
Conclusion
Whether you manage a 10-truck fleet or oversee a multi-region logistics operation, the Trucking and Logistics Dashboard in Google Sheets gives you the KPI cards, charts, and shipment lookup you need to run a tighter, more profitable trucking business. It is cloud-native, shareable, fully editable, and ready to use in under 5 minutes.
👉 Click here to Purchase the Trucking and Logistics Dashboard in Google Sheets
For step-by-step video tutorials on Google Sheets dashboards, Apps Script automation, HTML dashboards, SQL, and more, visit our YouTube channel:
🎥 YouTube.com/@NeoTechNavigators
For more help with Google Sheets, refer to the official Google Sheets Help Center.