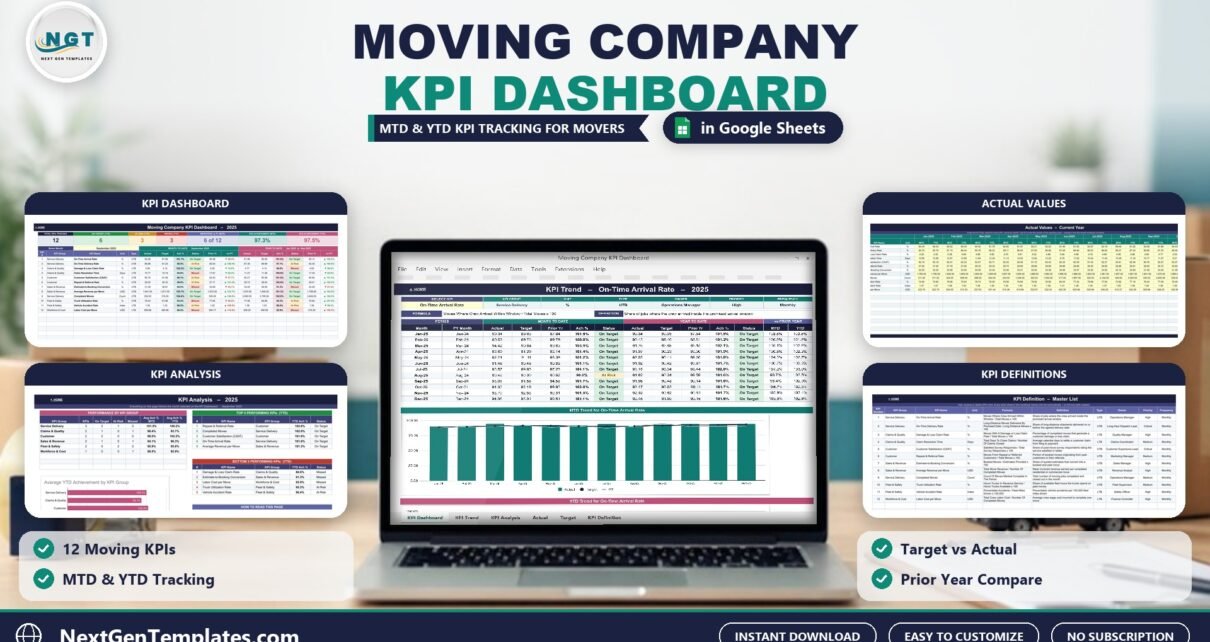
A Google Sheets KPI dashboard for moving companies: 12 KPIs in six groups, MTD and YTD against target and prior year, traffic lights, a KPI Trend page and group analysis.
Online Tutorial for Data Analysis and Automation
A Google Sheets KPI dashboard for moving companies: 12 KPIs in six groups, MTD and YTD against target and prior year, traffic lights, a KPI Trend page and group analysis.
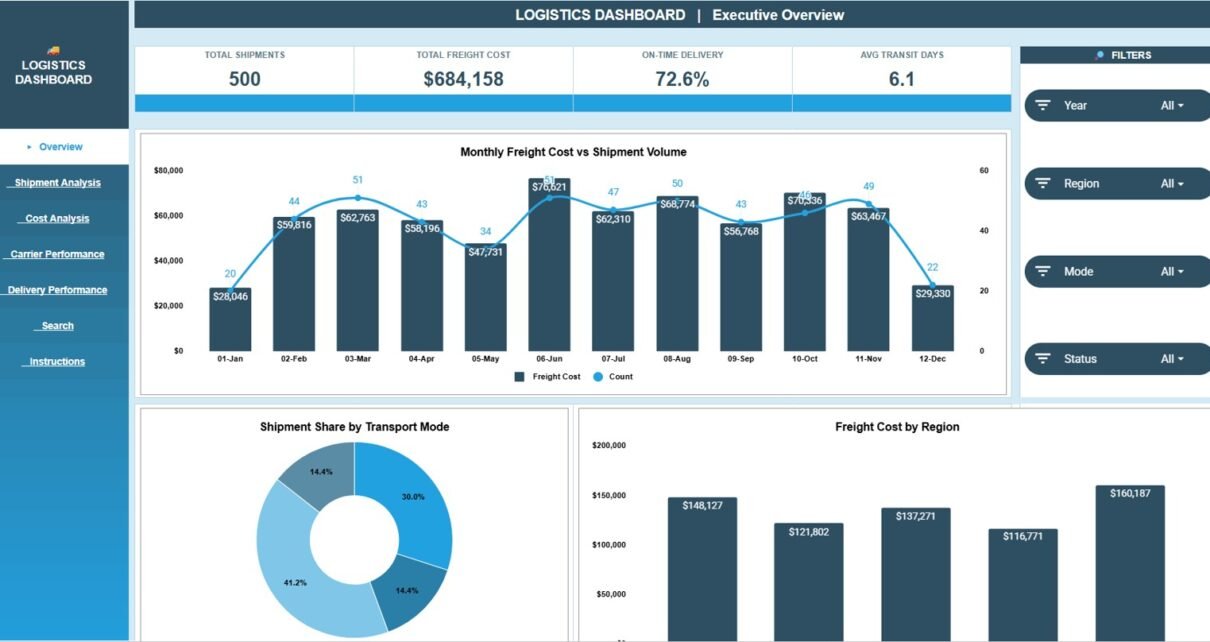
Review shipment volume, freight cost, carrier performance, on-time delivery and transit days with the Logistics Dashboard in Google Sheets: 4 KPIs, 15 charts, slicers and Shipment ID lookup.
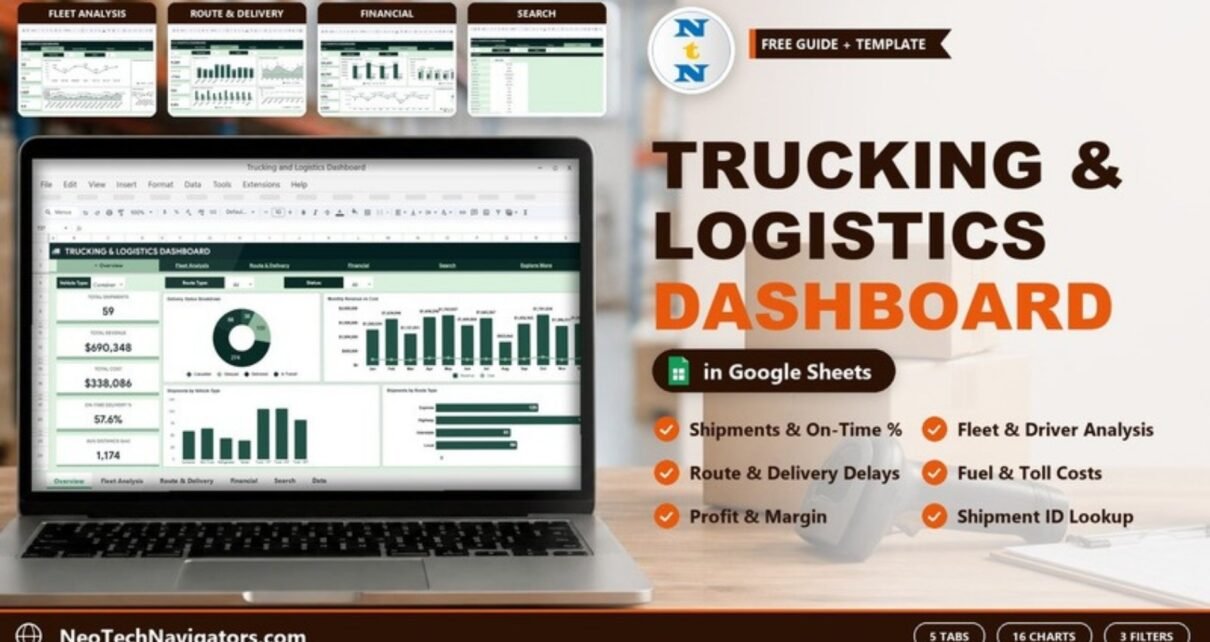
A Google Sheets trucking and logistics dashboard with Overview, Fleet Analysis, Route & Delivery, Financial and Search tabs that tracks shipments, on-time delivery, fuel and toll costs and profit.
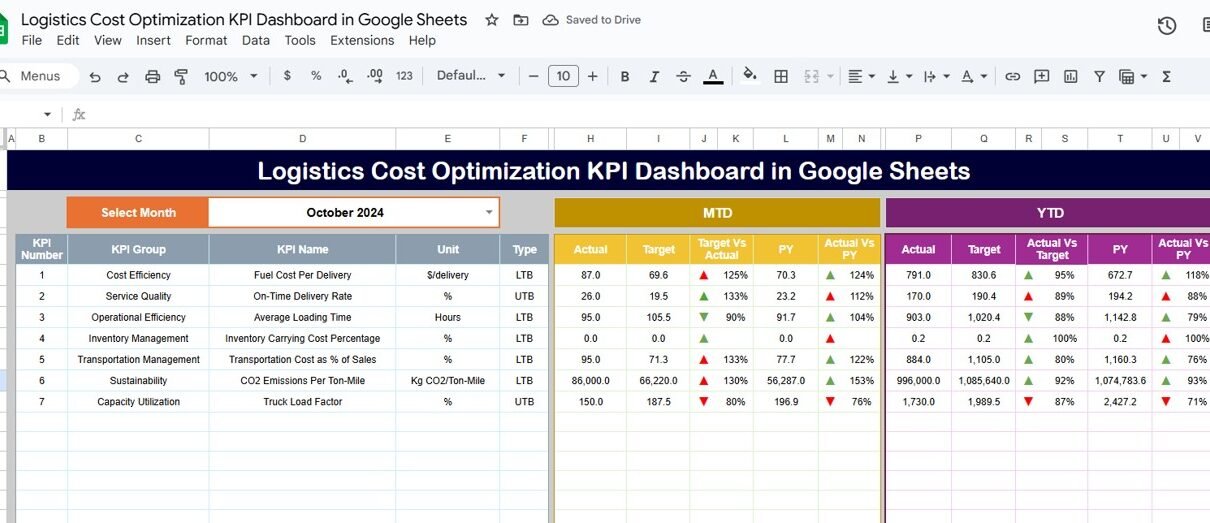
Managing Logistics Cost Optimization KPI Dashboard in Google Sheets costs is one of the most important priorities for supply chain, procurement, warehousing, and distribution teams. When transport costs rise, warehouse efficiency drops, or order accuracy suffers, the entire supply chain becomes expensive and inefficient. To reduce cost leaks, improve productivity, and strengthen operational visibility, organizations […]
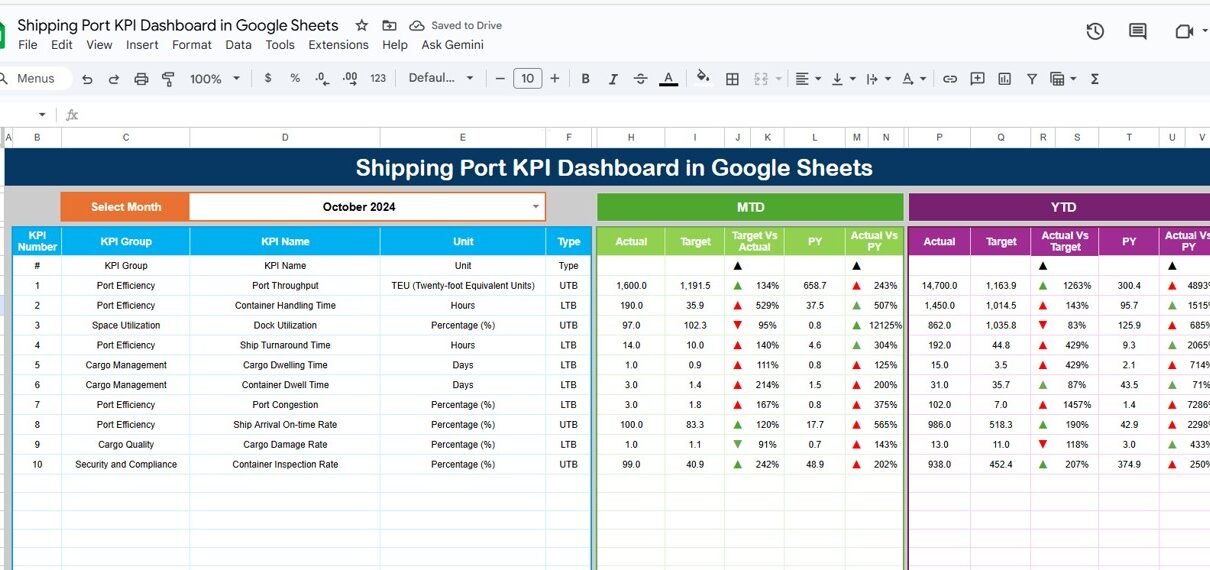
Managing port operations involves monitoring vessel movements, cargo throughput, and resource utilization to ensure smooth and efficient logistics. The Shipping Port KPI Dashboard in Google Sheets is a ready-to-use, data-driven solution that provides a complete overview of port performance — enabling port authorities, logistics managers, and terminal operators to make informed decisions. This article explains […]