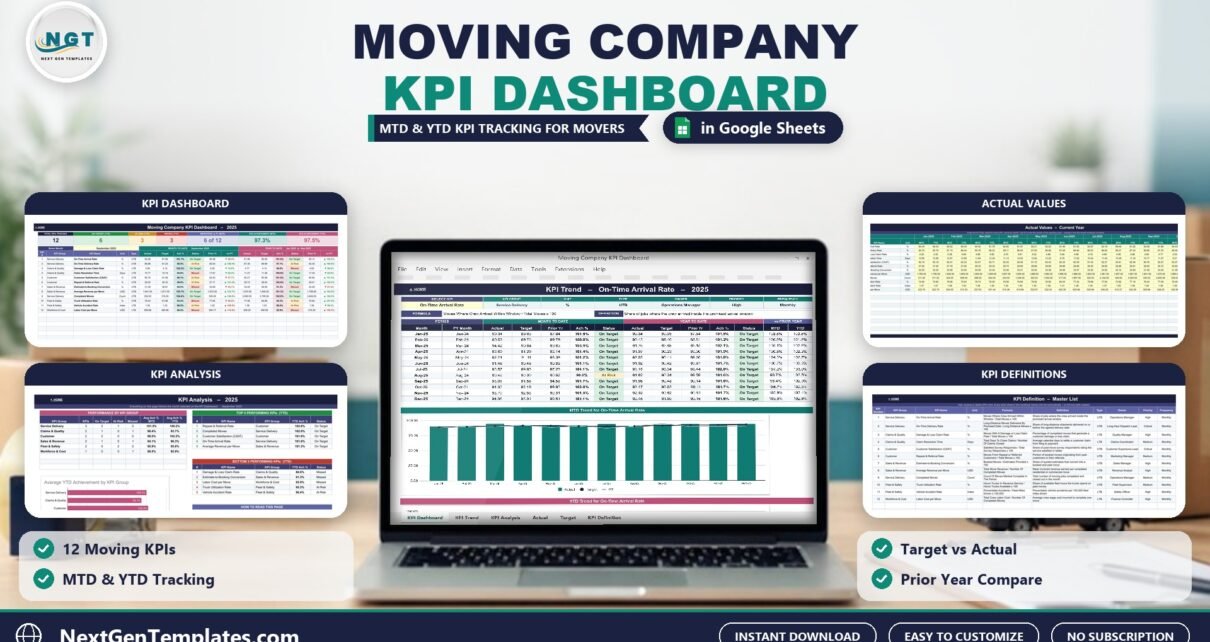
The Moving Company KPI Dashboard in Google Sheets tracks 12 moving company KPIs across 6 KPI groups, and shows each one for the selected month and the year to date against target and prior year. It has 11 tabs, 7 summary cards, and room for 22 KPIs, and every number is a plain worksheet formula with no Apps Script or add-on behind it.
Most moving companies know their busy season by feel, but not whether on-time arrivals, damage claims or labor cost per move are actually improving. Paid moving software can report on that, but it comes with a monthly subscription and a long onboarding. This Google Sheets template gives an owner or operations manager one monthly scorecard they can fill in from their own records in about ten minutes.
Get the Moving Company KPI Dashboard in Google Sheets
Key Features of the Moving Company KPI Dashboard in Google Sheets
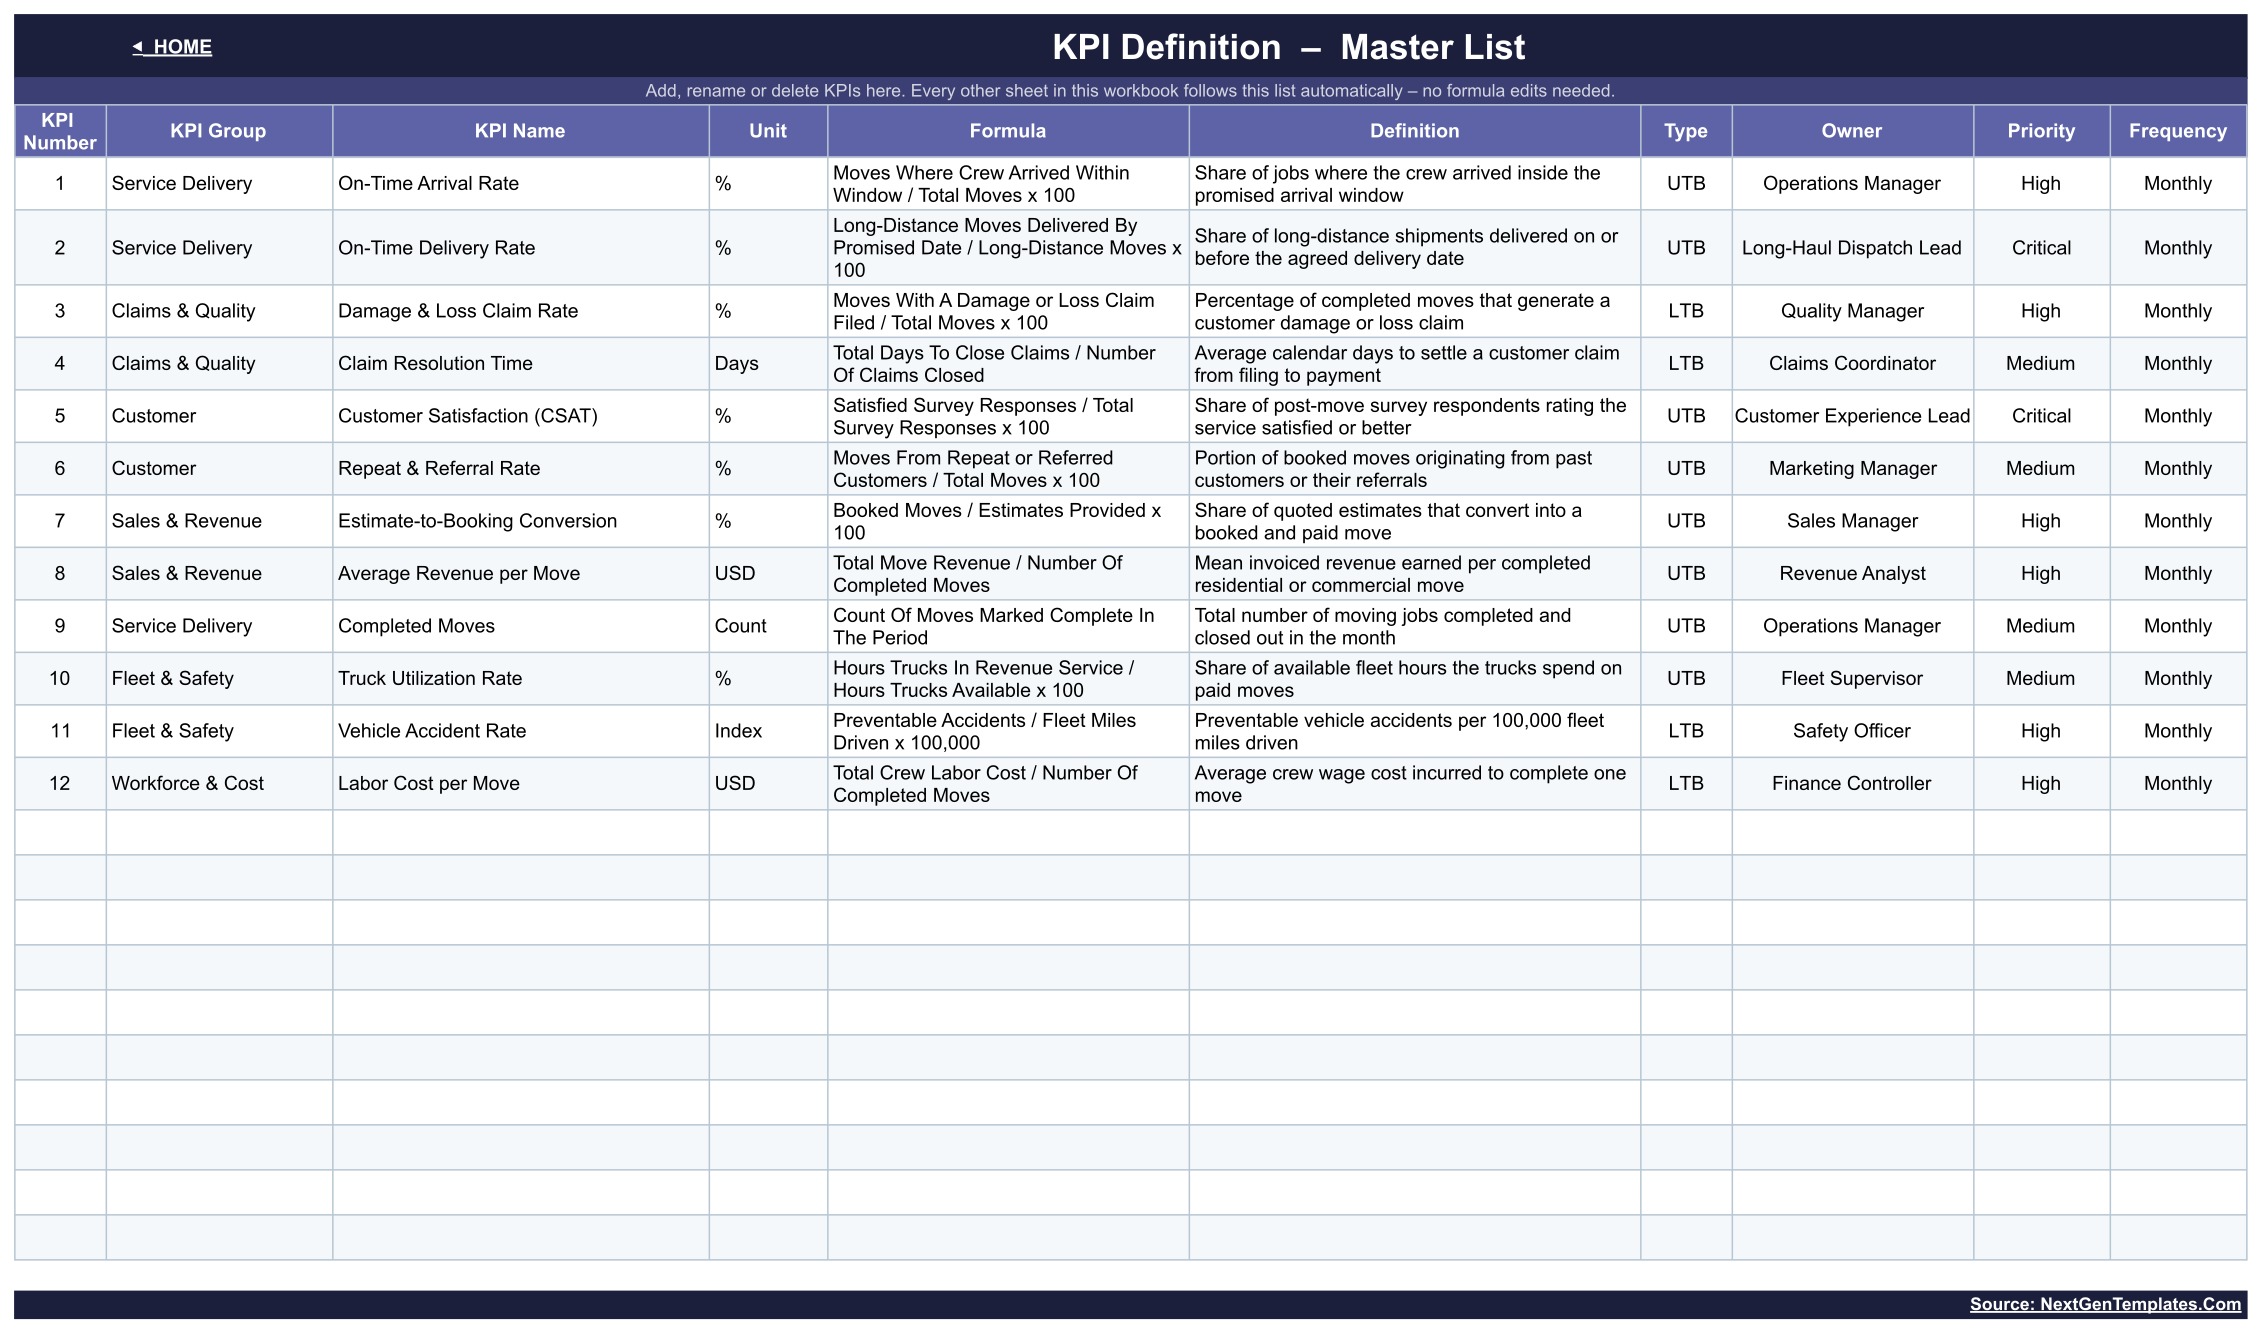
- 12 moving company KPIs: On-Time Arrival Rate, On-Time Delivery Rate, Completed Moves, Damage & Loss Claim Rate, Claim Resolution Time, Customer Satisfaction (CSAT), Repeat & Referral Rate, Estimate-to-Booking Conversion, Average Revenue per Move, Truck Utilization Rate, Vehicle Accident Rate and Labor Cost per Move.
- Six KPI groups: Service Delivery, Claims & Quality, Customer, Sales & Revenue, Fleet & Safety, and Workforce & Cost.
- Direction-aware scoring: 8 KPIs are Upper The Better and 4 are Lower The Better. For an LTB KPI, achievement is Target divided by Actual, so a claim rate or labor cost below target scores above 100%.
- Traffic-light status: On Target from 100%, At Risk from 95% to 99%, Missed below 95%, with thresholds you can edit in the Status formulas.
- One month picker: a dropdown on the KPI Dashboard drives the scorecard, the seven cards and the KPI Analysis page.
- Room for 22 KPIs: add or rename a KPI on KPI Definition and every sheet follows without formula changes.
Dashboard Pages Explanation
Home
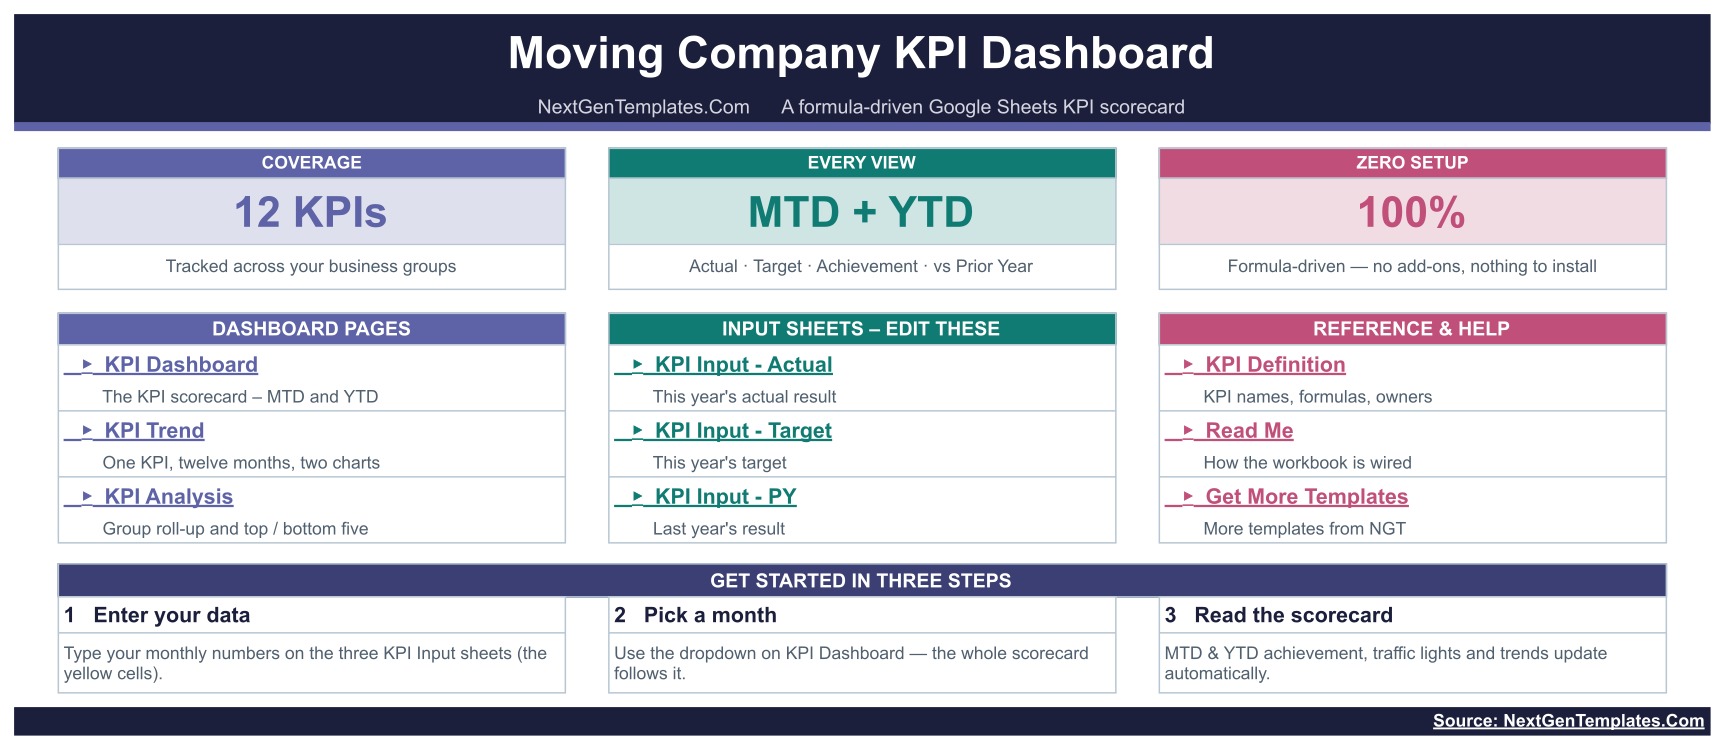
The Home tab links to the three dashboard pages, the three input sheets and the reference sheets, and sets out the three steps: enter your data, pick a month, read the scorecard.
KPI Dashboard
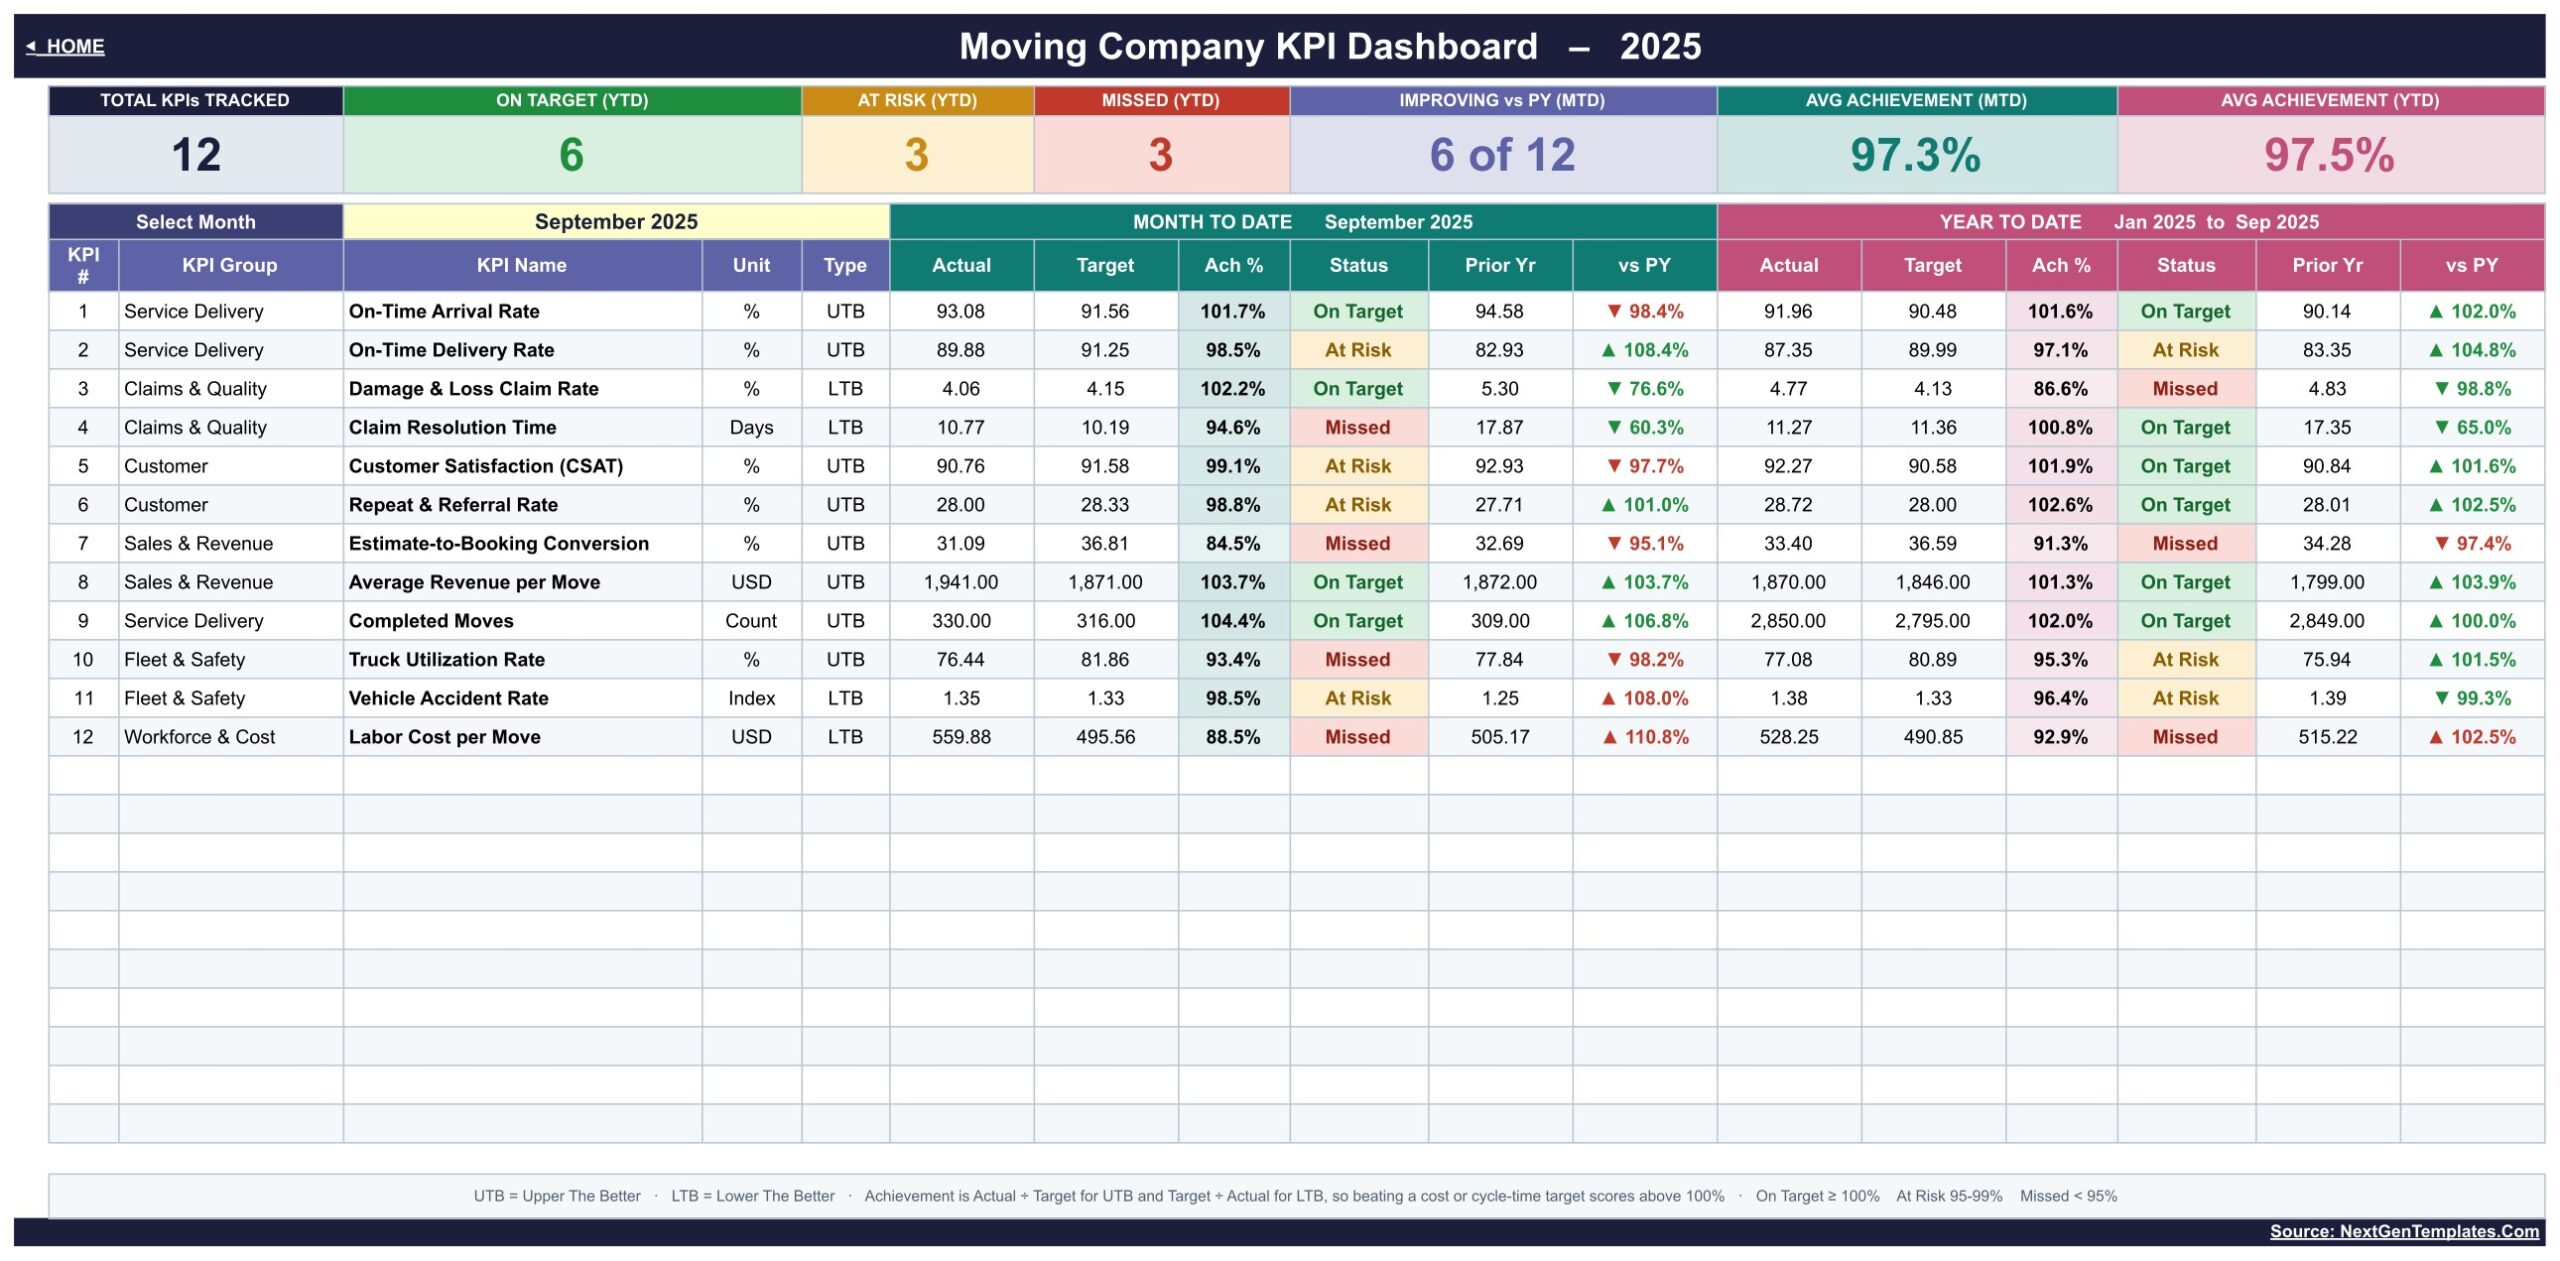
The main page shows seven cards: Total KPIs Tracked, On Target (YTD), At Risk (YTD), Missed (YTD), Improving vs PY (MTD), Avg Achievement (MTD) and Avg Achievement (YTD). With September 2025 selected, the sample data shows 6 KPIs On Target, 3 At Risk and 3 Missed for the year, 6 of 12 improving on last year, and average achievement of 97.3% MTD and 97.5% YTD.
Below the cards, each KPI row shows group, name, unit and type, then MTD and YTD actual, target, Ach %, status, prior year and vs PY. For example, Damage & Loss Claim Rate came in at 4.06% against a 4.15% target, which scores 102.2% because lower is better. Labor Cost per Move, at $559.88 against $495.56, is Missed at 88.5%.
KPI Trend
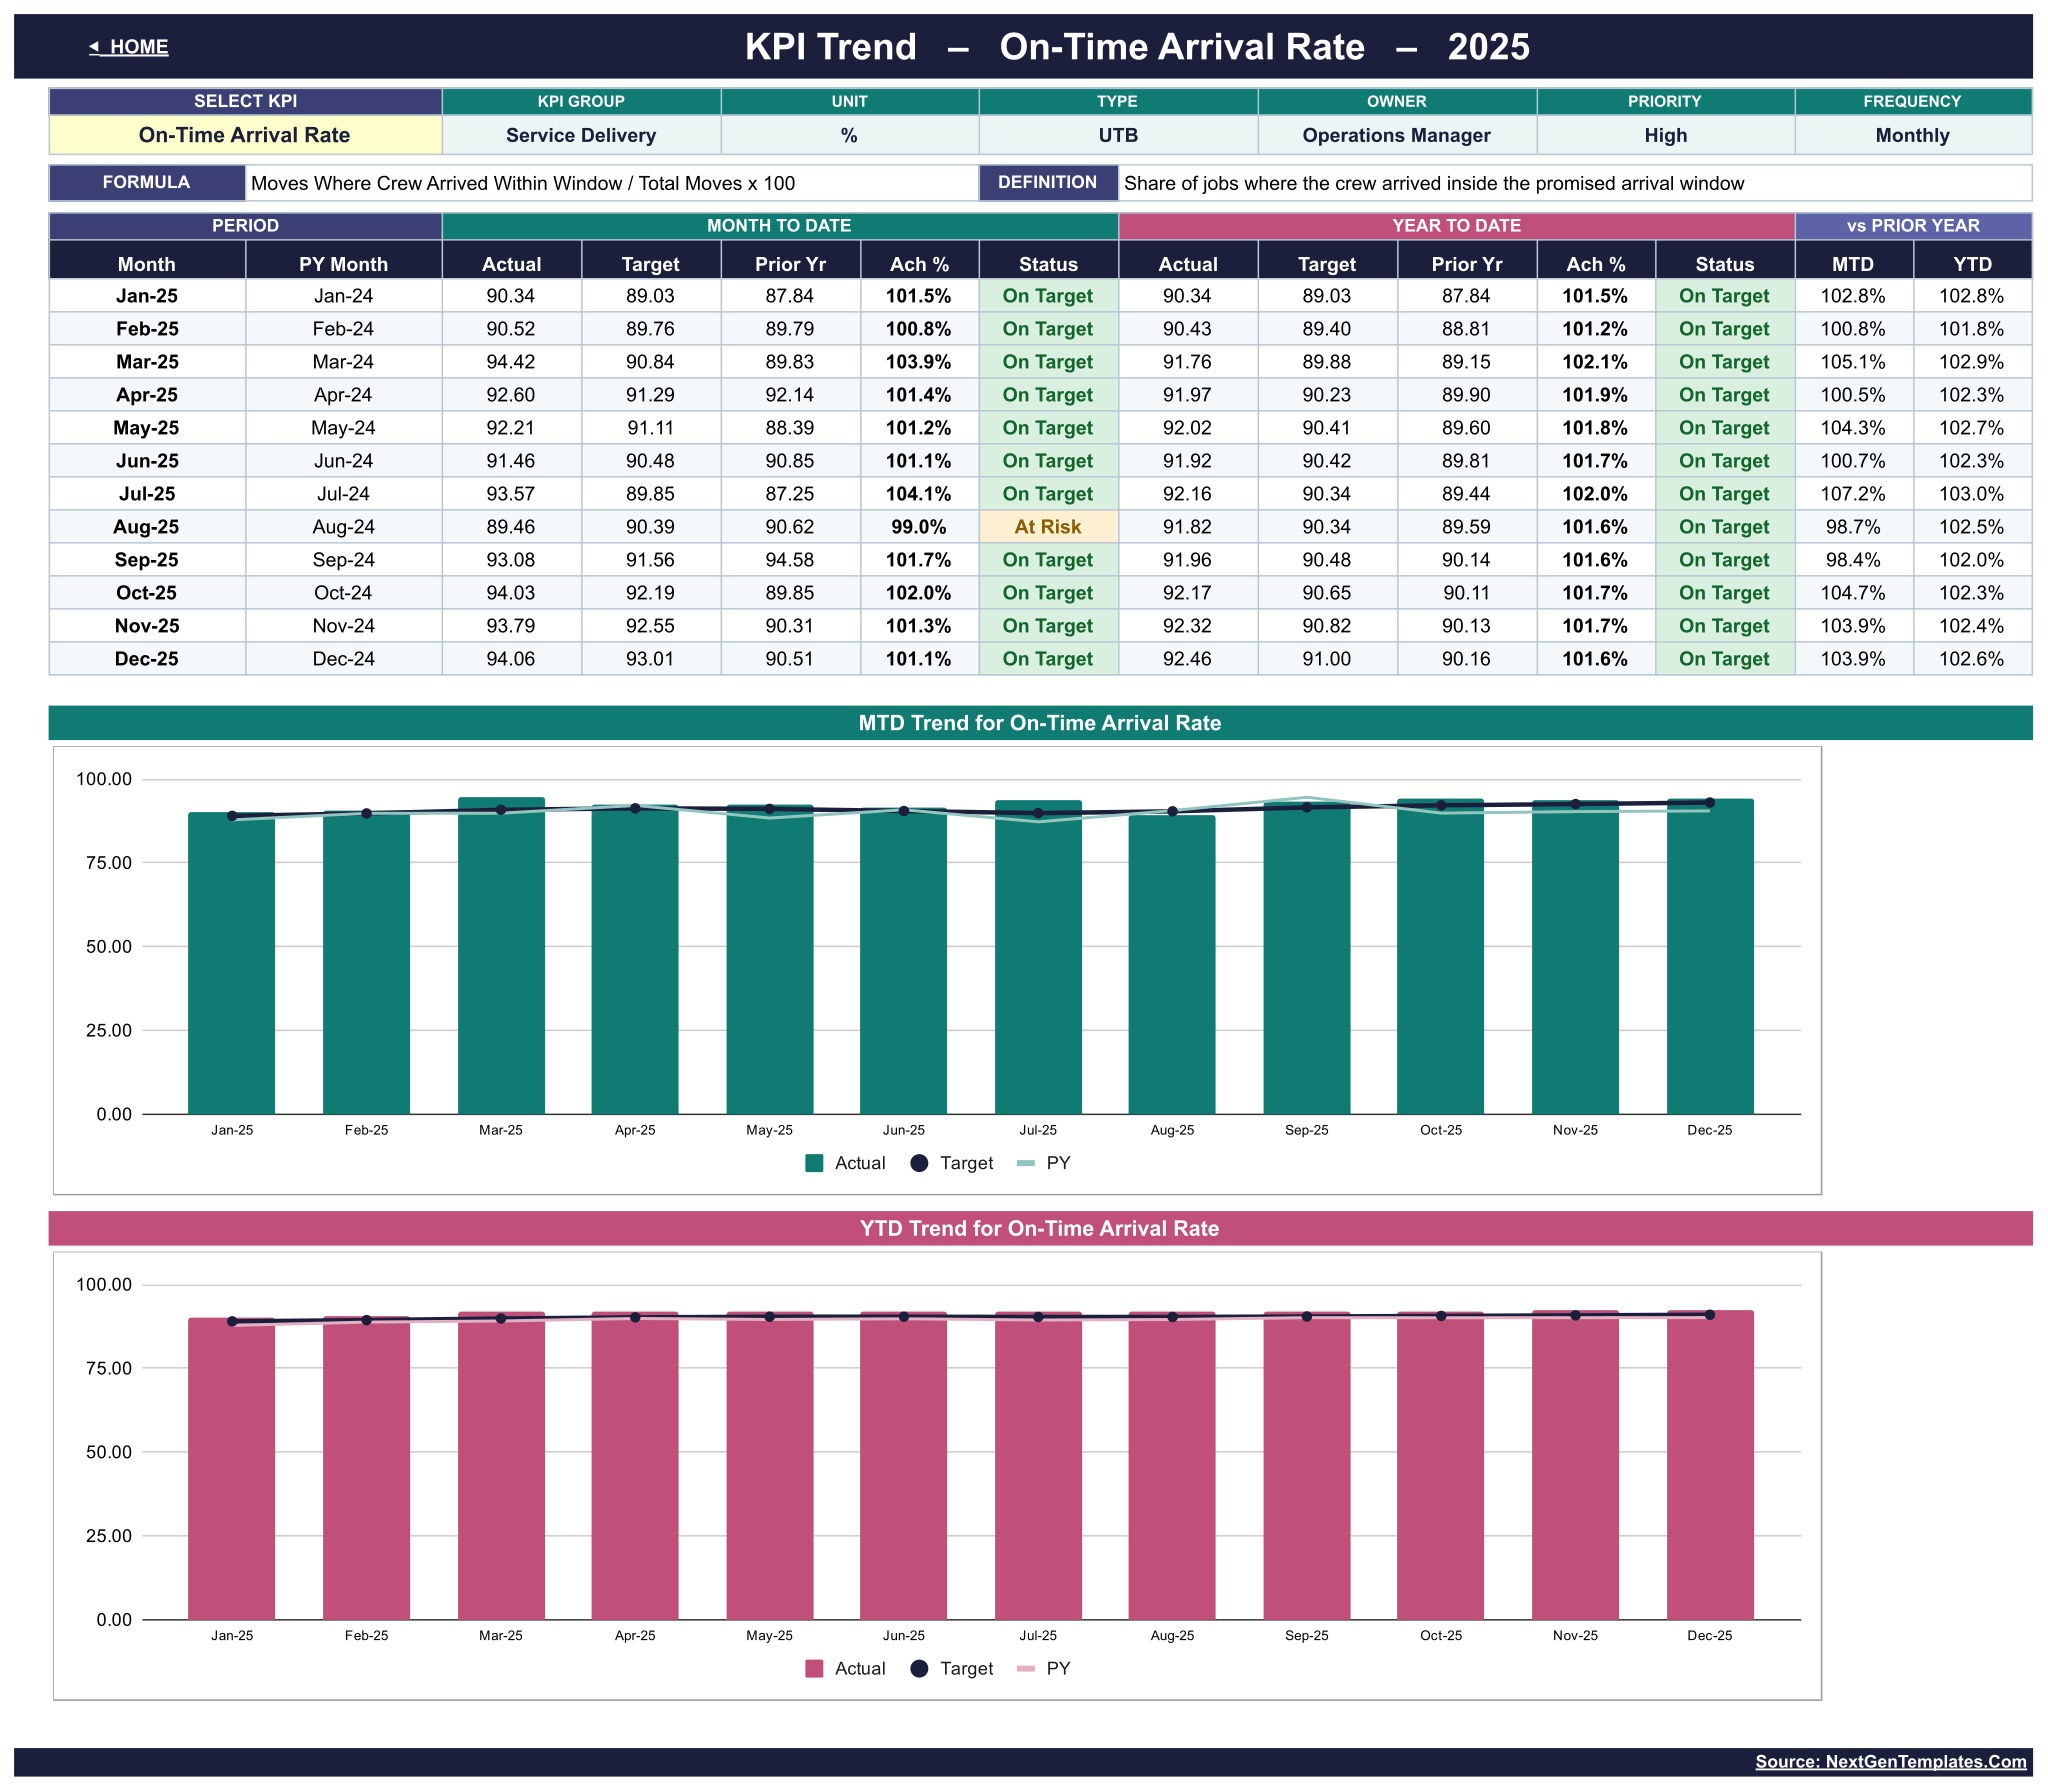
Select any KPI to see its group, unit, type, owner, priority, frequency, formula and definition, a twelve-month table of MTD and YTD figures, and two charts: MTD Actual, Target and PY by Month, and YTD Actual, Target and PY by Month. The sample shows On-Time Arrival Rate On Target in 11 of 12 months, dipping to At Risk in August.
KPI Analysis
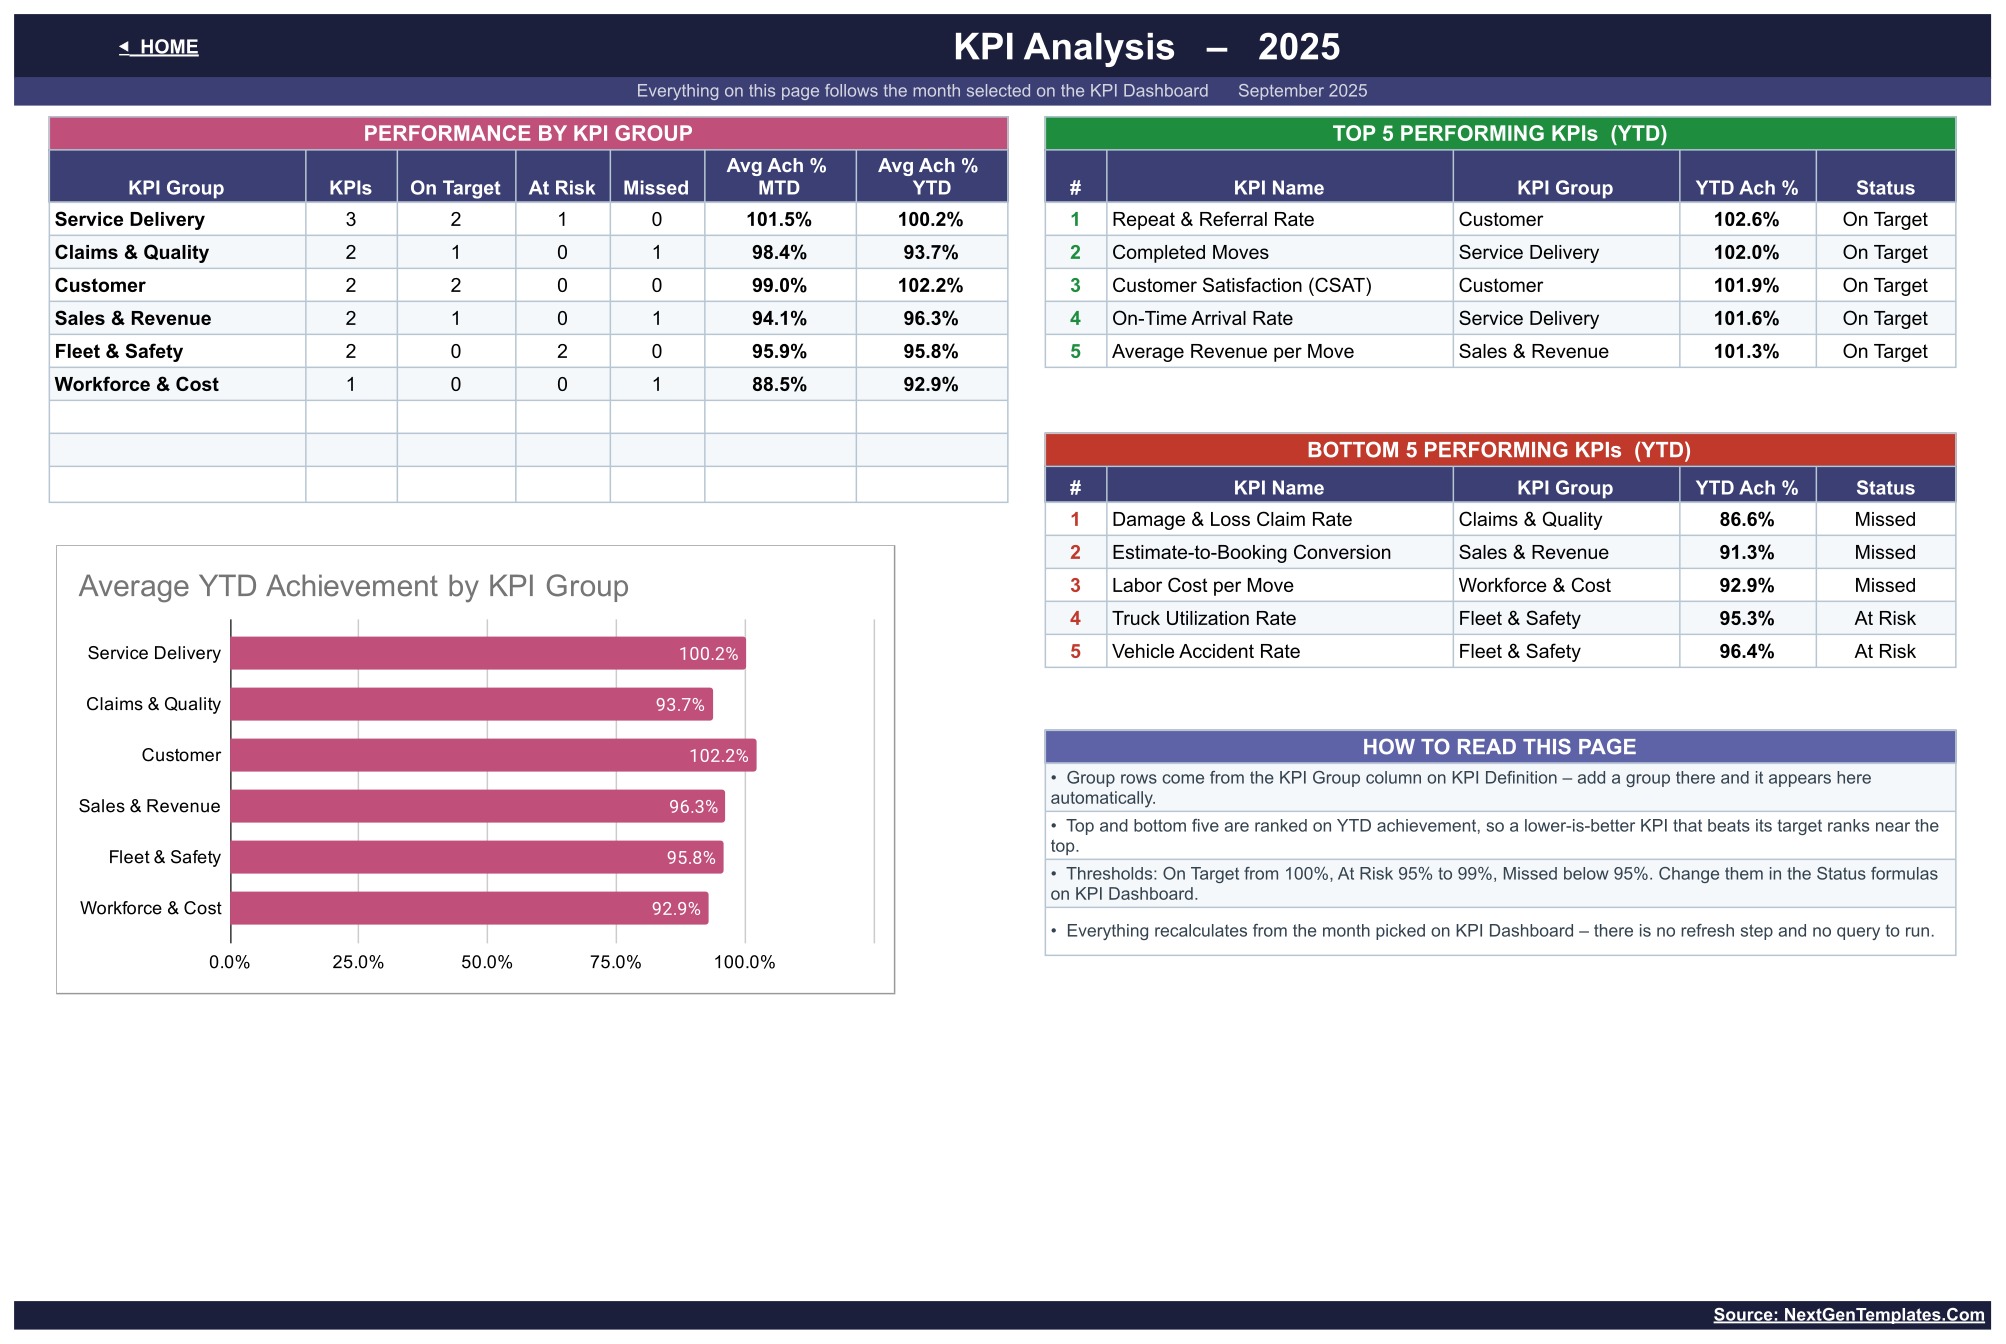
This page rolls every KPI up by group: KPI count, On Target, At Risk, Missed, and average achievement MTD and YTD. An Average YTD Achievement by KPI Group chart sits beneath it, next to Top 5 and Bottom 5 Performing KPIs tables. In the sample, Repeat & Referral Rate leads at 102.6% YTD, while Damage & Loss Claim Rate trails at 86.6%.
KPI Input – Actual, Target and PY
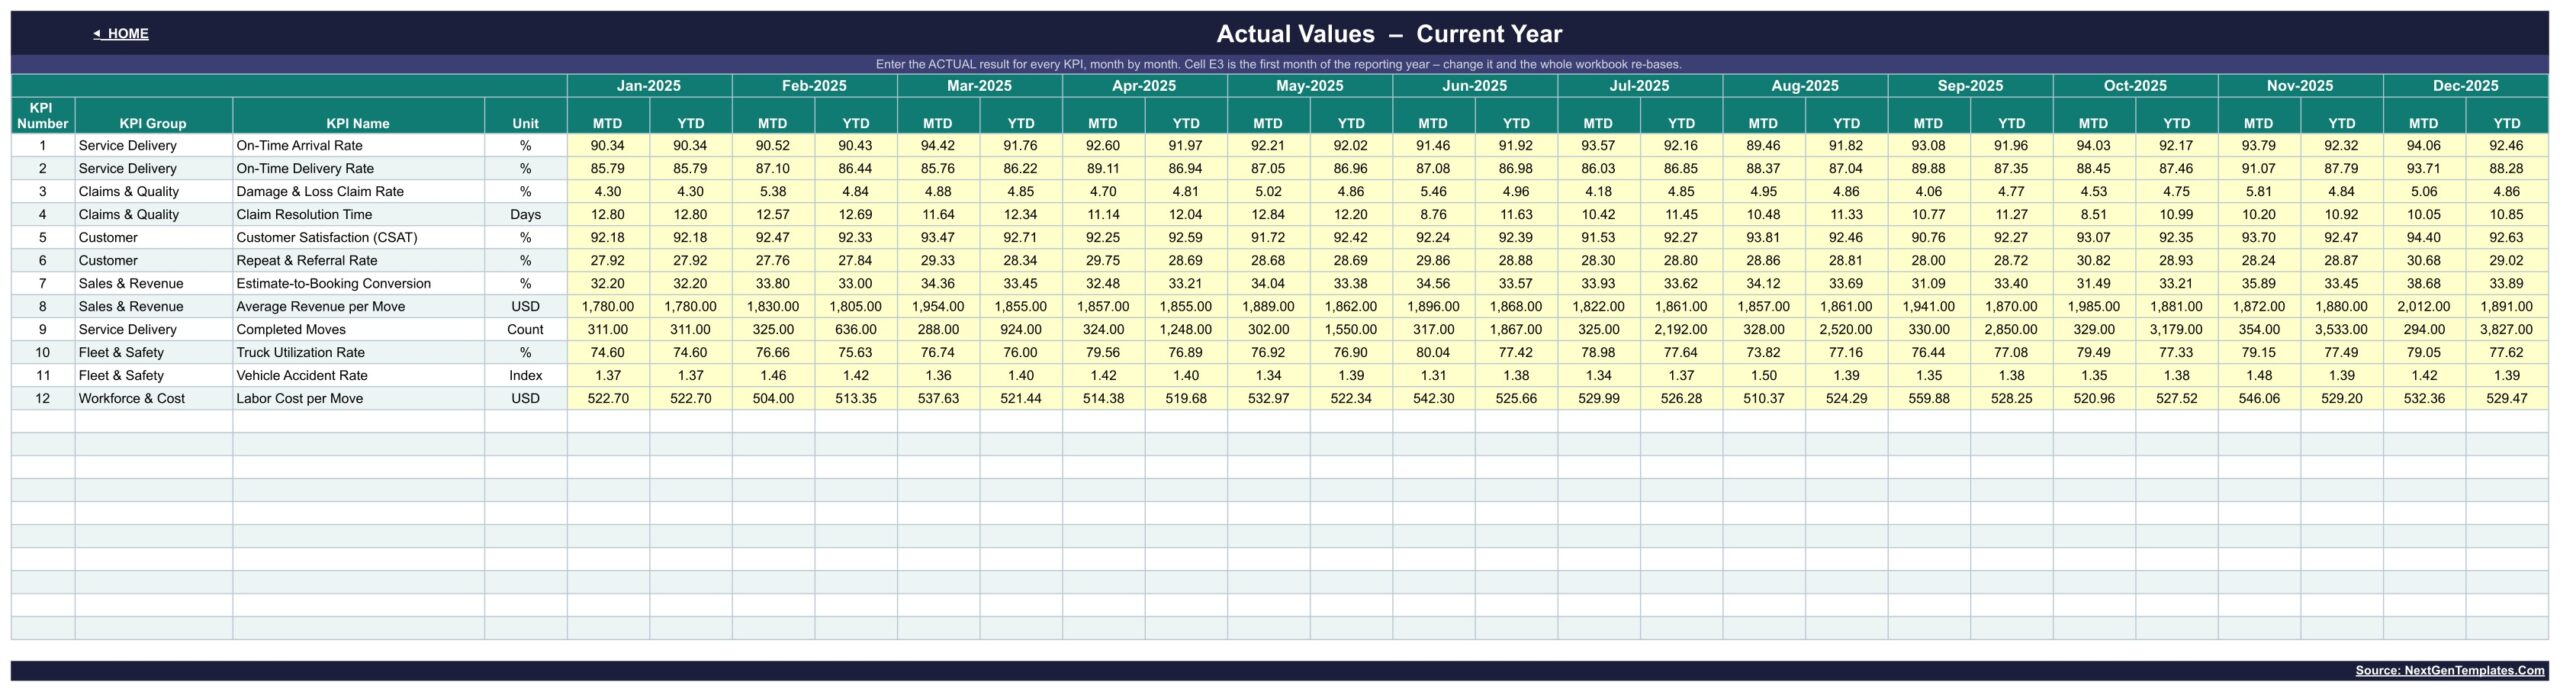
These three sheets are where you type. Each month has an MTD and a YTD column, and cell E3 on the Actual sheet sets the first month of the reporting year. YTD is typed, not derived, so you decide whether a KPI’s YTD is a cumulative total, such as Completed Moves, or a running average, such as a rate.
KPI Definition
The master list holds each KPI’s number, group, name, unit, formula, definition, UTB/LTB type, owner, priority and frequency. Owners range from the Operations Manager to the Safety Officer and Finance Controller.
Moving Company KPI Dashboard vs. Excel vs. Paid Moving Software: Feature Comparison
| Feature | Moving Company KPI Dashboard in Google Sheets | Microsoft Excel KPI Dashboard | Paid moving software (SmartMoving / Supermove) |
|---|---|---|---|
| Cost | ✅ One-time payment | One-time, plus an Excel licence | Monthly subscription |
| Platform | ✅ Any browser, free Google account | Excel desktop or web | Vendor cloud app |
| Setup time | ✅ About 10 minutes | About 10 minutes | Days to weeks |
| Real-time team collaboration | ✅ Native sharing | Via OneDrive / SharePoint | ✅ Yes |
| Mobile access | ✅ Google Sheets app | Excel app | ✅ Yes |
| Customizable KPIs | ✅ Up to 22 | Varies by template | Fixed vendor reports |
| Share with link | ✅ Yes | Limited | User seats only |
| Booking, dispatch and invoicing | No, KPI reporting only | No | ✅ Yes |
| Year-1 cost at 5 users | ✅ No seat fees | Plus Microsoft 365 | Recurring fees |
For movers who want monthly KPI reporting without paying for a full moving CRM, this template sits in the sweet spot.
Who Should Use This Template
Perfect for:
- Owners of local and long-distance moving companies with 2 to 50 trucks
- Operations, sales and fleet managers who run a monthly review
- Franchise groups that want every branch to report the same moving company KPIs
Not a fit if:
- You need booking, crew dispatch, GPS tracking or invoicing. It does not connect to a TMS, CRM or GPS feed.
- You need DOT, FMCSA, licensing or insurance compliance reporting. It provides none.
- You want a claims management system. The damage and claim KPIs are numbers you type in.
Real-World Use Cases
Maria owns a six-truck local mover. On the first working day of each month she types last month’s numbers, then reviews On-Time Arrival Rate, Damage & Loss Claim Rate and Labor Cost per Move with her crew leads. The Bottom 5 table tells her where the next month’s attention goes.
Dev leads sales at a long-distance mover. He opens KPI Trend on Estimate-to-Booking Conversion and Average Revenue per Move to see whether a pricing change helped, month by month, against target and last year.
A three-branch franchise gives each branch its own copy of the sheet. Every owner reports the same 12 KPIs, so the group meeting compares like with like.
Advantages of the Moving Company KPI Dashboard
- Low cost: one purchase, no per-user or per-truck fees.
- Fast to adopt: anyone who can type numbers into a sheet can run it.
- Fair scoring: the UTB/LTB logic treats cost, claims and safety KPIs correctly.
- Shareable: send a view link to a partner or accountant with standard Google Sheets sharing.
- Extendable: 10 empty KPI rows are already wired in.
Opportunities for Improvement
- YTD values are typed on the input sheets rather than calculated from the monthly figures, so they must be kept consistent by hand.
- Data entry is manual; there is no import from moving software, a TMS or accounting tools.
- Status thresholds are the same for every KPI; per-KPI thresholds would need formula edits.
- The two trend charts show one KPI at a time.
Best Practices
- Agree each KPI’s formula and owner on KPI Definition before entering data.
- Decide once whether each KPI’s YTD is a sum or an average, and keep it that way all year.
- Set realistic targets from last year’s actuals, then adjust for season.
- Enter numbers on a fixed day each month and review the Bottom 5 table first.
- Learn the Google Sheets chart types if you want to add your own visuals.
Explore Relevant Templates
If you prefer a card-style layout, read about the Moving Company KPI Scorecard in Google Sheets, a different template family for the same trade. Rental fleets can use the Equipment Rental Business KPI Dashboard in Google Sheets, and freight operators can look at the Freight Forwarding Management System Web App.
Also available as: Moving Company KPI Dashboard in Excel (a separate build with 14 KPIs in different groups) and Moving Company KPI Scorecard in Excel. Browse every Google Sheets KPI dashboard in the store.
Want to build reporting skills like this step by step? The Excel Pivot Tables & Dashboards course on NextGenTemplates Academy walks you through it with practice files.
Frequently Asked Questions
What KPIs does the Moving Company KPI Dashboard in Google Sheets track?
It tracks 12 KPIs in six groups: On-Time Arrival Rate, On-Time Delivery Rate, Completed Moves, Damage & Loss Claim Rate, Claim Resolution Time, CSAT, Repeat & Referral Rate, Estimate-to-Booking Conversion, Average Revenue per Move, Truck Utilization Rate, Vehicle Accident Rate and Labor Cost per Move.
How is it different from the Moving Company KPI Scorecard?
They are separate template families. This KPI dashboard has a month picker, seven summary cards, a KPI Trend page and a KPI Analysis page with group roll-ups and top and bottom five. The scorecard uses its own layout and is sold as a separate product.
Is it the same as the Excel edition?
No. The Excel edition ships 14 KPIs in different groups. This Google Sheets build ships 12, including On-Time Arrival Rate, Claim Resolution Time, Vehicle Accident Rate and Labor Cost per Move, which the Excel file does not list.
How long does setup take?
About ten minutes. Make a copy from the PDF link, set the first month in cell E3, and type your monthly MTD and YTD values. The Moving Company KPI Dashboard recalculates as you type.
Does it include compliance or dispatch features?
No. It is a KPI reporting sheet only. It has no DOT, FMCSA, licensing or insurance reporting, and it does not connect to a TMS, CRM or GPS system.
How does it compare with paid moving software?
Paid moving software handles bookings, dispatch and invoicing on a subscription. This template only reports KPIs from numbers you enter, for a one-time payment. Many small movers use both, or start with the sheet.
About the Author
Built by PK, Microsoft Certified Professional with 15+ years of Excel, Google Sheets and Power BI experience. Founder of NextGenTemplates, reaching 300K+ subscribers across YouTube channels. Every template is hand-built and tested before release. New to Sheets? Start with Google’s guide to using Google Sheets.
Conclusion
The Moving Company KPI Dashboard gives a moving business one monthly view of service, claims, customer, sales, fleet and cost performance, scored fairly for both upper-the-better and lower-the-better KPIs.
Get the Moving Company KPI Dashboard in Google Sheets
✅ Instant download · One-time payment · No subscription
Last updated: September 2026