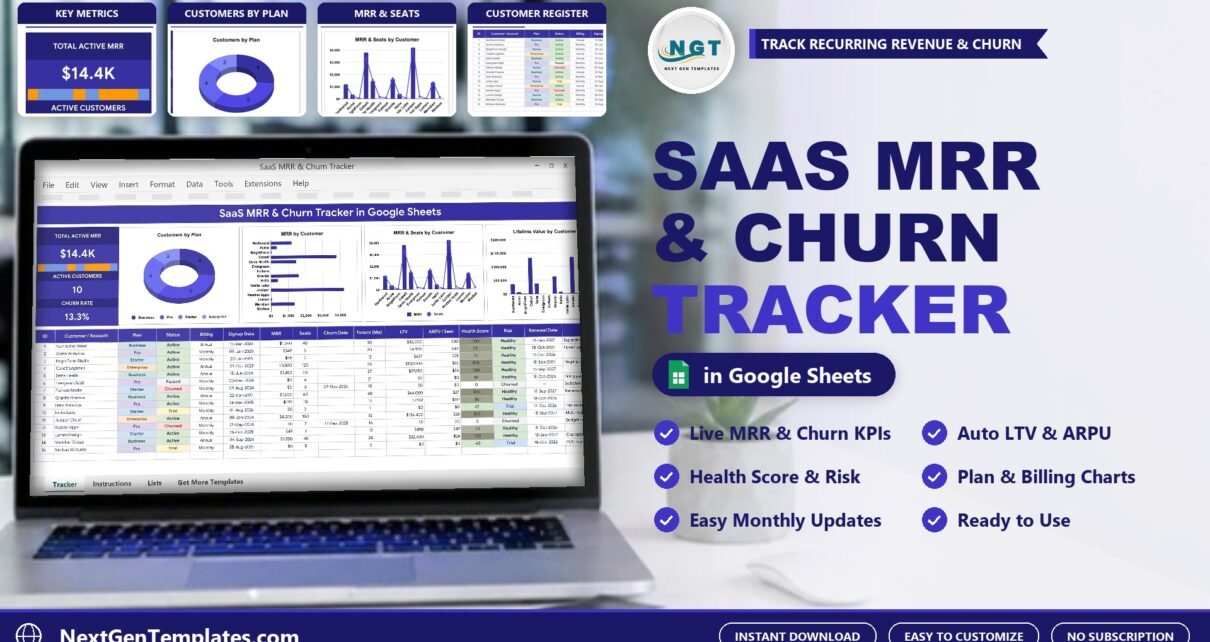
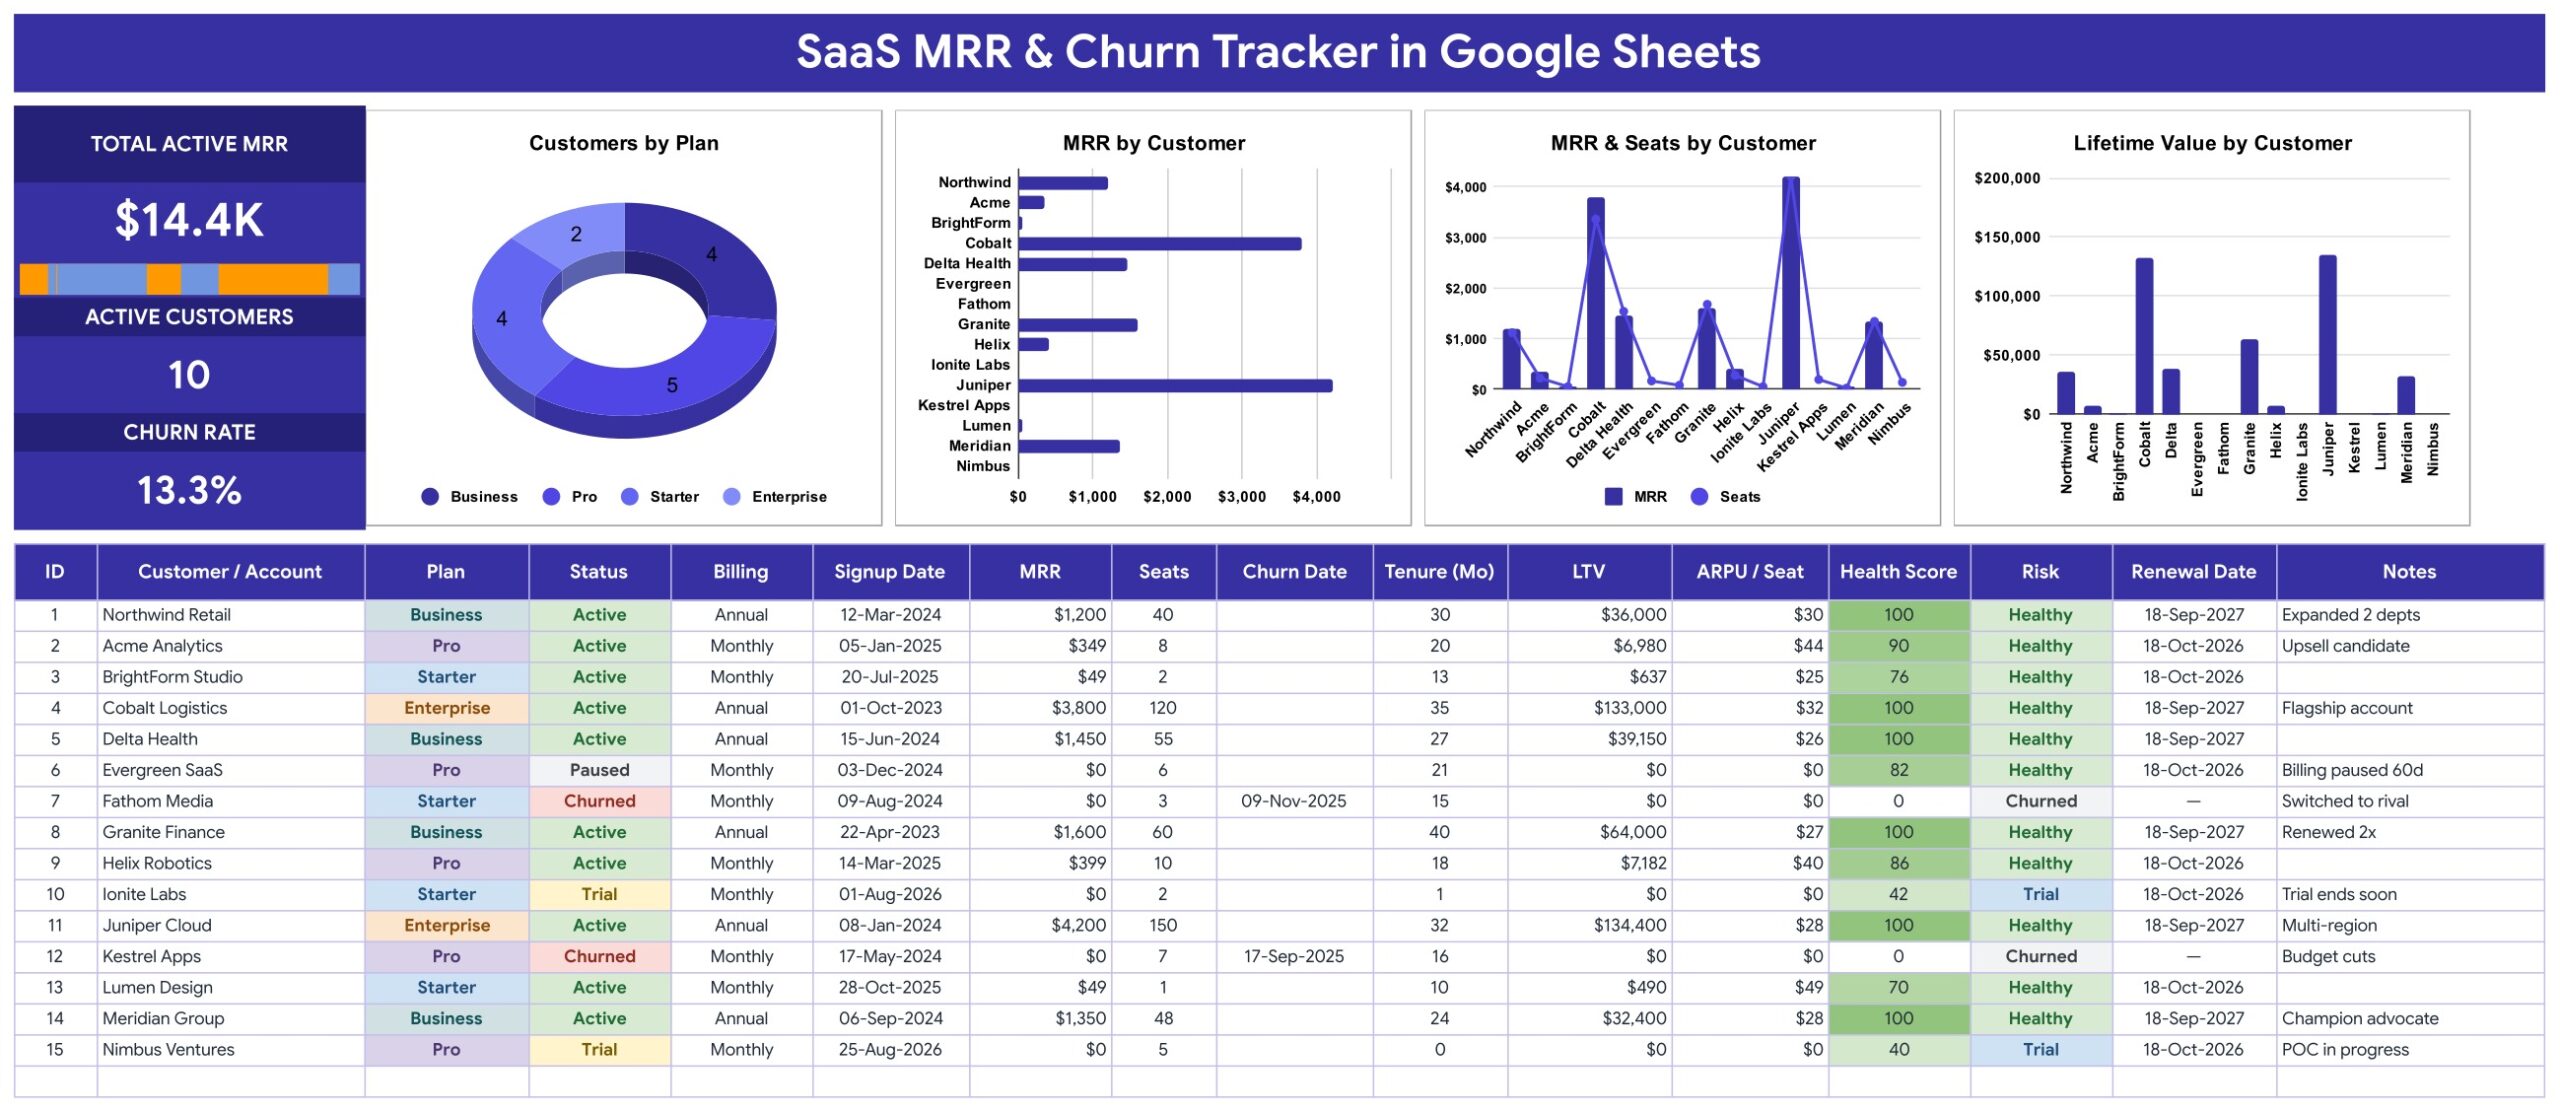
The SaaS MRR and Churn Tracker in Google Sheets puts your whole customer base on one tab: three live KPI cards, a revenue sparkline, four charts and a 16-column account log in which 7 columns calculate themselves. The sample file holds 15 accounts across four plans, showing $14.4K of Total Active MRR, 10 Active Customers and a 13.3% Churn Rate, and replacing that sample with your own accounts takes about 10 minutes.
Most early-stage SaaS teams track recurring revenue in a spreadsheet long before they connect a billing analytics tool. The trouble is that a plain list of customers and prices tells you very little: which accounts carry the revenue, who has been with you longest, who pays the least per seat and who is quietly drifting toward cancellation. The SaaS MRR and Churn Tracker answers those questions from eight fields you already know, and it stays a spreadsheet you fully control.
Get the SaaS MRR & Churn Tracker in Google Sheets
This belongs to our one-page Google Sheets tracker line: KPI cards and charts at the top, a data-entry log below, all on one tab. It is not a multi-page KPI dashboard. For a broader monthly view of SaaS finances, read our guide to the SaaS Financial Performance Dashboard in Google Sheets.
Key Features of the SaaS MRR and Churn Tracker
- Total Active MRR card. The card adds up the MRR column for every account whose Status is Active. Paused, Trial and Churned accounts are left out, so the figure is the recurring revenue you are currently billing.
- Active Customers card. A live count of accounts with Status Active, sitting directly under the MRR card.
- Churn Rate card. The sheet divides the number of Churned accounts by the total number of accounts in the log. With 2 churned accounts out of 15, the sample shows 13.3%. This is a share of your customer list, not a monthly or cohort churn rate.
- Revenue sparkline. A small bar sparkline under the MRR card shows how revenue is spread across accounts, built with Google’s SPARKLINE function.
- Four charts with no helper tables. Customers by Plan, MRR by Customer, MRR & Seats by Customer and Lifetime Value by Customer all read the data columns directly, rows 16 to 1000.
- Seven automatic columns. ID, Tenure (Mo), LTV, ARPU / Seat, Health Score, Risk and Renewal Date are formulas, so you never calculate them by hand.
- Dropdowns that grow. Plan, Status and Billing read from the List tab, rows 2 to 500. Google explains the mechanism in its help page on in-cell dropdown lists.
Tracker Structure: Every Tab Explained
The Google Sheet has four tabs: MRR & Churn Tracker, List, Instructions and Explore More Templates. You receive a PDF with the “Make a copy” link, which creates your own editable version in Google Drive.
Tab 1: MRR & Churn Tracker
The left column holds the three KPI cards and the sparkline. Beside them, Customers by Plan is a donut chart counting accounts per plan (the sample has 5 Pro, 4 Business, 4 Starter and 2 Enterprise). MRR by Customer ranks every account by monthly revenue. MRR & Seats by Customer overlays seats as a line on MRR columns, so you can see where revenue and team size do not match. Lifetime Value by Customer shows which relationships have been worth the most so far.
Below the charts is the 16-column log: ID, Customer / Account, Plan, Status, Billing, Signup Date, MRR, Seats, Churn Date, Tenure (Mo), LTV, ARPU / Seat, Health Score, Risk, Renewal Date and Notes.
How the automatic columns work
- Tenure (Mo): whole months from Signup Date to today, or to the Churn Date for a churned account.
- LTV: MRR multiplied by tenure months.
- ARPU / Seat: MRR divided by Seats.
- Health Score: 40 points, plus 2 per month of tenure, plus 15 for Annual billing, plus 10 for Active status, capped at 100. Churned accounts score 0.
- Risk: Healthy at 70 or above, Watch from 45 to 69, At Risk below 45, with Trial and Churned labelled on their own.
- Renewal Date: an estimate, one month from today for Monthly billing and twelve months for Annual. It is not read from a contract.
Tab 2: Instructions
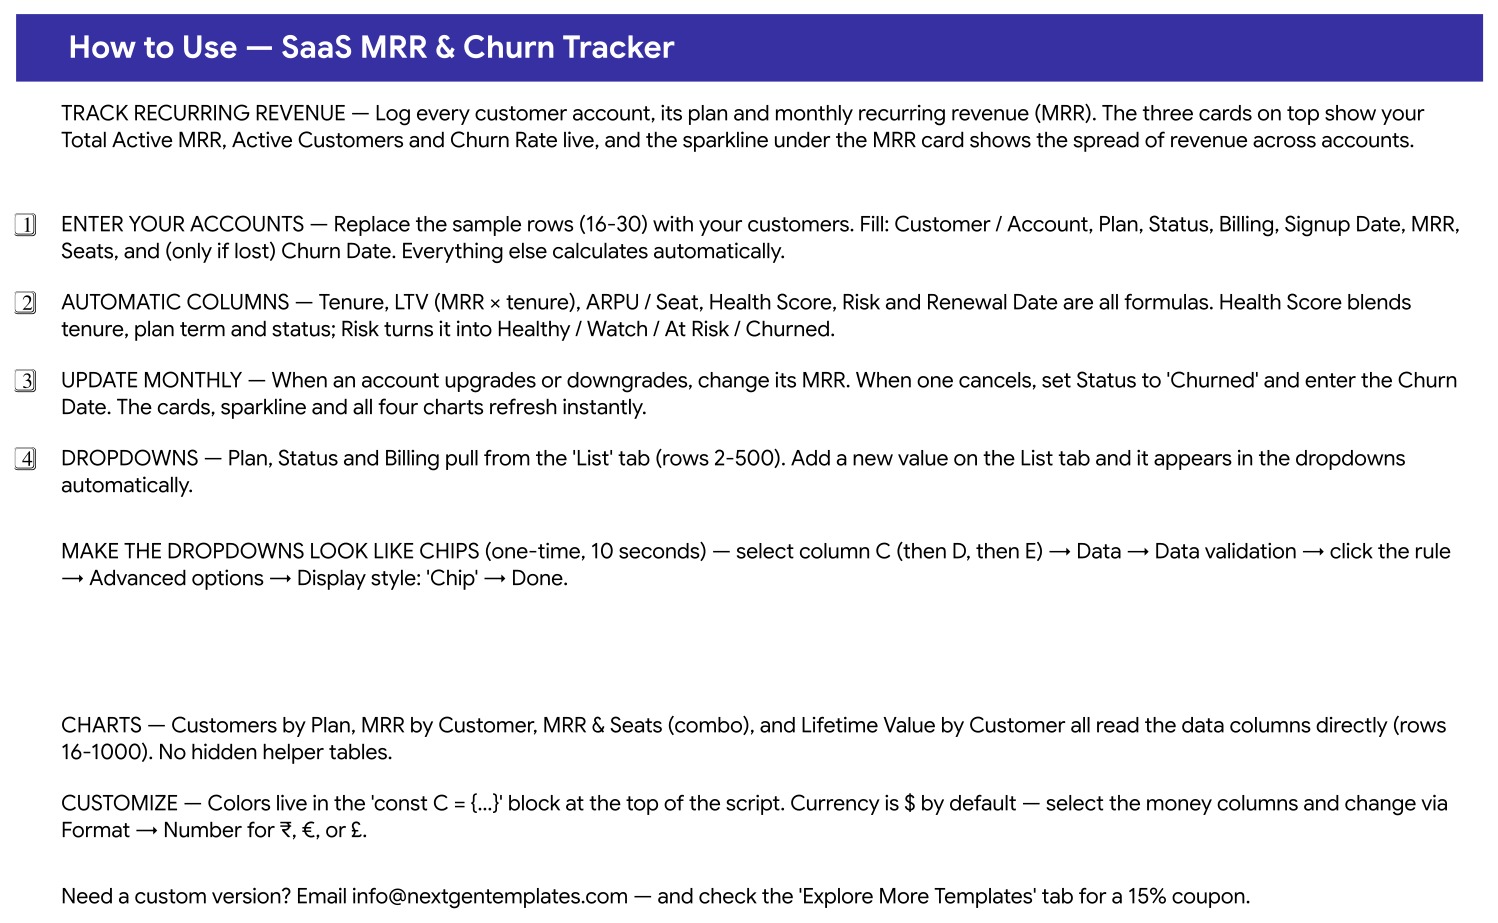
A How to Use page inside the file covers entering accounts, which columns are formulas, the monthly update routine, the List-tab dropdowns, switching dropdowns to chip style and changing the currency.
Tab 3: Explore More Templates
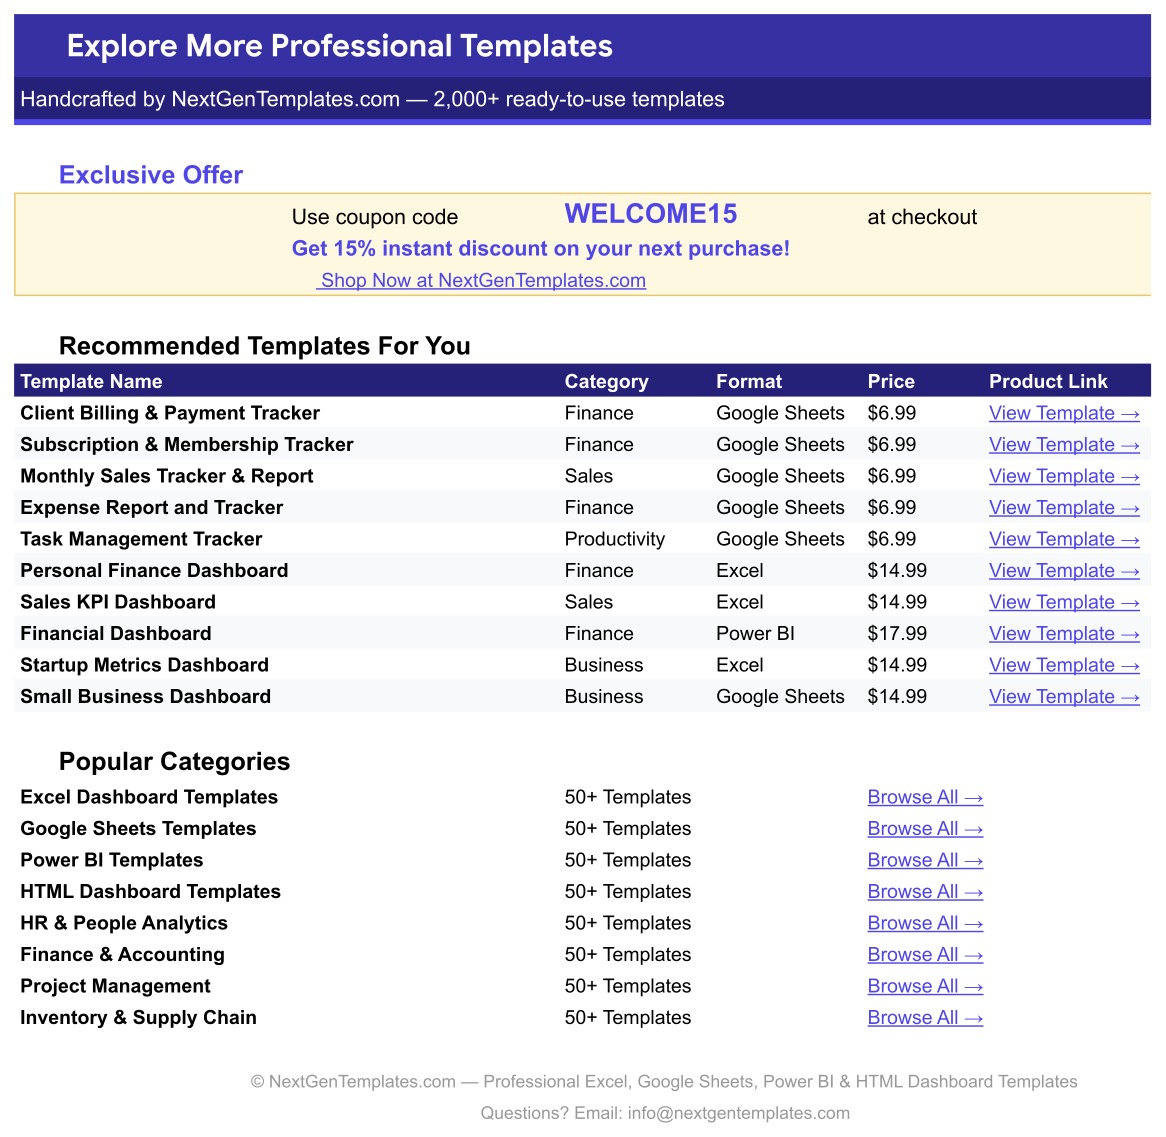
Recommended templates, popular categories and a WELCOME15 coupon for 15% off a future purchase. The List tab, not pictured, holds the Plan (Starter, Pro, Business, Enterprise, Free Trial), Status (Active, Trial, Churned, Paused) and Billing Cycle (Monthly, Annual) values.
SaaS MRR & Churn Tracker vs. Excel Tracker vs. Subscription Analytics Tools: Feature Comparison
| Feature | SaaS MRR & Churn Tracker (Google Sheets) | Microsoft Excel tracker | ChartMogul / Baremetrics / ProfitWell |
|---|---|---|---|
| Cost | ✅ One-time payment | One-time, plus an Excel licence | Monthly subscription, tiered by revenue |
| Platform | ✅ Any browser, free Google account | Excel desktop or Microsoft 365 | Web app |
| Setup time | ✅ About 10 minutes | About 10 minutes | Billing-system integration required |
| Real-time team collaboration | ✅ Google Sheets sharing | Limited outside OneDrive | ✅ Per seat |
| Mobile access | ✅ Google Sheets app | Excel app | ✅ Web |
| Customizable fields | ✅ Every column and dropdown | ✅ Yes | Fixed metric definitions |
| Share with a link | ✅ Yes | Via OneDrive | Varies by plan |
| Automatic billing sync | No, manual entry | No | ✅ Yes |
| Per-account Health Score | ✅ Built in, editable | Build it yourself | Varies by vendor |
For founders who want MRR, churn and account health in one sheet without connecting a billing system or paying monthly, this tracker sits in the sweet spot.
Who Should Use This Template
Perfect for:
- Bootstrapped SaaS founders with a few dozen to a few hundred paying accounts
- Customer success leads who want a quick Health Score and Risk flag per account
- Agencies and consultancies selling software-style monthly or annual plans
- Anyone who needs a churn rate tracker spreadsheet before committing to an analytics subscription
Not a fit if:
- You need MRR pulled automatically from Stripe, Chargebee or another billing system
- You need cohort retention, month-by-month MRR movement or formal revenue recognition
Real-World Use Cases
Maya runs a two-person scheduling app with 40 customers. She logs each account’s plan and MRR. The MRR by Customer chart shows that three Business accounts carry over half her revenue, so those three get a personal call every quarter.
Daniel leads customer success at a B2B analytics startup. Every Monday he filters the Risk column. Monthly-billed accounts with short tenure land in Watch or At Risk, and he books check-ins before their next estimated renewal date.
Priya sells a white-label reporting tool to agencies. The ARPU / Seat column showed that her oldest Starter clients paid far less per user than newer ones, which gave her the numbers to plan a pricing update.
Advantages of the SaaS MRR and Churn Tracker
- One view instead of five. Revenue, customer count, churn, lifetime value and account health sit on one tab.
- No formulas to write. You enter eight fields; seven columns and all four charts follow.
- No integration to maintain. Nothing breaks when an API or billing tool changes.
- Fully editable logic. The Health Score weights are plain formulas you can change to suit your business.
- Works as a SaaS recurring revenue tracker for other models. Service retainers or memberships fit the same columns. For those, our Retainer & Recurring Client Tracker and Patreon & Membership Income Tracker guides show purpose-built alternatives.
Opportunities for Improvement
- Churn Rate is list-based. It divides churned accounts by all accounts ever entered, so it does not show churn for a specific month. Add a monthly snapshot tab if you need a period rate.
- LTV of churned accounts. The sample sets a churned account’s MRR to $0, which makes its LTV read $0. Keeping the last MRR on the row shows what the account paid; Total Active MRR still only counts Active rows, though MRR by Customer will then include it.
- Renewal Date is estimated. It rolls forward from today by the billing cycle rather than using the real contract date.
- Manual entry. There is no billing sync, so plan changes must be typed in.
Best Practices
- Update MRR the same day a plan changes, so the cards stay accurate.
- Never delete churned accounts; set Status to Churned and add the Churn Date.
- Use Paused for billing holds so they drop out of Total Active MRR without counting as churn.
- Keep plan names consistent through the List tab so Customers by Plan groups correctly.
- Review Watch and At Risk accounts once a month and note the outcome in Notes.
Explore Relevant Templates
- SaaS Financial Performance Dashboard in Google Sheets: multi-page SaaS finance analytics.
- SaaS Business KPI Dashboard in Power BI: a KPI scorecard for Power BI users.
- SaaS Metrics Dashboard in Power BI: SaaS analytics across several pages.
- SaaS Onboarding Dashboard in Google Sheets: pairs well with this tracker; see our SaaS Onboarding Dashboard guide.
If you would like to get better at building trackers like this one, the NextGenTemplates Academy learning paths cover the spreadsheet skills step by step, with practice files.
Frequently Asked Questions
What does the SaaS MRR and Churn Tracker calculate?
It shows Total Active MRR, Active Customers and Churn Rate on three cards, and for every account works out Tenure, LTV (MRR times tenure months), ARPU / Seat, a Health Score from 0 to 100, a Risk label and an estimated Renewal Date, all from eight fields you type.
How is the churn rate worked out?
The Churn Rate card divides accounts with Status Churned by all accounts in the log. In the sample, 2 of 15 gives 13.3%. It is a share of your customer list rather than a monthly churn rate, so keep churned rows in the tracker.
Does the tracker connect to Stripe?
No. The SaaS MRR & Churn Tracker has no API or billing sync. You type or paste the figures, which keeps the file simple and independent, but it means plan changes must be entered by hand.
How long does setup take?
About 10 minutes. Make a copy from the PDF link, adjust the Plan, Status and Billing lists on the List tab and overwrite the 15 sample rows. The cards, sparkline and four charts refresh instantly.
How does this compare to ChartMogul or Baremetrics?
Those services connect to your billing system and add cohort and movement reports for a monthly fee. This MRR tracker Google Sheets template is a one-time purchase that covers the per-account view, MRR, seats, tenure, LTV, health and risk, with manual entry.
Can I use a currency other than dollars?
Yes. Select the money columns and choose Format, Number to switch to rupees, euros, pounds or any other currency. Everything else keeps working.
About the Author
Built by PK, Microsoft Certified Professional with 15+ years of Excel, Google Sheets and Power BI experience. Founder of NextGenTemplates, reaching 300K+ subscribers across YouTube channels. Every template is hand-built and tested before release.
Conclusion
If your recurring revenue lives in a spreadsheet today, the SaaS MRR and Churn Tracker in Google Sheets turns that list into live MRR, churn and account-health figures without a subscription or integration. Enter eight fields per account and let the tracker handle the rest.
Get the SaaS MRR & Churn Tracker in Google Sheets
✅ Instant download · One-time payment · No subscription
Last updated: September 2026