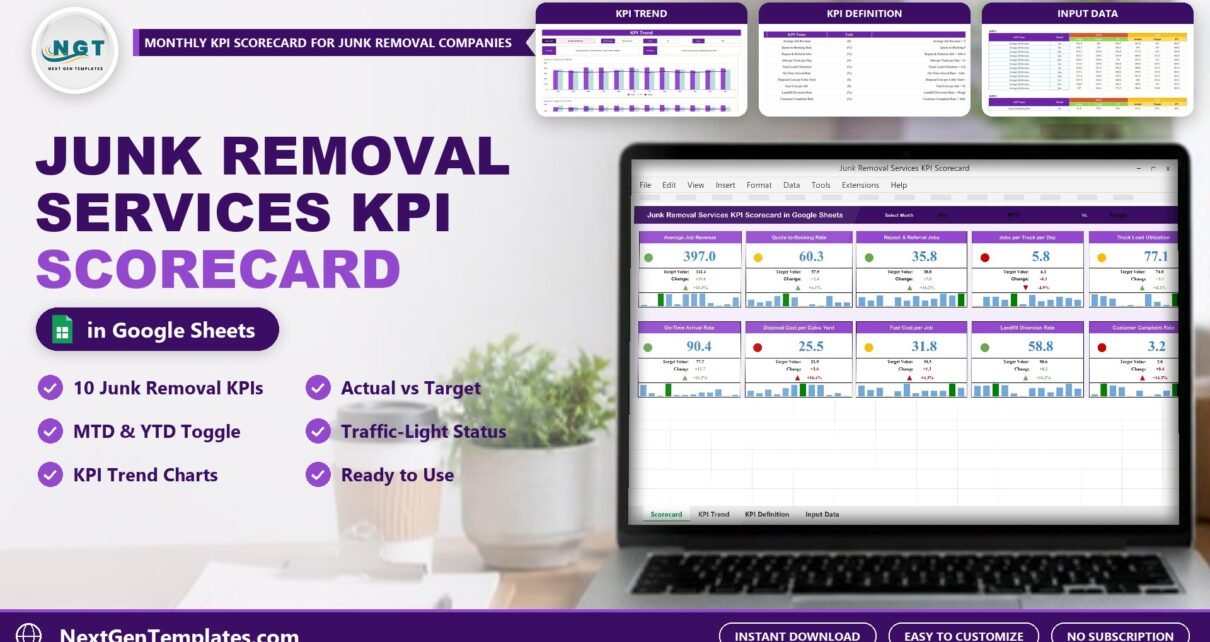
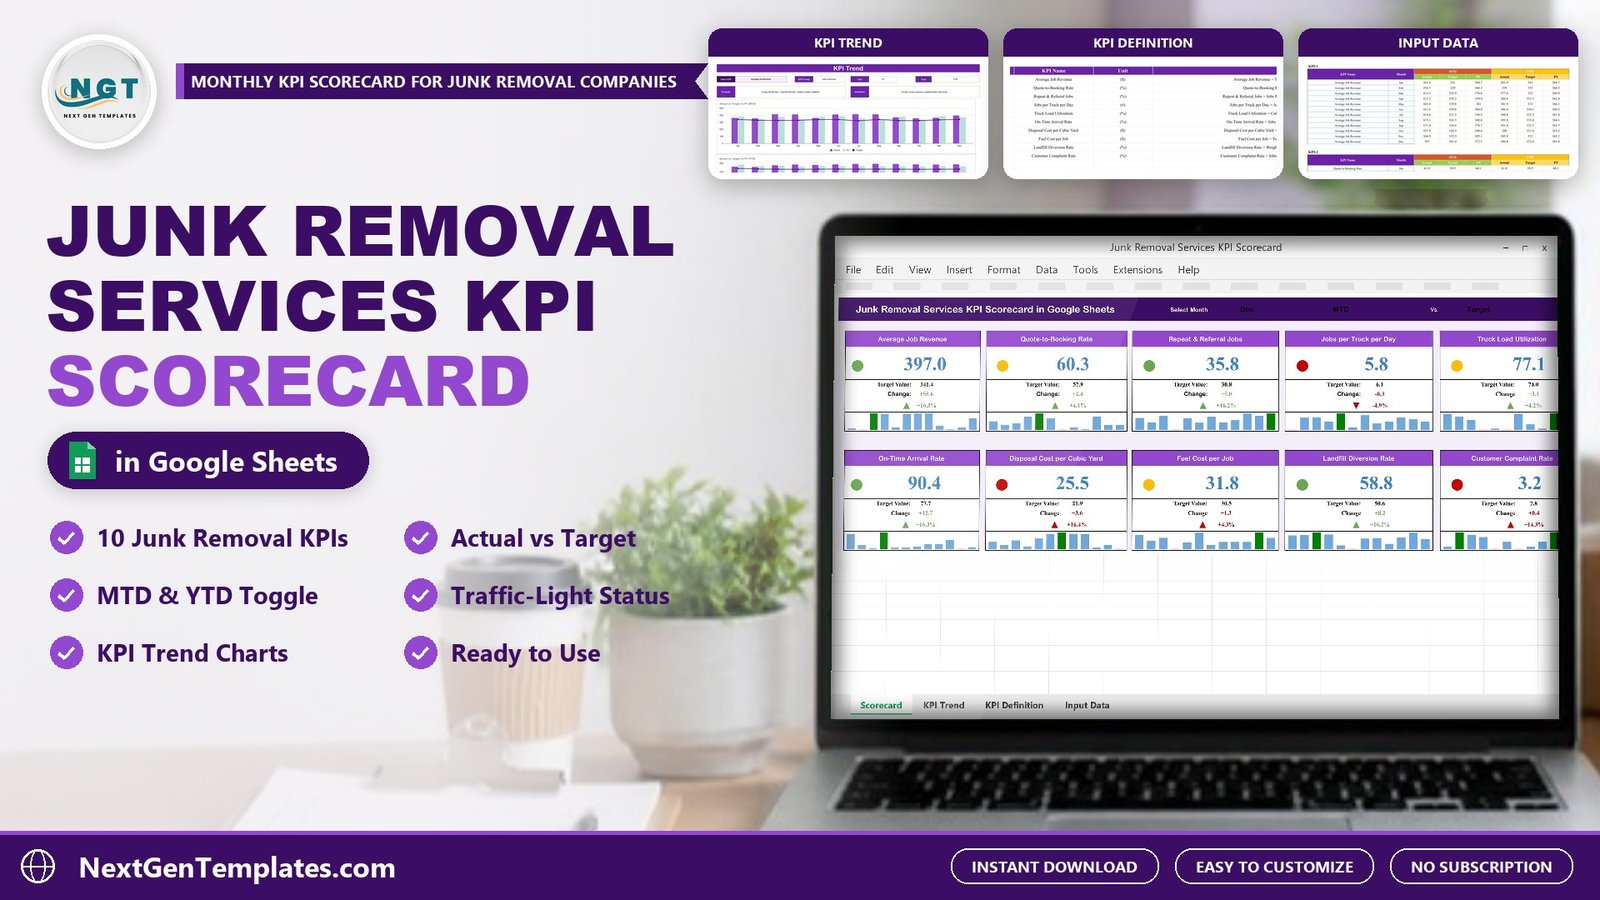
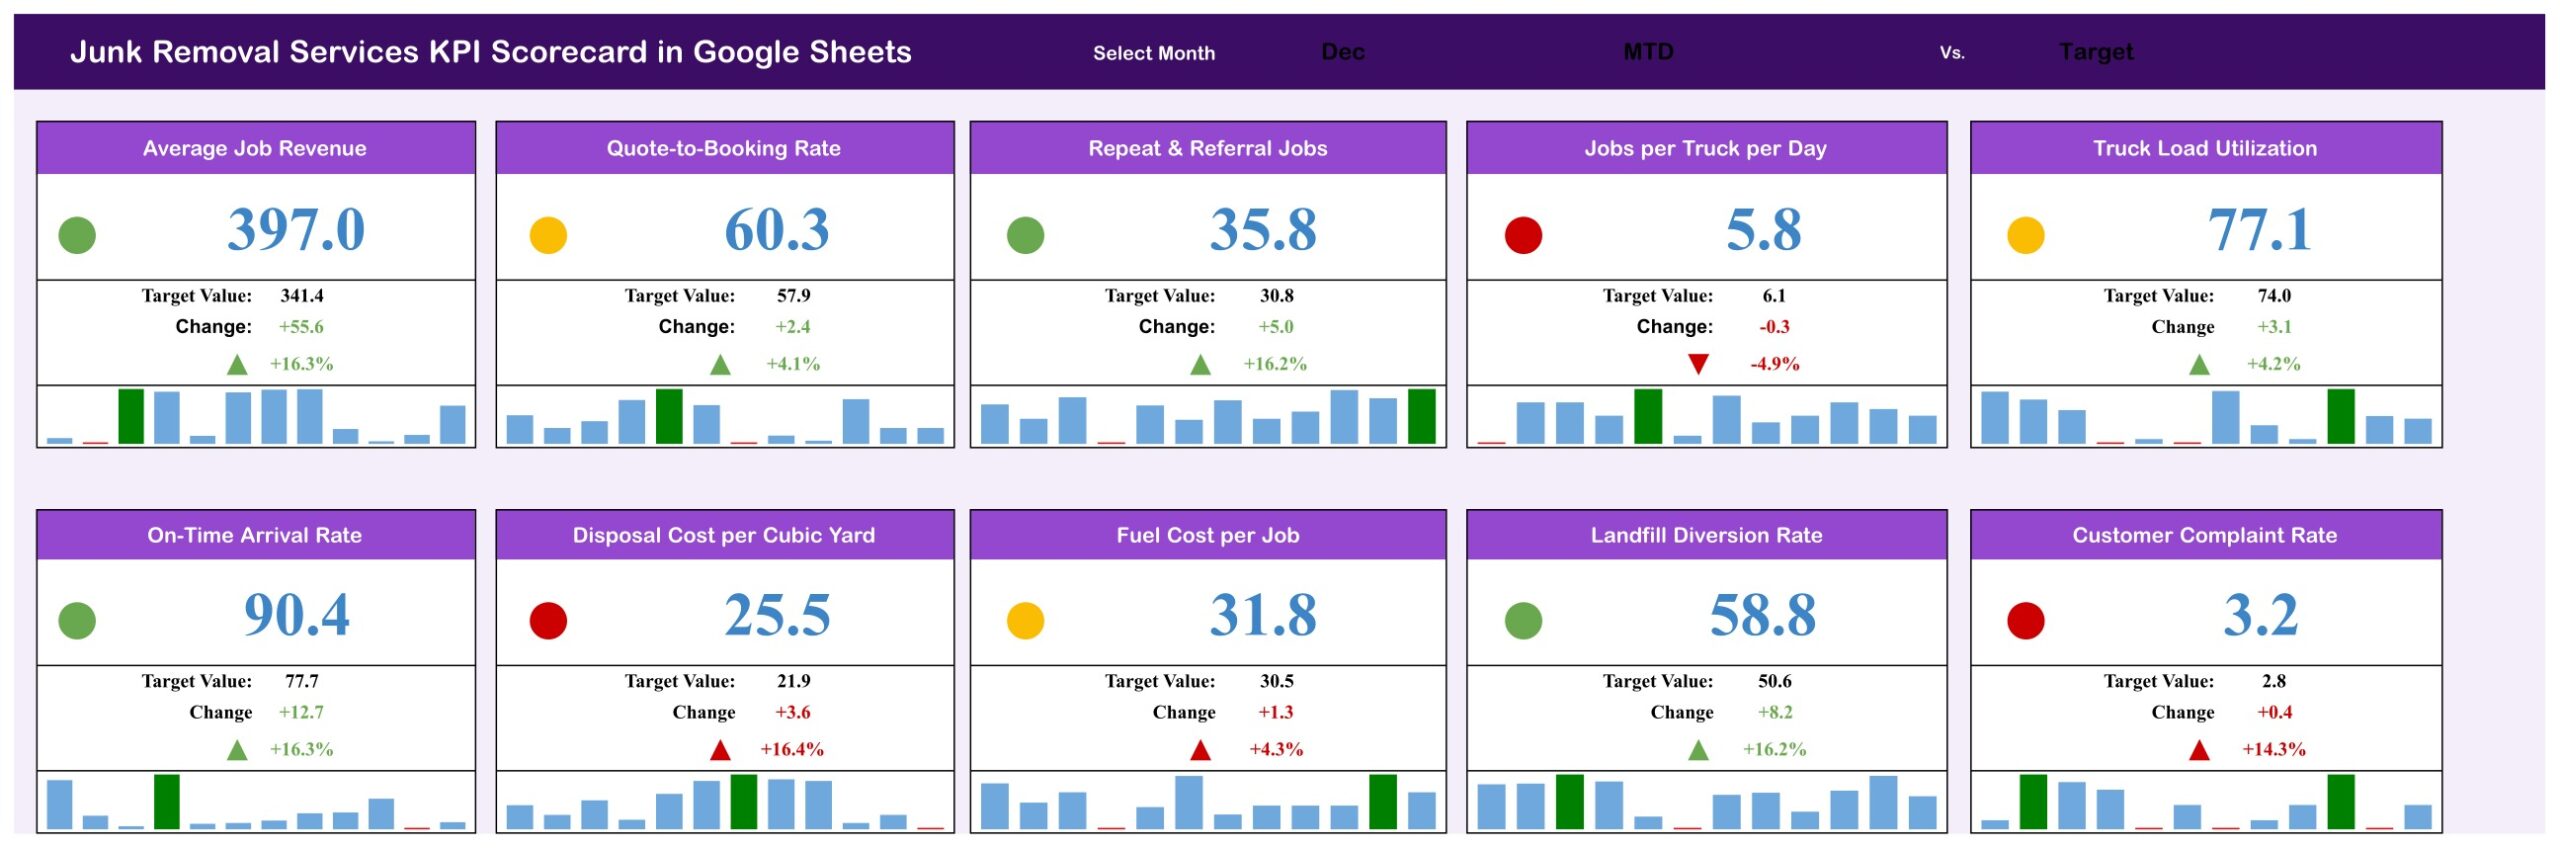
The Junk Removal Services KPI Scorecard in Google Sheets puts 10 junk removal KPIs on a single page of traffic-light cards, split across five groups: Sales & Revenue, Operations, Cost & Disposal, Sustainability and Customer. Every card carries a 12-month mini chart, a KPI Trend page charts any KPI against Target and prior year (PY), and the sample file ships with 120 monthly records (10 KPIs x 12 months).
A junk removal business lives on thin, moving numbers. Tipping fees change by the load, fuel eats into every job, and a truck that leaves half empty costs almost as much as one that leaves full. The figures that tell an owner how the month went sit in a booking app, the dump tickets, the fuel cards and the review sites. This Google Sheets KPI scorecard gives you one place to type the month’s totals and see at a glance which figures beat target, which slipped, and how each one moved over the year.
Get the Junk Removal Services KPI Scorecard in Google Sheets
Key Features of the Junk Removal Services KPI Scorecard in Google Sheets
- Three selectors on one page. Choose the month (Jan to Dec), MTD or YTD, and Target or PY. All ten cards recalculate from the Input Data tab using ordinary sheet formulas, with no Apps Script, add-ons or macros.
- Direction-aware traffic lights. Seven KPIs are upper-the-better (UTB) and three are lower-the-better (LTB): Disposal Cost per Cubic Yard, Fuel Cost per Job and Customer Complaint Rate. For a UTB KPI, a variance at or below 0% is red, up to 10% is amber and above 10% is green; LTB KPIs use the mirror rule.
- Full detail on every card. Actual value, Target or PY value, change, change %, a coloured arrow and a 12-month mini column chart with the selected month in green.
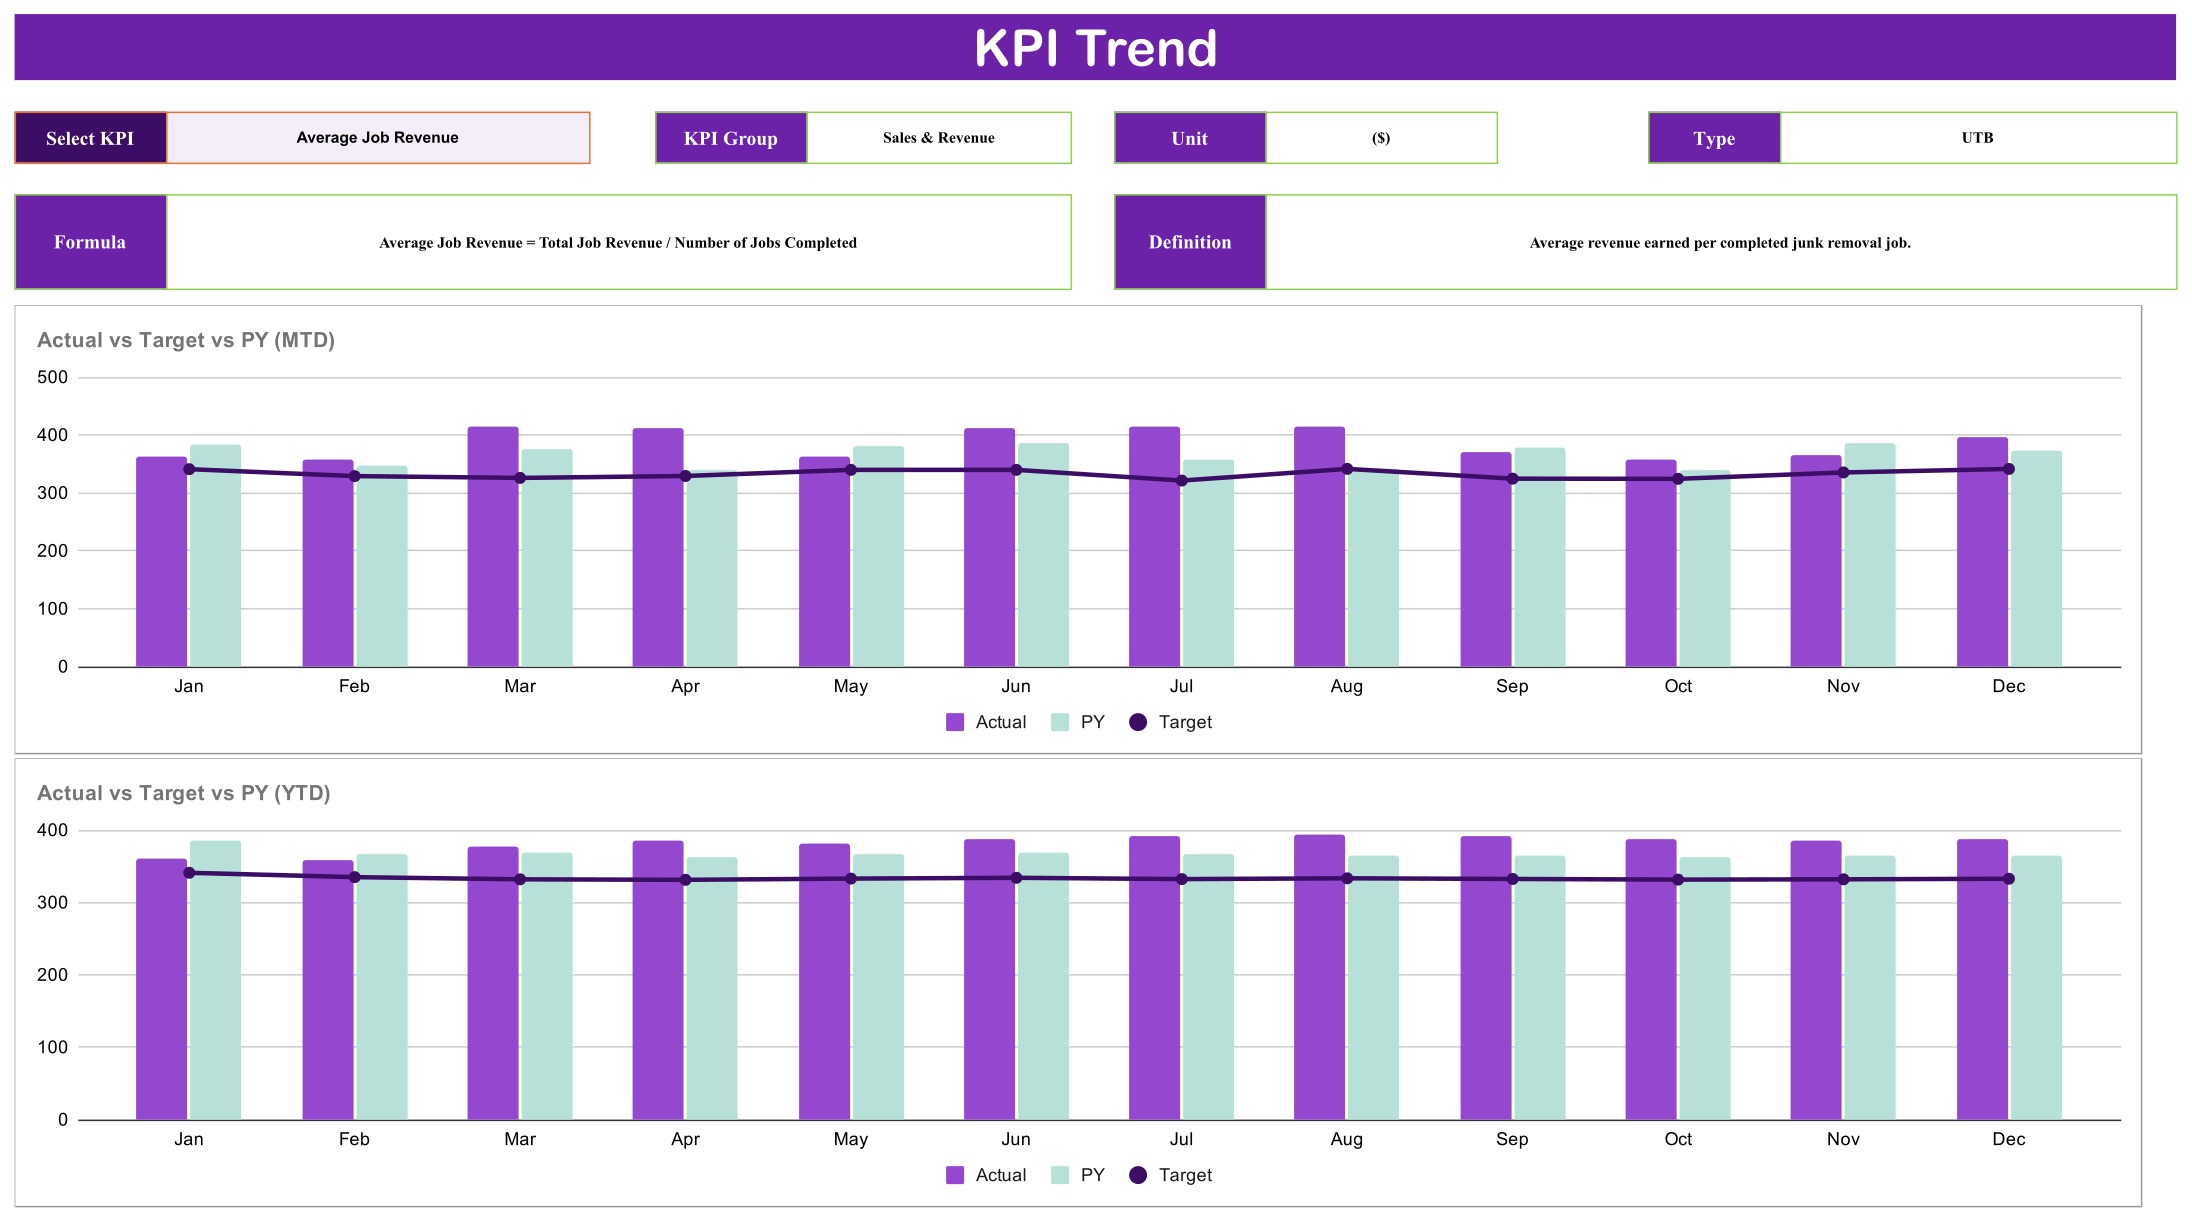
- KPI Trend page. Pick a KPI to see its group, unit, type, formula and definition above two charts: Actual vs Target vs PY (MTD) by Month and Actual vs Target vs PY (YTD) by Month.
- Editable KPI definitions. Names, units, formulas, definitions and the UTB/LTB type all live on one sheet, so you can adapt the scorecard to how your crews are measured.
Dashboard Pages Explanation
The scorecard has four working pages plus Read Me, Color Settings, Support and Trend_Support tabs.
Page 1: Scorecard
Ten cards sit in two rows of five under a header that holds the month, MTD/YTD and Target/PY selectors. With December, MTD and Target selected, the sample shows 4 green, 3 amber and 3 red lights. Average Job Revenue reads 397.0 against a target of 341.4 (green, up 16.3%), On-Time Arrival Rate 90.4 against 77.7 (green), Jobs per Truck per Day 5.8 against 6.1 (red, down 4.9%), and Customer Complaint Rate 3.2 against 2.8 (red, because more complaints is worse).
Page 2: KPI Trend
The KPI Trend page answers the question the scorecard raises: is this month a blip or a pattern? Choose a KPI from the Select KPI drop-down and the page fills in the KPI Group, Unit, Type, Formula and Definition, then draws two combo charts: Actual vs Target vs PY (MTD) by Month and Actual vs Target vs PY (YTD) by Month. The sample shows Average Job Revenue, a UTB dollar KPI in the Sales & Revenue group.
Page 3: KPI Definition
The master list of all 10 KPIs with KPI Group, Unit, Formula, Definition and Type. Examples: Quote-to-Booking Rate = Jobs Booked / Quotes Given x 100; Truck Load Utilization = Cubic Yards Hauled / Truck Capacity Available x 100; Disposal Cost per Cubic Yard = Total Dump and Tipping Fees / Cubic Yards Hauled; Landfill Diversion Rate = Weight Donated or Recycled / Total Weight Collected x 100.

Page 4: Input Data
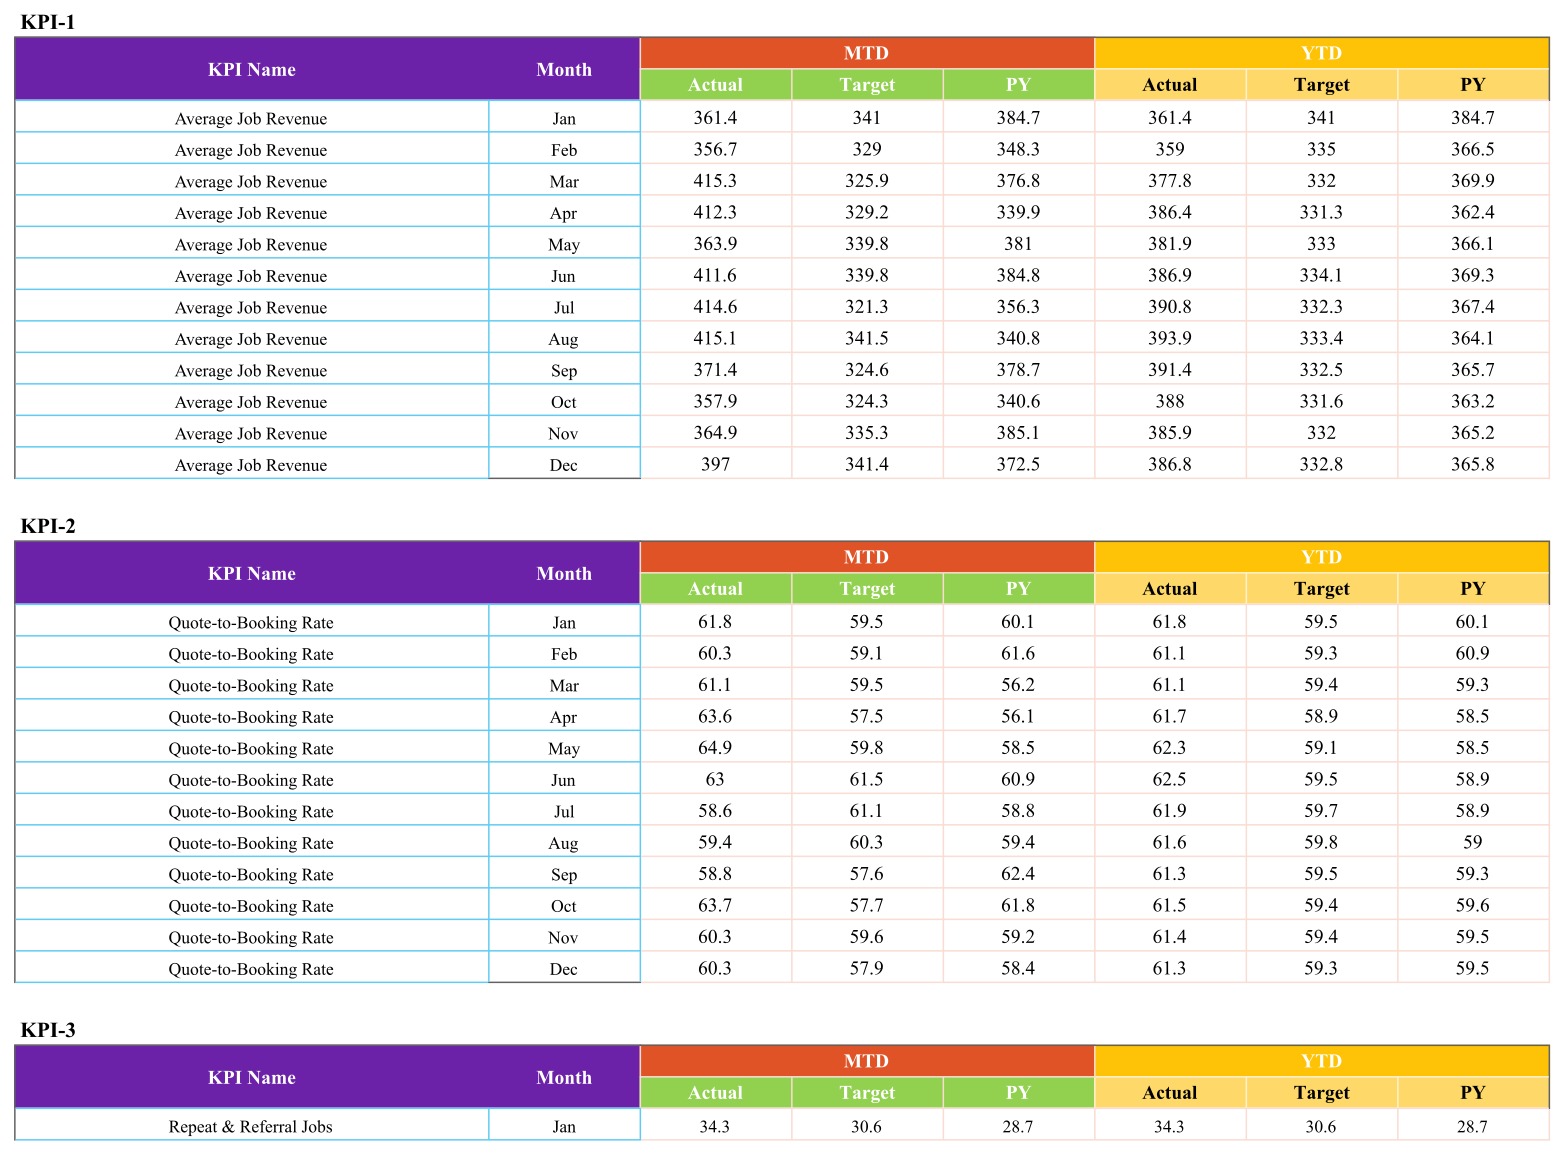
Ten blocks, KPI-1 to KPI-10, each with 12 monthly rows of MTD and YTD Actual, Target and PY. This is the only sheet you type into. YTD is entered rather than calculated, so you choose whether a YTD figure is a running total (useful for counts) or a running average (right for rates such as Truck Load Utilization).
Junk Removal Scorecard vs. Excel vs. Field Service Software: Feature Comparison
| Feature | This scorecard (Google Sheets) | Excel KPI workbook | Field service software (Jobber / Housecall Pro) |
|---|---|---|---|
| Cost | ✅ One-time payment | One-time, plus Excel licence | Recurring subscription |
| Platform | ✅ Browser, any OS | Desktop Excel | Vendor apps |
| Setup time | ✅ Minutes | Minutes | Days to weeks |
| Real-time team collaboration | ✅ Yes, Google Drive sharing | Limited | ✅ Yes |
| Mobile access | ✅ Google Sheets app | Excel app | ✅ Vendor app |
| Customisable KPIs | ✅ Names, units, formulas, UTB/LTB | ✅ Yes | Within vendor limits |
| Landfill diversion and disposal cost KPIs | ✅ Built in | Depends on the workbook | Usually needs custom reports |
| Dispatch, booking, invoicing | No, monthly totals only | No | ✅ Yes |
For owners who want a clear monthly KPI review without another per-seat subscription, this scorecard sits in the sweet spot. It sits beside field service software rather than replacing it.
Who Should Use This Template
Perfect for:
- Owners of junk removal, hauling and clean-out businesses running one to ten trucks.
- Operations managers who hold a monthly review with crew leads.
- Franchise owners who want one consistent KPI page per territory.
- Businesses that donate and recycle and want to report landfill diversion alongside cost.
Not a fit if:
- You need dispatch, online booking, route planning, customer records or invoicing.
- You want the sheet to pull numbers automatically from your booking or accounting system.
- You need several years of history in a single file.
Real-World Use Cases
Derek runs four junk removal trucks in a mid-size city. At month end he checks Jobs per Truck per Day and Truck Load Utilization against target. When both slip in the same month he knows the problem is scheduling, not demand, and he shares a view-only link with his crew leads before the Monday meeting.
Priya manages a clean-out company that donates furniture. When Disposal Cost per Cubic Yard turns red she opens KPI Trend and compares it with the Landfill Diversion Rate for the same months. Months with more donations show lower tipping fees, which gives her a cost case for the extra sorting time.
Luis owns a small hauling franchise. He switches the scorecard to YTD and PY to see whether Quote-to-Booking Rate and Repeat & Referral Jobs are ahead of last year before he renews his local advertising.
Advantages of the Junk Removal Services KPI Scorecard
- One page for the monthly review. Revenue, bookings, truck productivity, disposal cost, fuel, diversion and complaints sit side by side, so trade-offs are visible.
- Cost KPIs read the right way. Because disposal cost, fuel cost and complaints are marked LTB, a rise turns the light red instead of green.
- No learning curve. It is a normal Google Sheet: type numbers, pick a month, read the lights.
- Easy to share. Google Drive sharing lets partners or crew leads view the same file without per-user seats.
- One-time payment. No subscription and no per-user fees.
Opportunities for Improvement
- Month drop-down mismatch. The Month list offers “June” and “July” while Input Data uses “Jun” and “Jul”, so choosing either month blanks the cards. The fix takes a minute: on the Scorecard tab select cell N1, open Data > Data validation and change the two entries to “Jun” and “Jul”. Google’s help page explains how to edit a drop-down list.
- Color Settings is not linked. The tab shows the red, amber and green bands, and the Read Me points to it, but the lights actually read the RAG table in the Support tab (Y4:AE6). Edit the bands there.
- Manual entry. There is no import from booking or accounting software; you type monthly totals.
- One year per file. For a new year, make a fresh copy and move this year’s actuals into the PY columns.
- Sample data. All supplied figures are fictional and exist only to show how the cards behave.
Best Practices
- Fix the June/July drop-down before anything else.
- Agree the KPI definitions with your team first, then keep the names identical on KPI Definition and Input Data.
- Enter numbers on the same day each month, straight from dump tickets, fuel cards and your booking system.
- Use YTD averages for rates and YTD totals for counts.
- Review red lights on KPI Trend before reacting; one bad month is not a trend.
- Share a view-only link and keep editing rights with one person. Google explains how to share files from Google Drive.
Explore Relevant Templates
Neighbouring trades use the same scorecard layout. Read about the Moving Company KPI Scorecard in Google Sheets, the Demolition Services KPI Scorecard in Google Sheets and the Waste Management KPI Scorecard in Google Sheets. Diversion-focused teams may also like the Recycling KPI Scorecard in Google Sheets, and service crews can compare the Septic Tank Service KPI Scorecard and the Pressure Washing Services KPI Scorecard.
Prefer Excel? The Junk Removal Services KPI Scorecard in Excel covers the same trade with a different KPI set (for example Volume Hauled, Avg Job Duration and Disposal Cost per Ton) and adds a KPI Analysis page, and the Junk Removal Services KPI Dashboard in Excel offers a month-picker dashboard layout.
Want to build reporting skills like this step by step? The Excel Pivot Tables & Dashboards course on NextGenTemplates Academy walks you through it with practice files.
Frequently Asked Questions
What KPIs does this junk removal scorecard track?
Ten junk removal KPIs: Average Job Revenue, Quote-to-Booking Rate, Repeat & Referral Jobs, Jobs per Truck per Day, Truck Load Utilization, On-Time Arrival Rate, Disposal Cost per Cubic Yard, Fuel Cost per Job, Landfill Diversion Rate and Customer Complaint Rate. You can rename any of them on the KPI Definition sheet.
How long does setup take?
About a minute to make a copy from the PDF link, a minute for the June/July drop-down fix, then as long as it takes to enter 12 months of figures for 10 KPIs. Most owners finish in one sitting.
How does it compare to field service software?
Field service tools such as Jobber or Housecall Pro run dispatch, booking and invoicing on a subscription. This Google Sheets KPI scorecard only reports the monthly figures you enter, for a one-time payment. Many businesses use both: software for daily jobs, the scorecard for the monthly review.
Is it the same as the Excel edition?
No. The Excel edition tracks a different set of 10 junk removal KPIs and has extra pages. The two share the trade, not the KPI list, so pick the one that matches your platform and the numbers you report.
Do I need Apps Script or add-ons?
No. Every card, light and chart is driven by ordinary Google Sheets formulas and built-in charts. It works in any browser and in the Google Sheets mobile app.
Can I change the traffic-light thresholds?
Yes. Edit the RAG table in the Support tab (Y4:AE6). The Color Settings tab is a reference copy that is not linked to the lights in this build.
About the Author
Built by PK, Microsoft Certified Professional with 15+ years of Excel, Google Sheets and Power BI experience. Founder of NextGenTemplates, reaching 300K+ subscribers across YouTube channels. Every template is hand-built and tested before release.
Conclusion
The Junk Removal Services KPI Scorecard in Google Sheets gives a hauling business one honest page for its monthly review: ten KPIs, direction-aware traffic lights and a trend page that shows whether a red light is new or recurring. Fix the month drop-down, type your numbers and share the link with your crew leads.
Get the Junk Removal Services KPI Scorecard in Google Sheets
✅ Instant download · One-time payment · No subscription
Last updated: September 2026