The Fitness and Wellness Dashboard in Google Sheets turns a fitness or wellness session log into a 7-tab reporting workbook with 4 executive KPI cards, 20 chart views, slicers, a Session ID lookup sheet, and a structured data sheet. For a one-time $9.99 template price, gyms, personal training teams, wellness studios, and fitness program managers can review revenue, sessions, active minutes, wellness scores, trainer activity, member mix, branch performance, and program cost without rebuilding reports from zero each month.Fitness and Wellness Dashboard in Google Sheets
Because it runs in Google Sheets, teams can use familiar sharing and collaboration features from Google Drive. Google explains that Sheets files can be shared with different access levels for editors, commenters, and viewers through Google Docs Editors sharing settings, which makes this template useful for managers who want a simple shared reporting file.
Get the Fitness and Wellness Dashboard in Google Sheets
Key Features of Fitness and Wellness Dashboard in Google Sheets
- 4 headline cards: Total Revenue, Total Sessions, Active Minutes, and Avg Wellness.
- 7 sheet tabs: Overview, Program Report, Member Report, Revenue Report, Trainer Report, Search Sheet, and Data Sheet.
- 20 ready chart views: Analyze sessions, revenue, cost, branches, status, category, membership, age group, trainers, and active minutes.
- Interactive slicers: Filter reports quickly during weekly, monthly, or branch-level reviews.
- Program analytics: Compare Avg Wellness, revenue, program cost, sessions, and category trends.
- Member analytics: Review sessions by branch, membership, age group, and membership trend by month.
- Trainer analytics: Track average score, trainer sessions, active minutes, and wellness score trend.
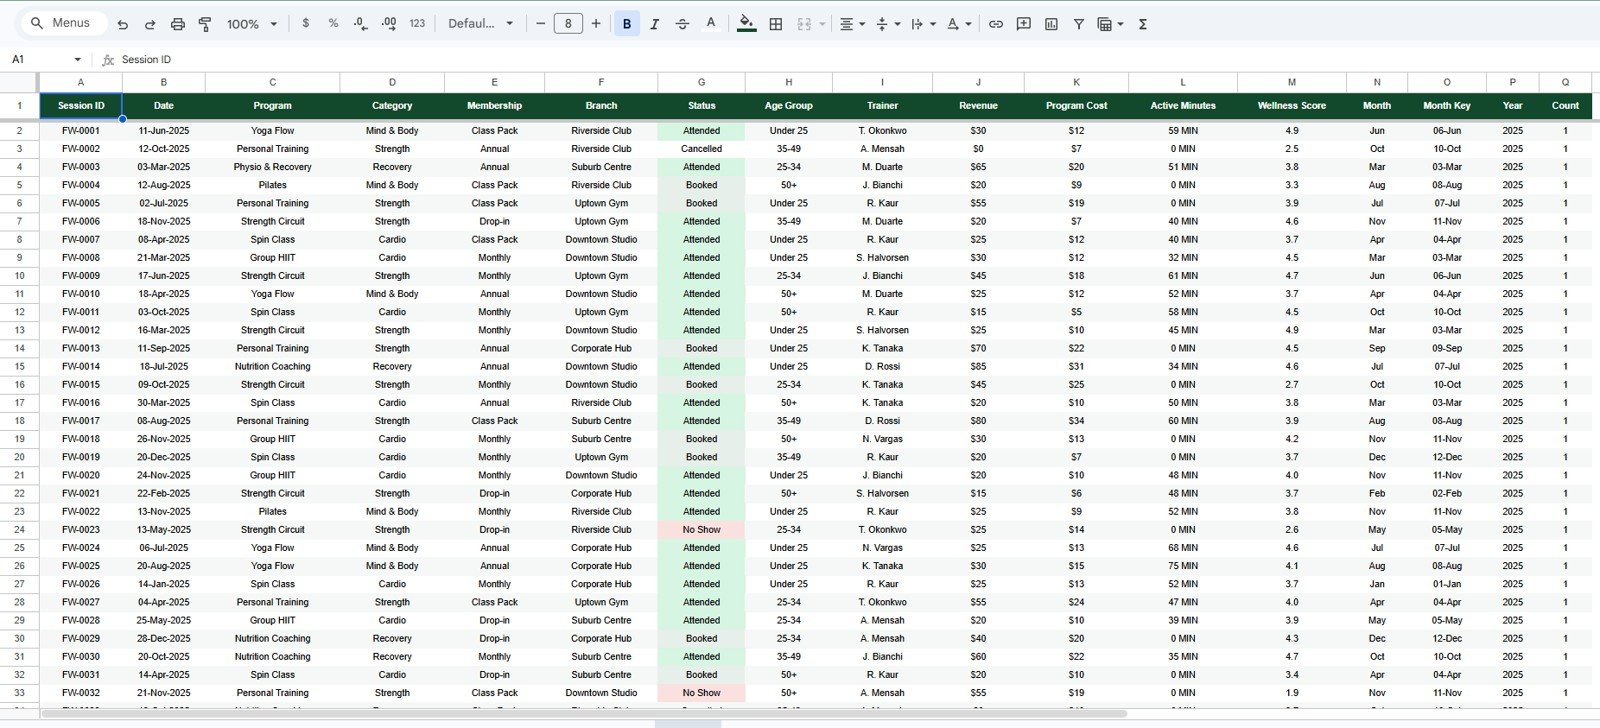
- Search sheet: Select a Session ID and view the full session record in one place.
- Data sheet: Replace the sample data with your own records in the same format.
Dashboard Pages Explanation
1 – Overview Page
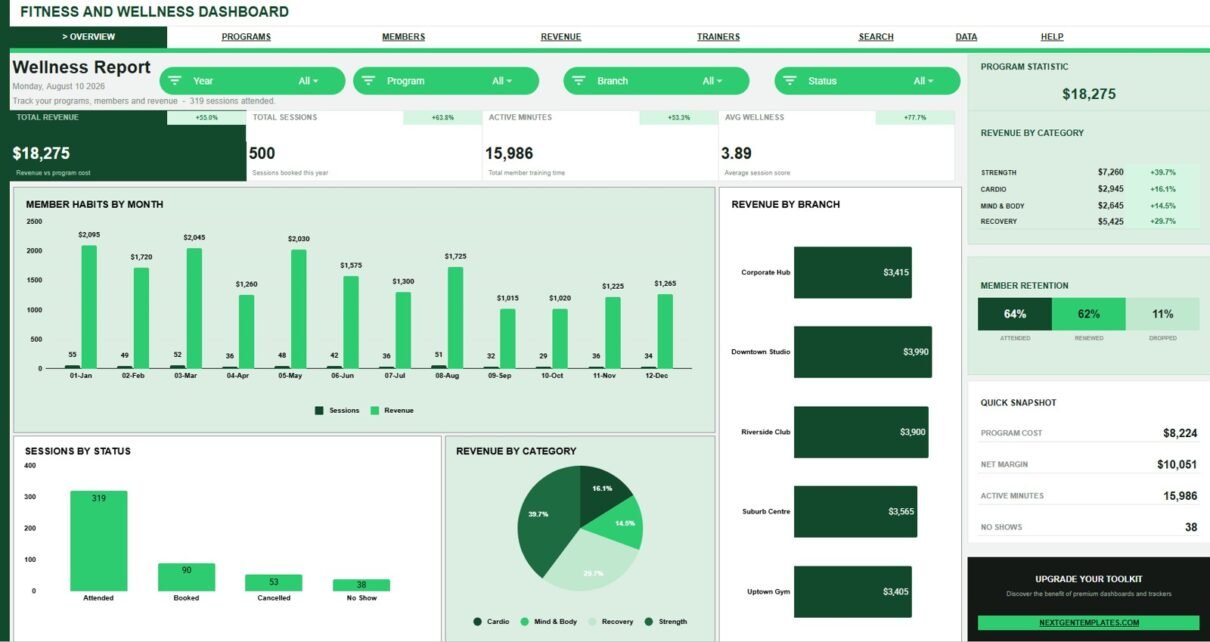
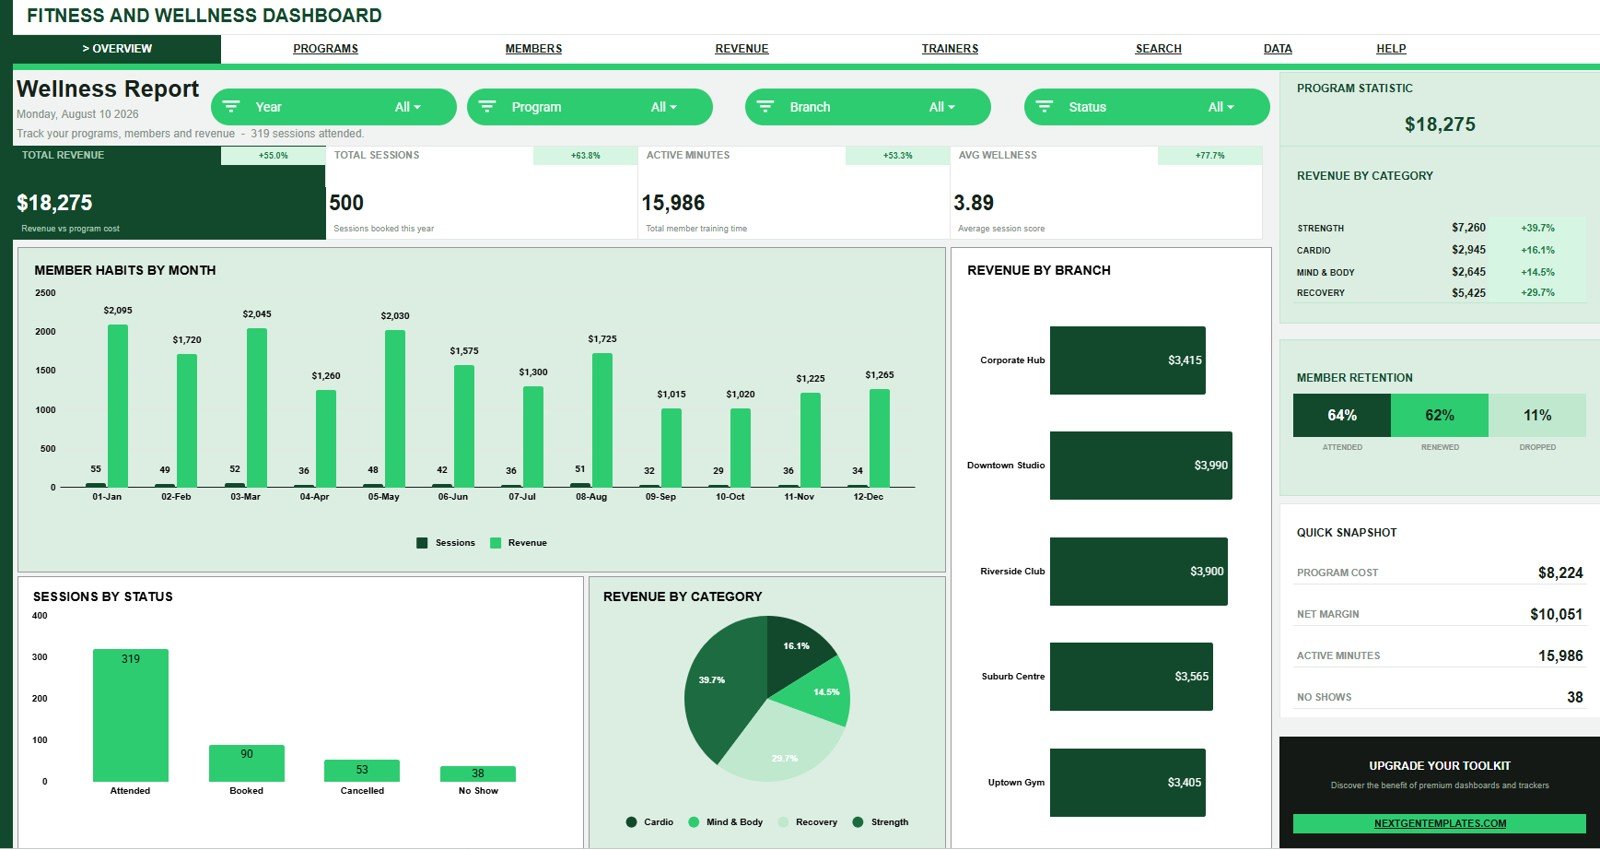
The Overview Page gives a quick leadership view of the fitness and wellness business. At the top, the dashboard shows Total Revenue, Total Sessions, Active Minutes, and Avg Wellness as KPI cards, while slicers let users filter the full page quickly.Fitness and Wellness Dashboard in Google Sheets
Sessions and Revenue by Month: This chart compares session volume with revenue across the month timeline. It helps managers see whether higher attendance is also producing stronger income.
Revenue by Branch: This chart compares revenue across branches or locations. It is useful for spotting which studio, club, or center is contributing the most to total revenue.
Sessions by Status: This chart separates sessions by status, such as completed, cancelled, scheduled, or other labels in the data. It helps teams find follow-up issues and understand service delivery quality.
Revenue by Category: This chart shows which program categories bring in the most revenue. It supports pricing, promotion, and capacity decisions by showing category-level contribution.
2 – Program Report
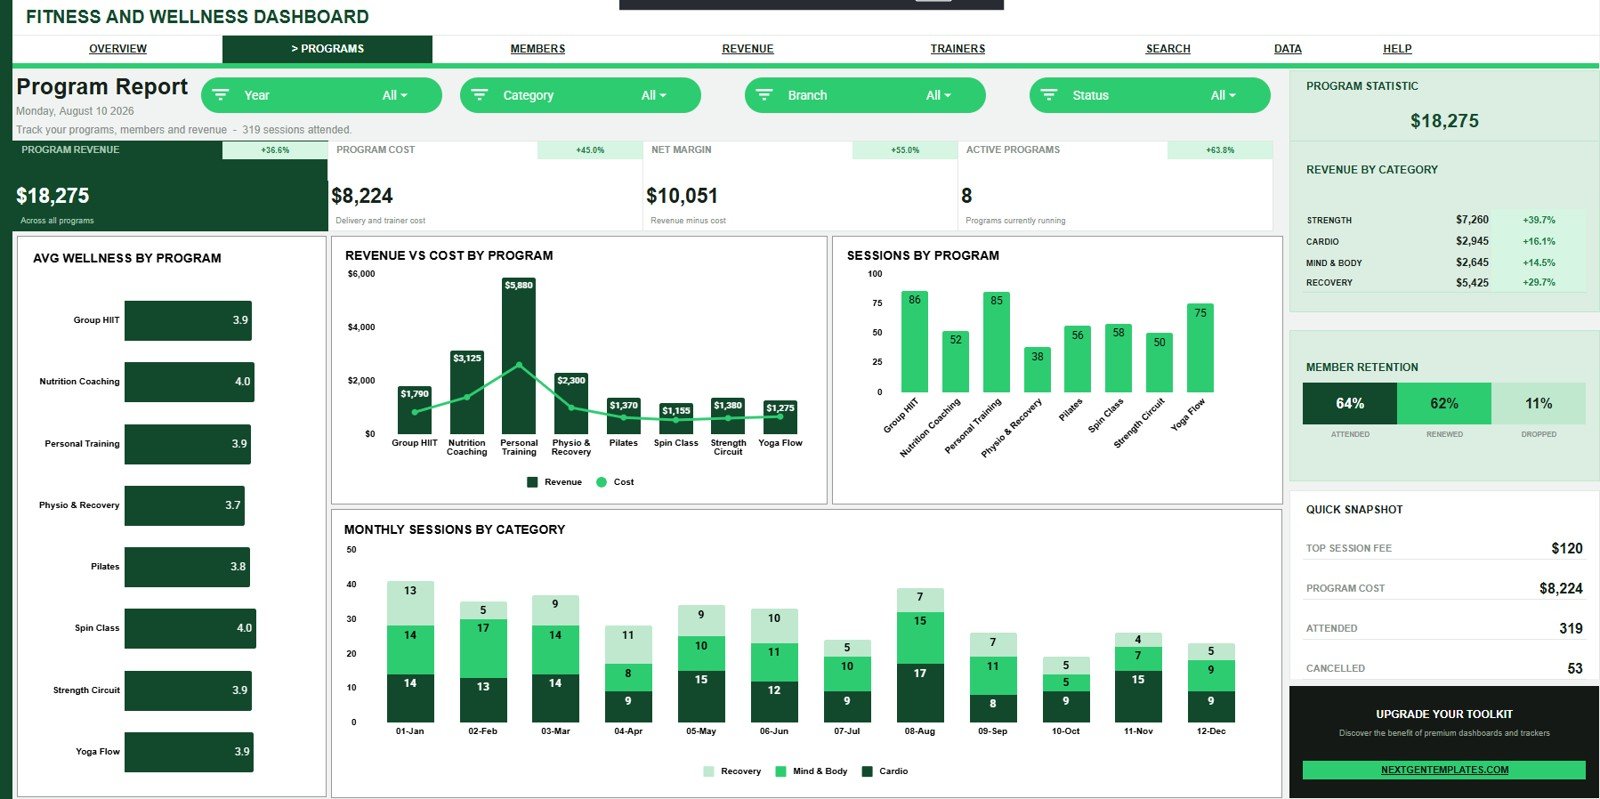
The Program Report focuses on the services and fitness programs behind the headline numbers. It is useful for comparing which programs are driving wellness outcomes, revenue, session volume, and cost.
Avg Wellness by Program: This chart compares average wellness score for each program. It helps managers identify which programs appear to produce stronger wellness outcomes.Fitness and Wellness Dashboard in Google Sheets
Revenue and Program Cost by Program: This chart compares income and cost for each program. It helps teams find high-revenue programs that may also need cost control.
Sessions by Program: This chart shows how many sessions are attached to each program. It helps teams understand demand and decide where schedule capacity may need to change.
Monthly Sessions by Category: This chart shows how session volume changes by category over time. It helps managers spot seasonality and changing demand across program types.
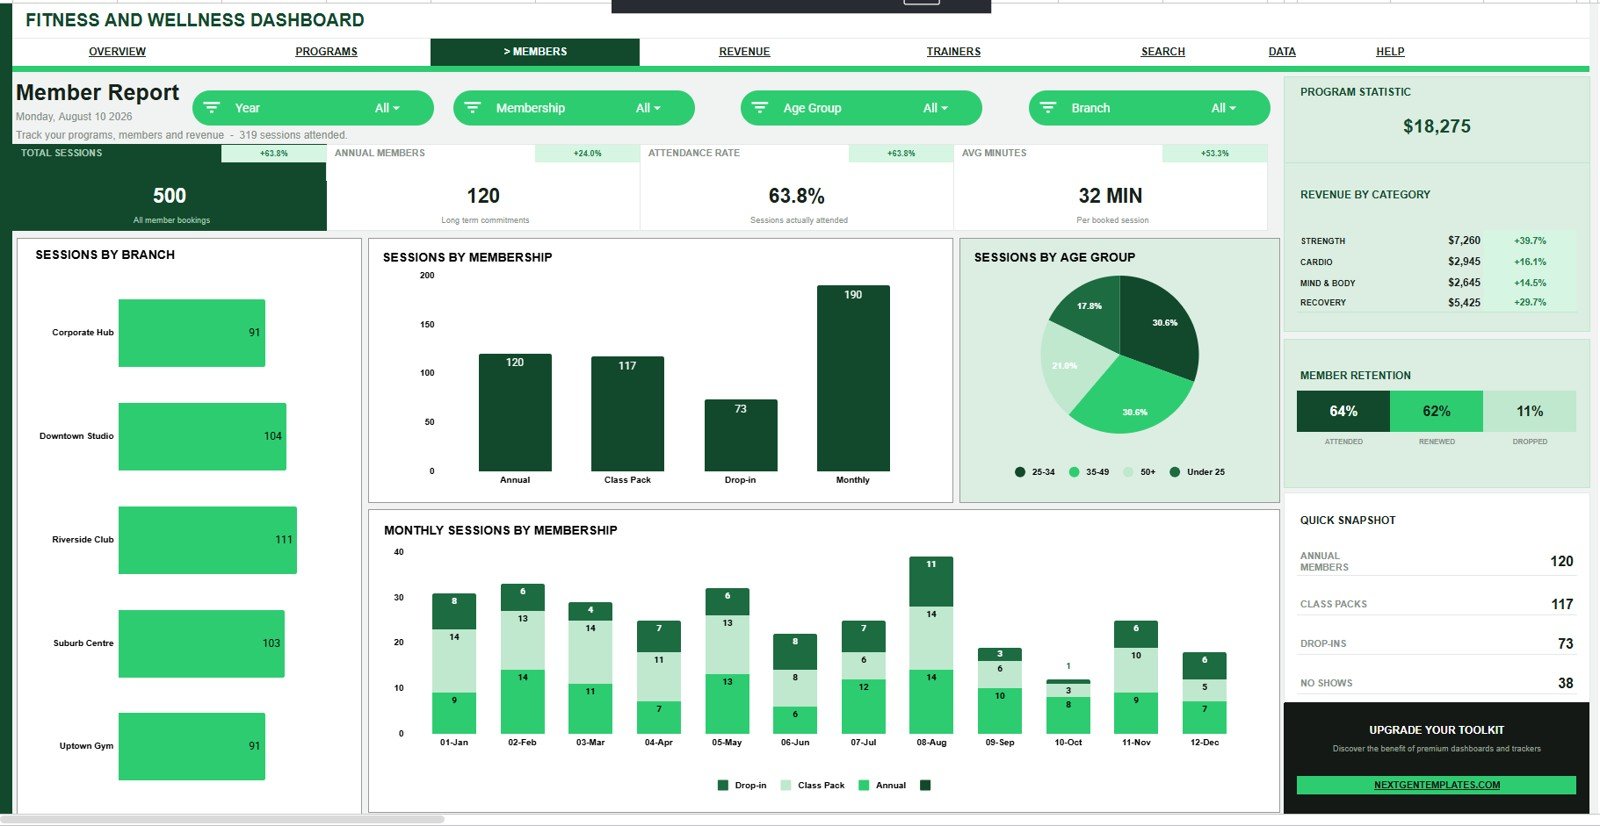
3 – Member Report
The Member Report explains how sessions are distributed across branches, membership types, age groups, and months. It helps gym and wellness teams understand who is attending and where engagement is strongest.Fitness and Wellness Dashboard in Google Sheets
Sessions by Branch: This chart compares session count across branches. It helps operators identify high-demand locations and branches that may need local outreach.
Sessions by Membership: This chart shows session volume by membership type. It helps teams understand which plans or tiers are most actively used.
Sessions by Age Group: This chart breaks participation into age groups. It supports program planning by showing whether younger, middle-age, or older members are most active.
Monthly Sessions by Membership: This chart shows how monthly session volume changes by membership type. It helps managers catch membership engagement shifts before they become retention problems.
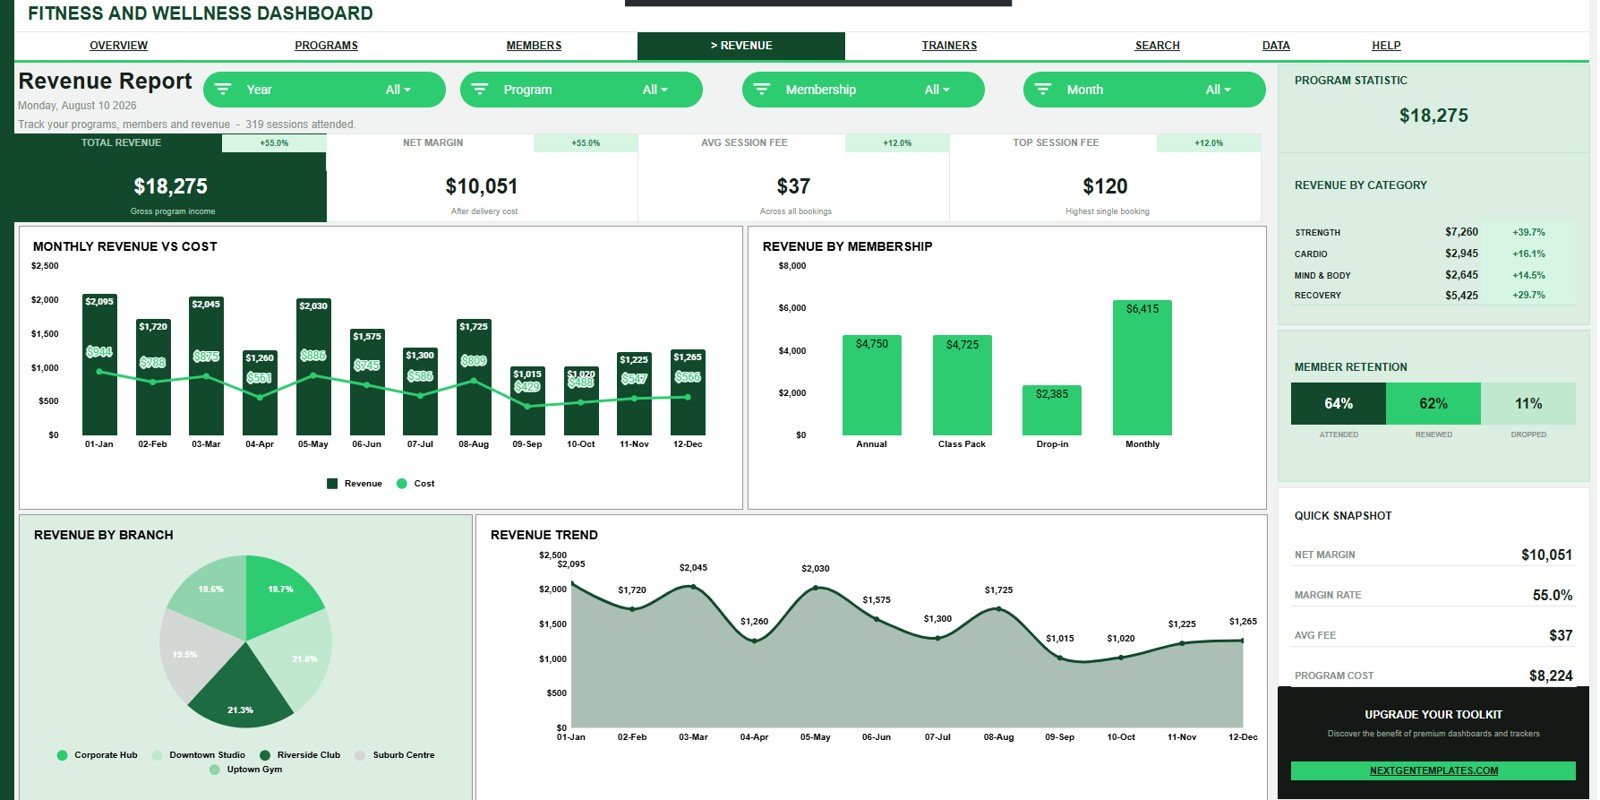
4 – Revenue Report
The Revenue Report separates financial views from program and member activity. It is built for monthly income review, cost checks, branch comparison, and membership revenue analysis.
Revenue and Cost by Month: This chart compares monthly revenue against program cost. It helps finance and operations teams see whether growth is improving or compressing margin.
Revenue by Membership: This chart shows revenue by membership type. It helps identify which membership plans produce the strongest income contribution.
Revenue by Branch: This chart compares branch-level revenue. It supports branch reviews, local targets, and conversations about staffing or promotion.
Revenue by Month: This chart shows revenue trend across the selected time period. It helps managers review seasonality, campaigns, and monthly sales movement.
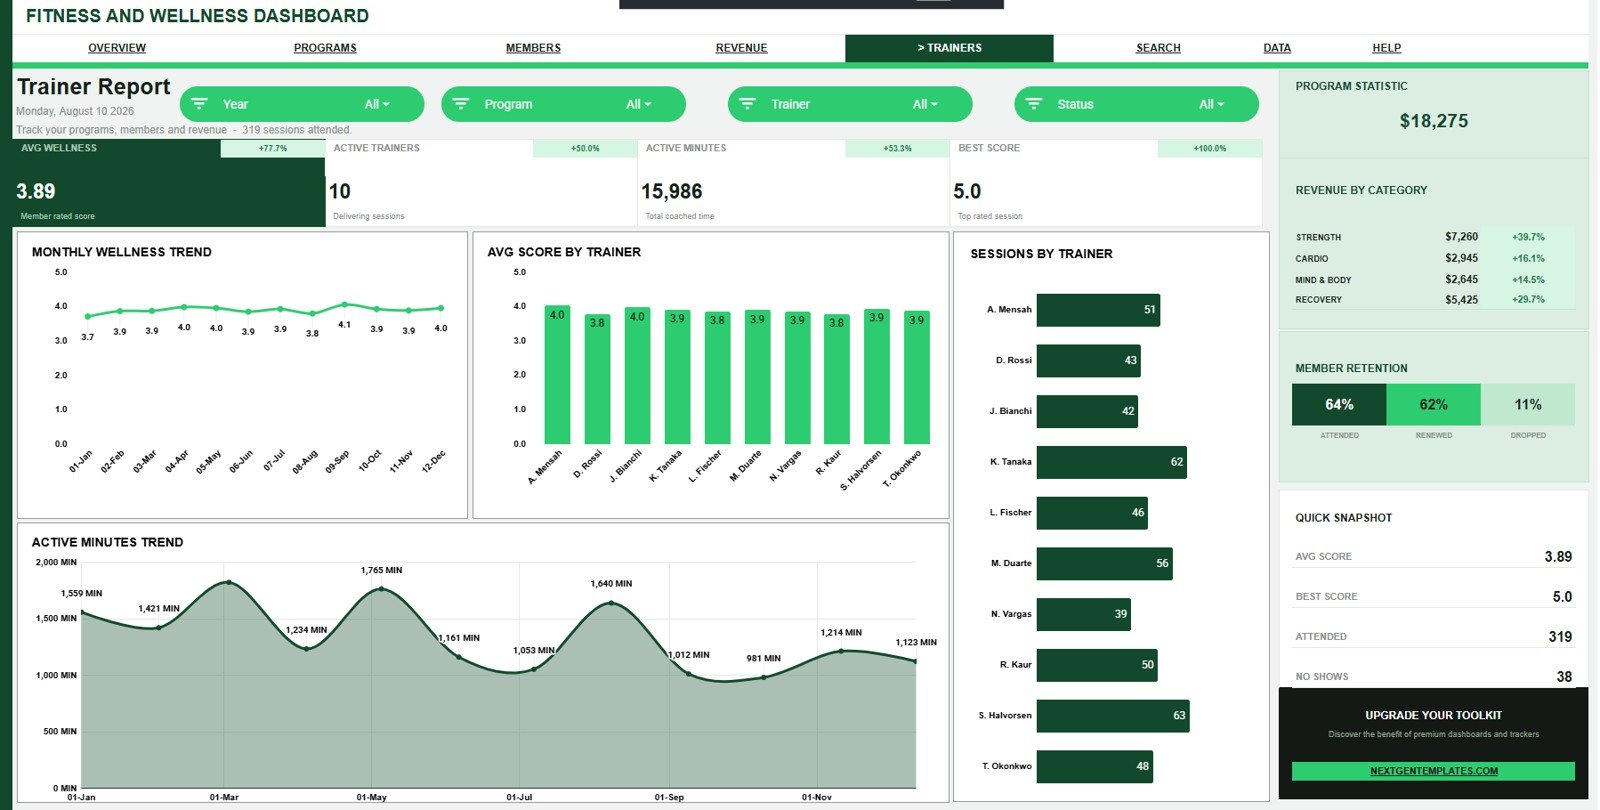
5 – Trainer Report
The Trainer Report connects trainer workload with wellness outcomes and active-minute trends. It gives studio managers a cleaner way to compare trainer contribution without scanning raw session rows.
Wellness Score by Month: This chart tracks wellness score over time. It helps teams see whether outcomes are improving, flat, or declining month by month.
Average Score by Trainer: This chart compares average score across trainers. It helps managers identify trainer-level strengths, coaching needs, and service consistency.
Sessions by Trainer: This chart shows how session volume is distributed among trainers. It helps review workload balance and trainer utilization.
Active Minutes by Month: This chart tracks total active minutes by month. It helps teams connect program activity with member effort and engagement levels.
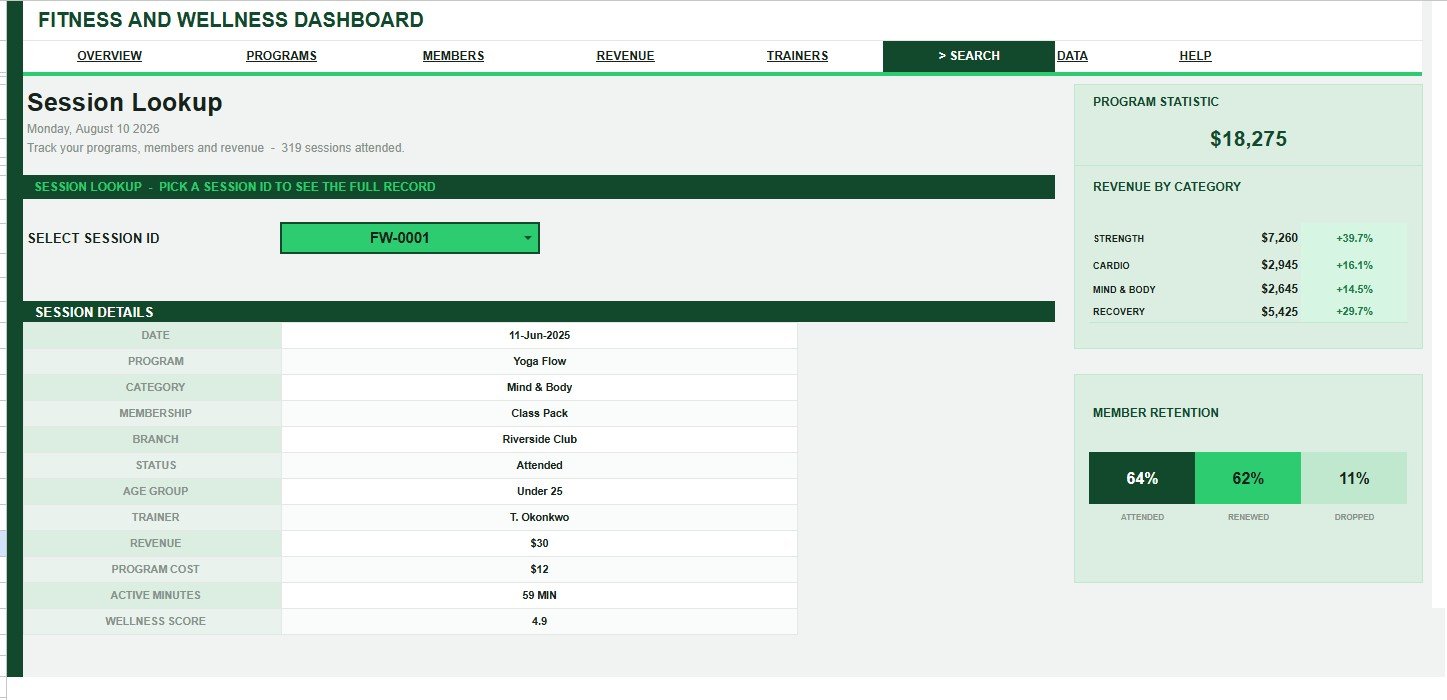
6 – Search Sheet Tab
The Search Sheet is designed for record-level review. Select a Session ID to see date, program, category, membership, branch, status, age group, trainer, revenue, program cost, active minutes, and wellness score without scrolling the raw data sheet.
7 – Data Sheet Tab
The Data Sheet stores the underlying records. Add your own data in the same format so the overview cards, analysis pages, slicers, charts, and search lookup keep working correctly.
Fitness and Wellness Dashboard in Google Sheets vs. Microsoft Excel vs. Paid Fitness SaaS – Feature Comparison
| Feature | This Google Sheets dashboard | Microsoft Excel dashboard | Paid fitness SaaS |
|---|---|---|---|
| Cost | $9.99 one-time | Template cost plus Excel access | Monthly or annual subscription |
| Platform | Google Sheets in browser | Excel desktop or web | Vendor cloud platform |
| Setup time | Copy file, replace data, review | Open workbook and refresh | Account setup and onboarding |
| Real-time collaboration | Built into Google Drive sharing | Depends on OneDrive or SharePoint setup | Usually included by plan |
| Mobile access | Google Sheets app or browser | Excel app or web viewer | Usually included |
| Customizable fields | Edit sheet fields, formulas, and visuals | Edit workbook formulas and pivots | Often limited by vendor settings |
| Share with link | Yes, subject to Drive permissions | Yes, subject to Microsoft sharing setup | Usually login controlled |
| Year-1 cost at 5 users | $9.99 plus any Google Workspace cost | Template plus licensing | Often hundreds or thousands |
| Best fit | Fast internal reporting for fitness and wellness sessions | Offline or Excel-first reporting | Full operational workflows such as booking and billing |
Who Should Use This Template
This template is useful for gym owners, boutique fitness studios, wellness centers, yoga and pilates operators, personal training teams, corporate wellness coordinators, and sports facility managers who already have session data and want fast reporting in Google Sheets.
It is not a replacement for booking software, payment processing, member check-in systems, wearable data platforms, CRM workflows, or medical record tools. Use it as an analytics layer for prepared session data, not as the system of record for regulated health information.
Real-World Use Cases
Maya runs a boutique studio: Every Monday, she checks Sessions and Revenue by Month, Revenue by Category, and Sessions by Trainer before changing next week’s schedule.Fitness and Wellness Dashboard in Google Sheets
Arjun manages a wellness center: He reviews Avg Wellness by Program and Wellness Score by Month to see which programs are producing stronger client outcomes.Fitness and Wellness Dashboard in Google Sheets
Sofia handles branch reporting: She uses Revenue by Branch, Sessions by Branch, and the Search Sheet to prepare quick notes for each location manager.Fitness and Wellness Dashboard in Google Sheets
Advantages of Fitness and Wellness Dashboard in Google Sheets
The first advantage is speed. Instead of creating separate reports for programs, members, revenue, and trainers, users can update one Data Sheet and review connected dashboard pages.
The second advantage is accessibility. Google Sheets works in the browser and can be shared with managers or trainers using Drive permissions.
The third advantage is ownership. The file stays editable, so users can change labels, add rows, adjust formulas, and adapt the dashboard to their own fitness or wellness workflow.Fitness and Wellness Dashboard in Google Sheets
Opportunities for Improvement
The dashboard depends on manual or exported session data. It does not connect directly to booking tools, payment processors, access-control systems, wearable devices, or member apps unless a user adds a custom integration.
It also does not enforce privacy controls by itself. If your data includes sensitive health or member information, you should review your organization’s privacy, consent, and sharing requirements before adding live records.
Best Practices
- Keep the Data Sheet column structure unchanged when replacing sample data.
- Use consistent program, category, membership, branch, status, age group, and trainer names.
- Review slicer selections before presenting dashboard numbers.
- Use the Search Sheet when one session record needs audit or follow-up.
- Protect formula and chart areas before sharing edit access with a team.
- Make a backup copy before changing formulas or adding new report fields.
Explore Relevant Templates
- Fitness Trainer Dashboard in Google Sheets for trainer and session reporting.
- Fitness Studio KPI Dashboard in Google Sheets for KPI-style studio tracking.
- Yoga Wellness Studio Dashboard in Power BI for Power BI studio analytics.
- Employee Wellness KPI Dashboard in Google Sheets for workplace wellness KPIs.
- Fitness Industry KPI Dashboard in Google Sheets on NeoTechNavigators.
- Browse Google Sheets dashboard templates on NextGenTemplates.
If you would like to build dashboards like this from your own session data, the Excel Pivot Tables & Dashboards course on NextGenTemplates Academy covers the method step by step, with practice files.
Frequently Asked Questions
What is included in the Fitness and Wellness Dashboard in Google Sheets?
It includes Overview, Program Report, Member Report, Revenue Report, Trainer Report, Search Sheet, and Data Sheet tabs.
What KPI cards are shown on the Overview page?
The Overview page shows Total Revenue, Total Sessions, Active Minutes, and Avg Wellness.Fitness and Wellness Dashboard in Google Sheets
Can I use my own fitness session data?
Yes. Replace the sample rows in the Data Sheet tab using the same column structure, and the connected reports will update.Fitness and Wellness Dashboard in Google Sheets
Does this dashboard work for multiple branches?
Yes. The dashboard includes branch-based revenue and session views, so it can support single-location or multi-location reporting if your data includes a branch field.
Does it replace gym management software?
No. It is a reporting dashboard, not a booking, billing, attendance, or CRM platform.
Can I share it with my team?
Yes. After creating your own copy in Google Drive, you can share it using Google Sheets permissions.
About the Author
Built by PK – Microsoft Certified Professional with 15+ years of Excel, Google Sheets, and Power BI experience. Founder of NextGenTemplates, reaching 300K+ subscribers across YouTube channels. Every template is hand-built and tested before release.
Conclusion
The Fitness and Wellness Dashboard in Google Sheets gives fitness and wellness teams a clear way to monitor revenue, sessions, active minutes, wellness scores, program performance, member mix, branch activity, and trainer contribution from one editable workbook. It is a good fit when you need a practical dashboard layer, already have session records, and want the flexibility of Google Sheets without adding a full SaaS subscription.Fitness and Wellness Dashboard in Google Sheets