The Sports and Recreation Dashboard in Google Sheets turns booking records into a 7-tab reporting workbook with 4 executive KPI cards, 20 chart views, slicers, a Booking ID search sheet, and a structured Data Sheet. For a one-time $9.99 sale price, sports clubs, recreation centers, gyms, academies, and community facilities can review bookings, programme revenue, attendance rate, satisfaction, activity performance, facility utilisation, memberships, coaching, and monthly trends without building a dashboard from scratch.
Because this template runs in Google Sheets, managers can work in a familiar browser-based file and share access through Google Drive. Google explains file sharing and permission roles in its Google Docs Editors sharing guide, which makes this dashboard practical for teams that want controlled collaboration without moving into a full recreation SaaS platform.
Get the Sports and Recreation Dashboard in Google Sheets
Key Features of Sports and Recreation Dashboard in Google Sheets
- 4 headline cards: Total Bookings, Programme Revenue, Attendance Rate, and Avg Satisfaction.
- 7 sheet tabs: Overview, Activity Performance, Facility Utilisation, Membership & Revenue, Coaching & Experience, Search Sheet, and Data Sheet.
- 20 ready chart views: Analyze bookings, revenue, operating cost, facilities, activities, time slots, membership type, age group, coaches, satisfaction, and session hours.
- Interactive slicers: Filter every report quickly during monthly operations, coaching, finance, or facility reviews.
- Booking lookup: Select a Booking ID and see the complete booking record in one clean view.
- Editable source data: Replace the sample records with your own booking data in the same format.
Dashboard Pages Explanation
1 – Overview Page
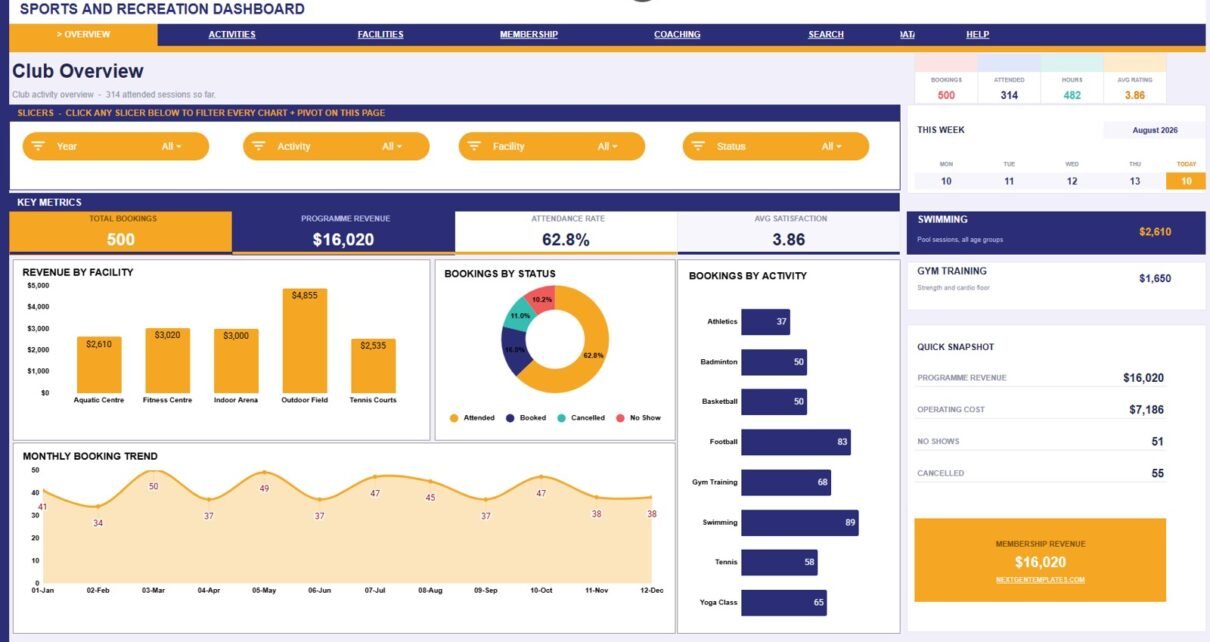
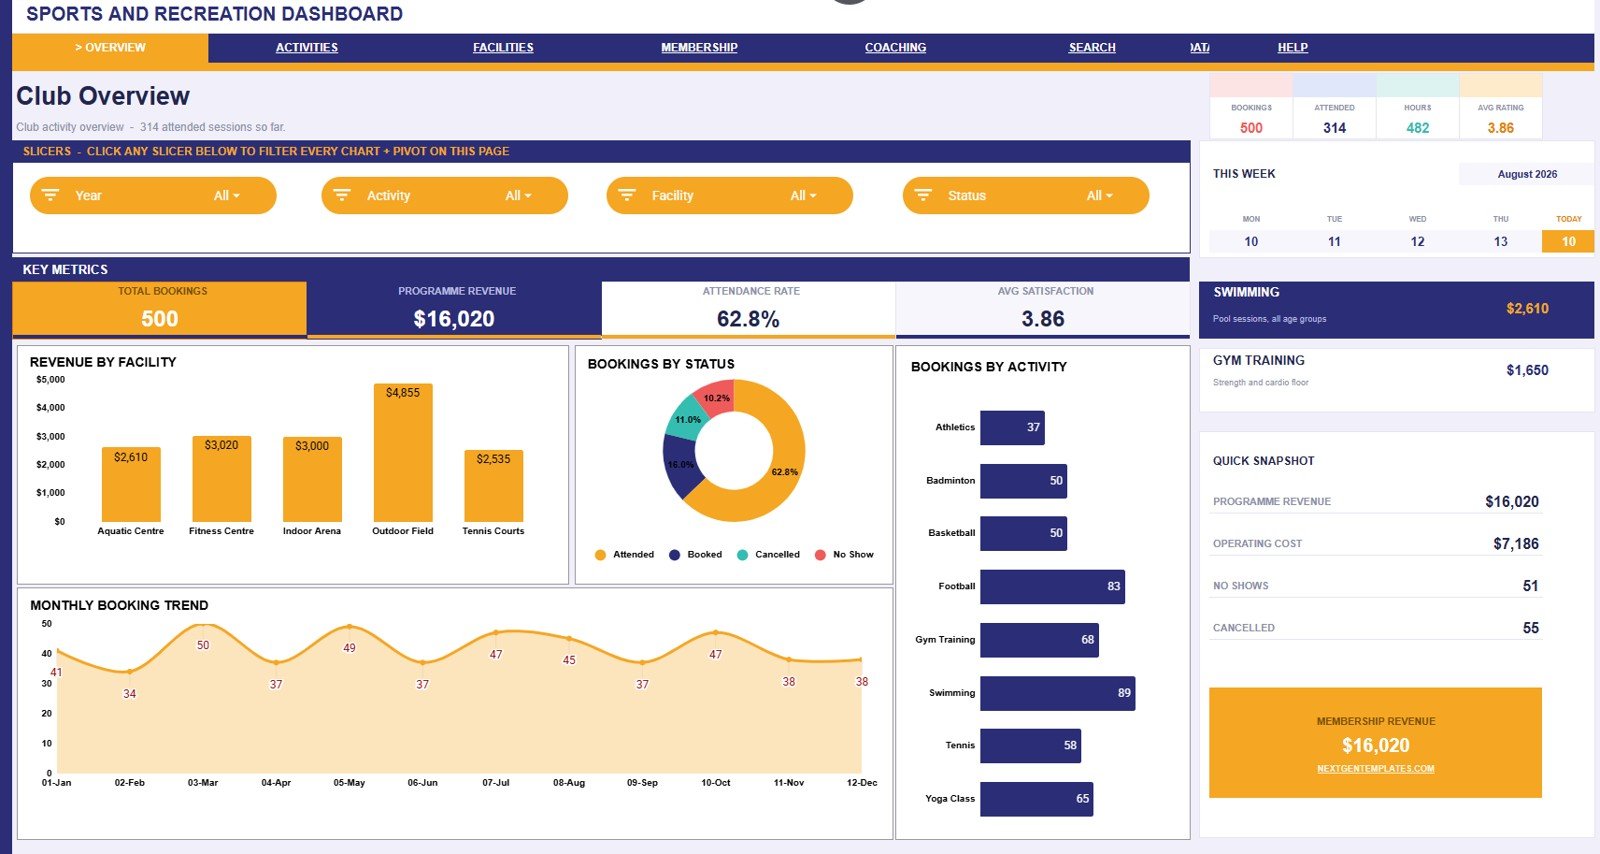
The Overview Page gives leaders the fastest readout of the sports and recreation operation. The top cards show Total Bookings, Programme Revenue, Attendance Rate, and Avg Satisfaction, while slicers help users filter the dashboard by available fields.
Revenue by Facility: This chart compares programme revenue across facilities. Use it to identify which courts, pools, gyms, halls, or activity spaces contribute most to total revenue.
Bookings by Status: This chart separates bookings by status, such as completed, cancelled, scheduled, or similar labels in your data. It helps teams understand delivery quality and follow-up workload.
Bookings by Activity: This chart shows booking volume by sports or recreation activity. It helps managers decide where capacity, staffing, and promotion should be adjusted.
Bookings by Month: This chart shows monthly booking movement. It helps teams identify seasonal demand, slow periods, and growth patterns.
2 – Activity Performance
The Activity Performance tab compares each activity from both a financial and experience angle. Revenue and Cost by Activity shows whether income is keeping pace with operating cost, while Session Hours by Activity shows how much capacity each program consumes.
Avg Satisfaction by Activity helps managers compare the participant experience across different sports and recreation programs. Monthly Bookings by Facility adds a time-based facility view, making it easier to see where demand is rising or slowing.
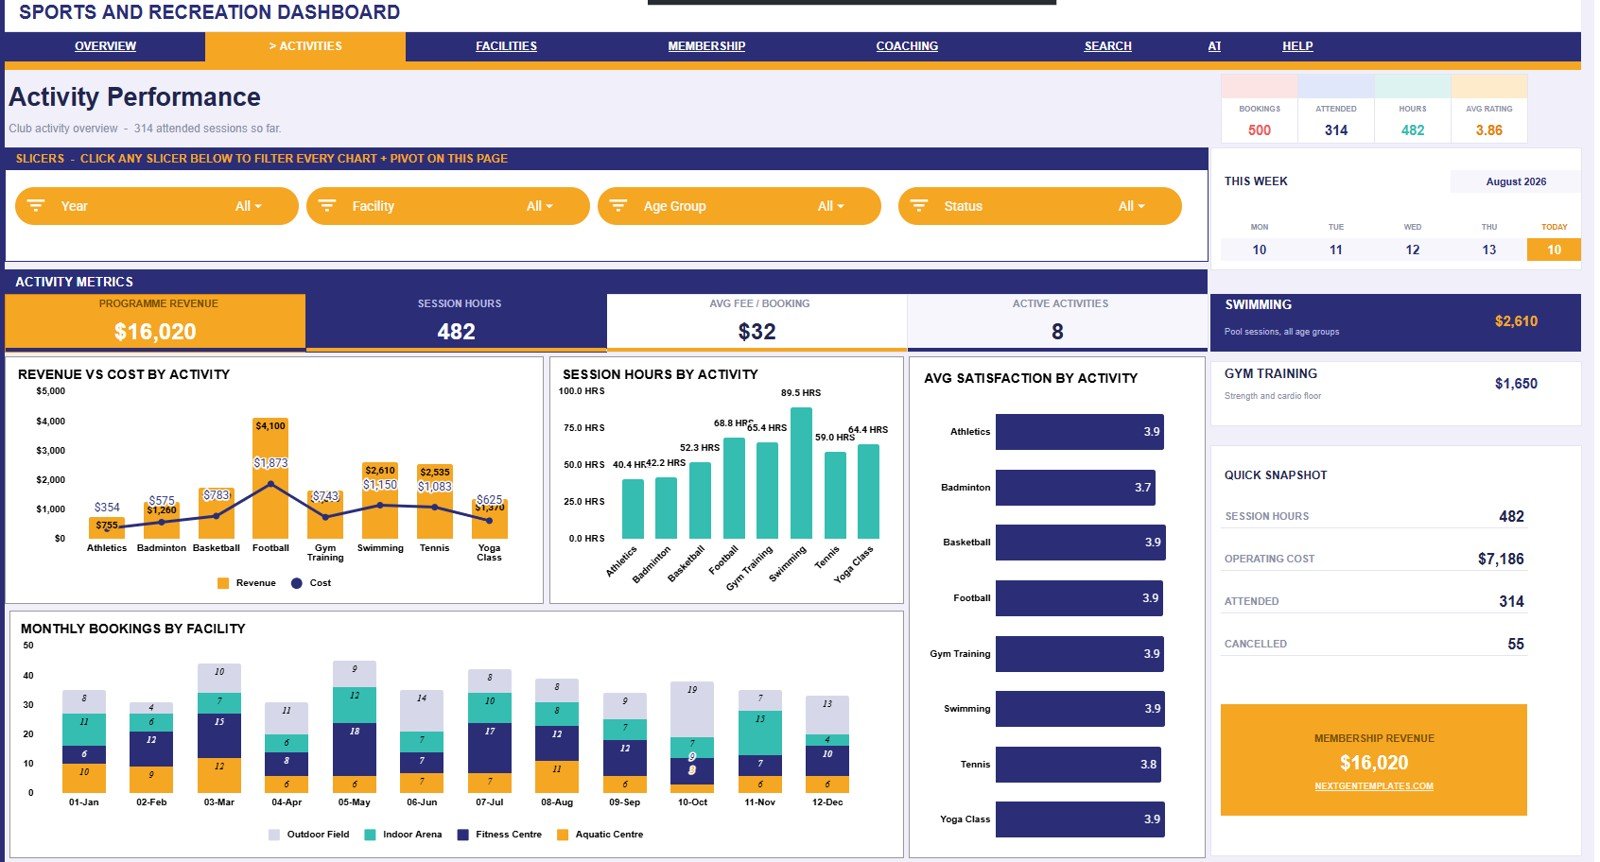
3 – Facility Utilisation
The Facility Utilisation tab focuses on how spaces are being used. Session Hours by Facility helps identify high-use and underused areas, while Bookings by Time Slot shows when demand is concentrated during the day.
Operating Cost by Facility helps teams see which facilities carry the highest cost. Monthly Bookings by Time Slot shows whether specific time periods are gaining or losing booking volume over time.

4 – Membership & Revenue
The Membership & Revenue page connects booking revenue with member behavior. Monthly Revenue vs Cost shows margin direction, while Revenue by Membership Type compares annual members, corporate groups, day passes, monthly members, or any membership labels in your data.
Bookings by Age Group helps teams understand who is using the programs. Revenue Trend shows income movement across the year so finance and operations teams can plan promotions, staffing, and capacity reviews.
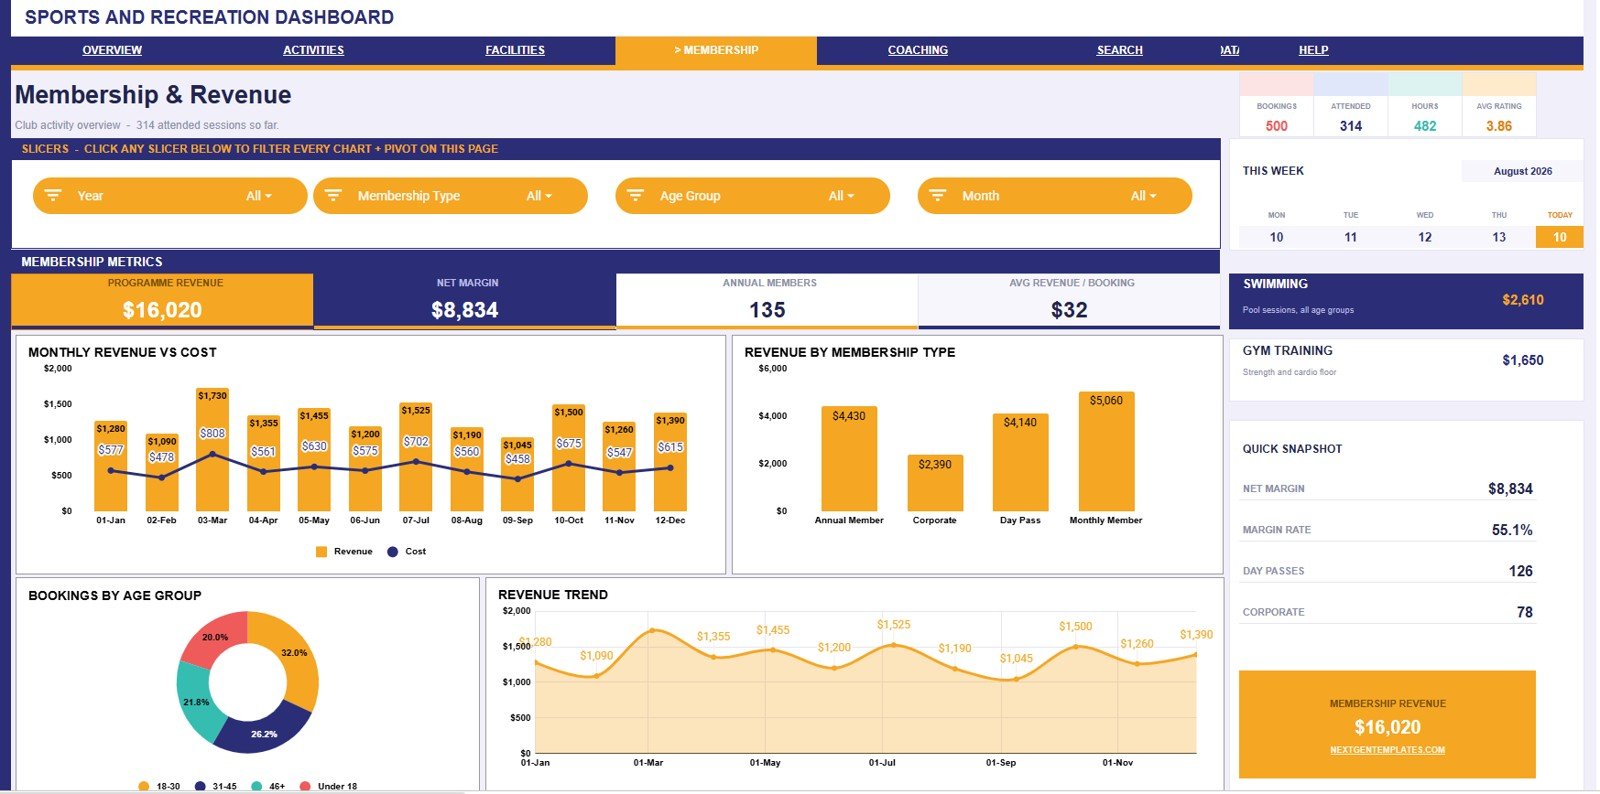
5 – Coaching & Experience
The Coaching & Experience tab helps supervisors connect coach workload with participant satisfaction. Satisfaction Score by Month shows experience trends, while Avg Score by Coach compares coach-level feedback.
Bookings by Coach shows how demand is distributed across staff. Session Hours by Month helps managers review workload and capacity across the reporting period.
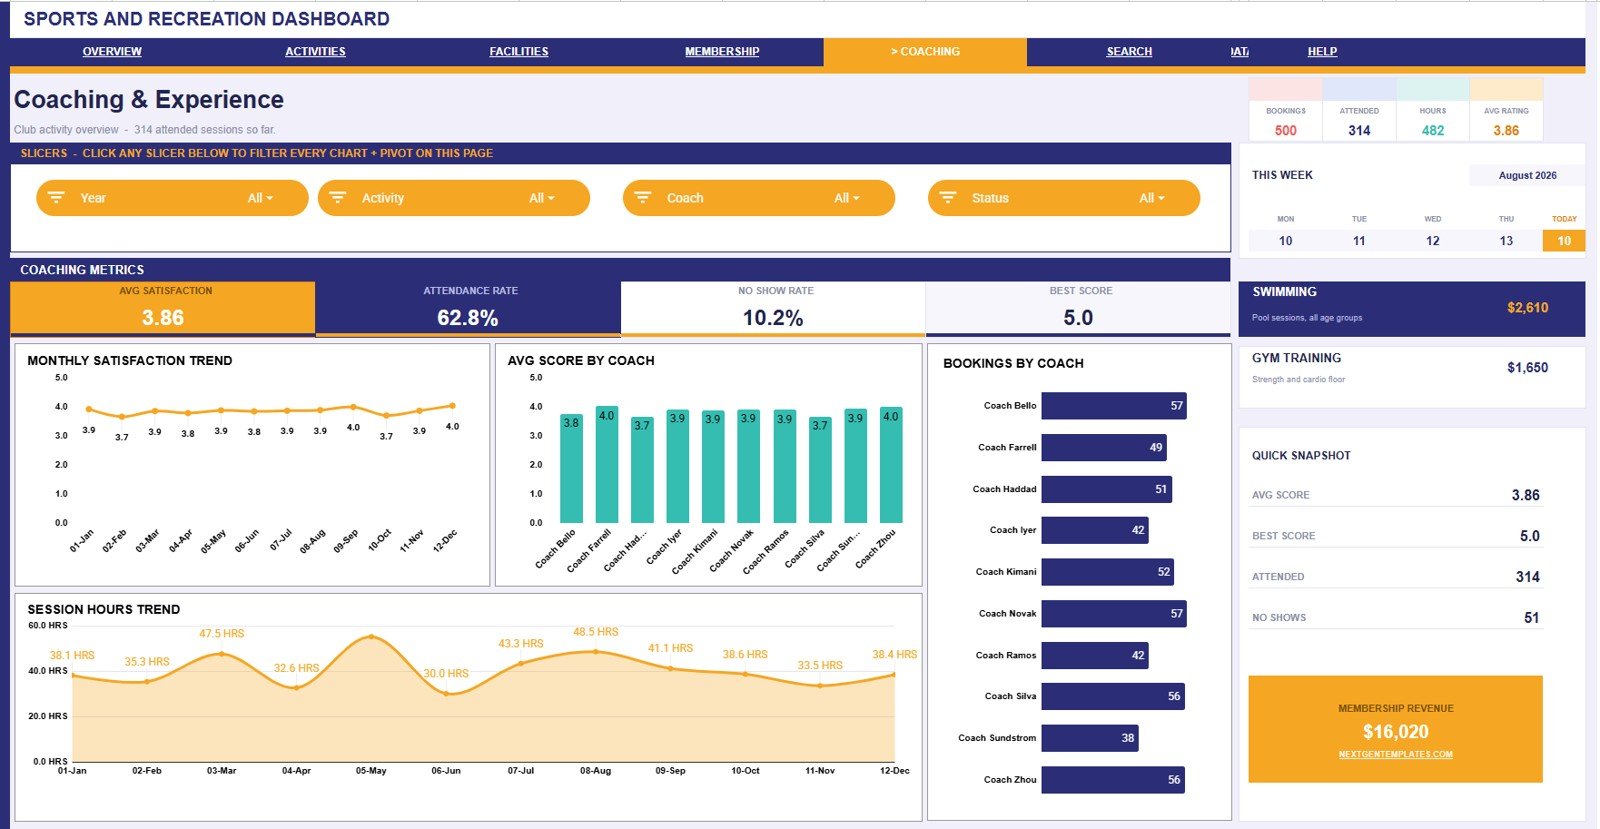
6 – Booking Lookup Search Sheet
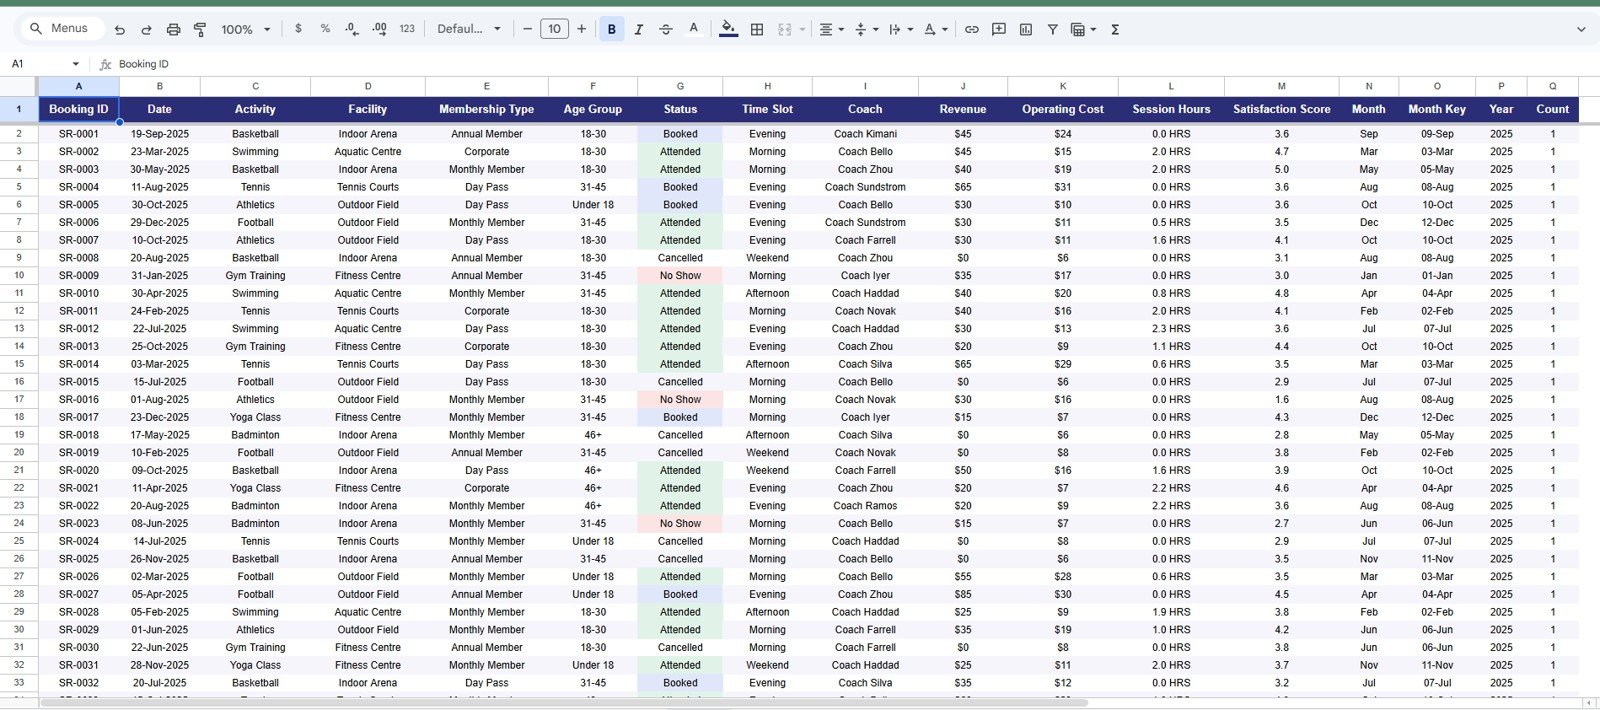
The Search Sheet is designed for record-level review. Select a Booking ID and the sheet returns date, activity, facility, membership type, age group, status, time slot, coach, revenue, operating cost, session hours, and satisfaction score without forcing users to scroll through the raw data.
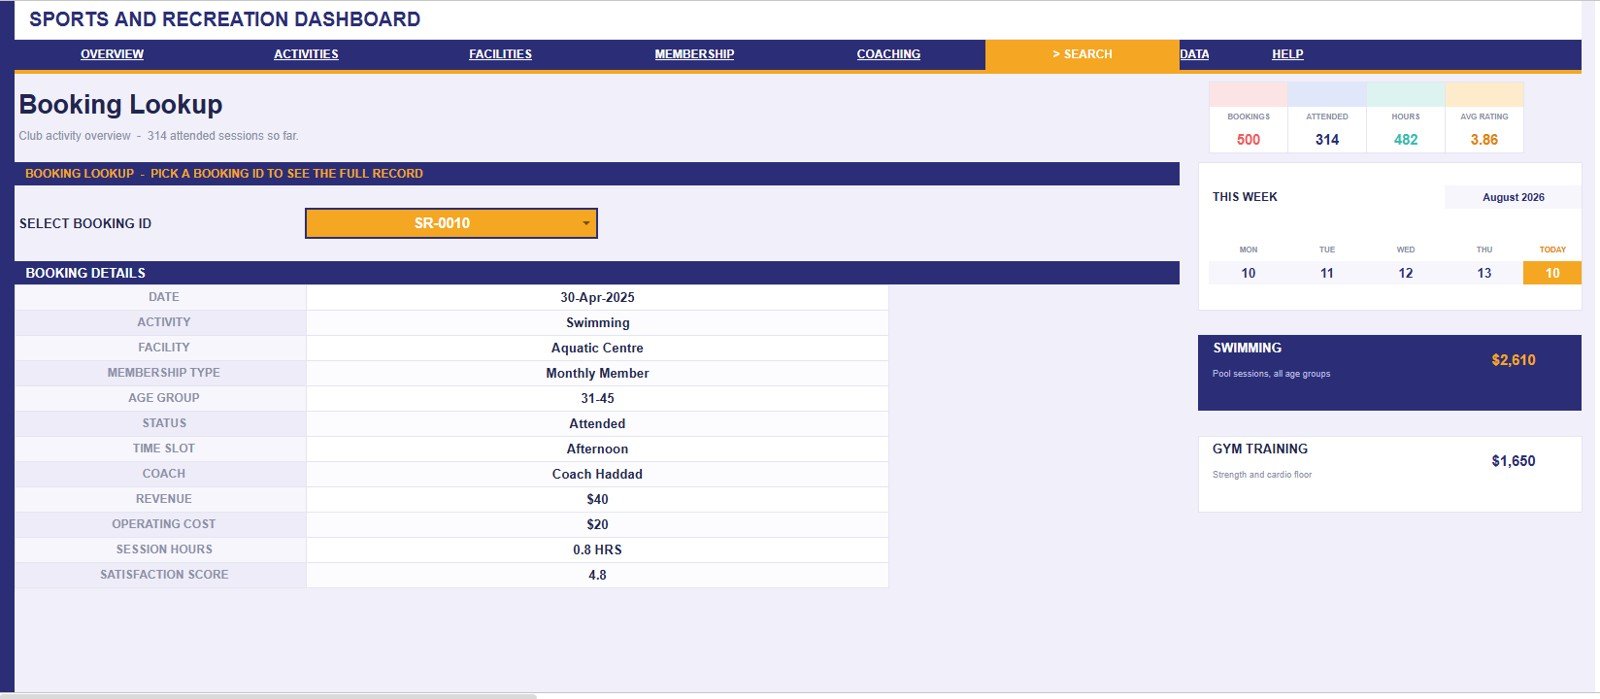
7 – Data Sheet Tab
The Data Sheet stores the underlying booking records. Add your data in the same format and keep the column structure consistent so the cards, slicers, charts, analysis pages, and search lookup continue working correctly.Sports and Recreation Dashboard in Google Sheets
Sports and Recreation Dashboard in Google Sheets vs. Microsoft Excel Dashboard vs. Paid CRM/SaaS – Feature Comparison
| Feature | This Google Sheets template | Microsoft Excel dashboard | Paid recreation SaaS |
|---|---|---|---|
| Cost | $9.99 one-time | Template price plus Excel access | Monthly or annual subscription |
| Platform | Google Sheets in browser | Excel desktop or Microsoft 365 | Vendor cloud platform |
| Setup time | Copy file, paste records, review charts | Open workbook and refresh | Implementation and configuration |
| Real-time team collaboration | Built into Google Drive sharing | Possible through OneDrive | Usually available by paid user |
| Mobile access | Google Sheets app and browser | Excel mobile with limits | Usually included |
| Customizable fields | Editable sheets, formulas, charts, and slicers | Editable workbook | Often limited by vendor setup |
| Share with link | Yes, controlled by Google permissions | Possible through Microsoft sharing | Usually login based |
| Year-1 cost at 5 users | $9.99 plus any Google Workspace plan already used | Template plus Microsoft licensing | Varies by vendor and seat count |
| Booking ID lookup | Built-in Search Sheet | Requires setup unless included | Usually included |
Who Should Use This Template
This template fits sports club managers, recreation center directors, gym administrators, coaching coordinators, community facility teams, school sports departments, municipal recreation teams, and consultants who need a clean reporting layer for booking data.Sports and Recreation Dashboard in Google Sheets
It works best when the team already exports or maintains booking records and wants to review them by facility, activity, coach, time slot, membership, status, age group, month, revenue, cost, hours, and satisfaction.Sports and Recreation Dashboard in Google Sheets
Real-World Use Cases
Maya, recreation center manager: uses the Overview and Activity Performance pages before schedule planning meetings to see which activities need more slots or better promotion.
Daniel, sports club finance lead: uses Membership & Revenue to compare monthly revenue vs cost, review membership type revenue, and prepare a simple finance summary for leadership.
Aisha, coaching coordinator: uses Coaching & Experience to compare average coach scores, session hours, bookings by coach, and satisfaction movement by month.
Advantages of Sports and Recreation Dashboard in Google Sheets
The main advantage is speed. Instead of creating charts from blank sheets, users can copy the template, replace sample records, and start reviewing booking trends right away.Sports and Recreation Dashboard in Google Sheets
The second advantage is transparency. The Data Sheet stays visible, so users can trace dashboard numbers back to the booking record format.Sports and Recreation Dashboard in Google Sheets
The third advantage is collaboration. Google Sheets makes it easy for managers, coaches, and analysts to review the same dashboard with controlled access.
Opportunities for Improvement
This dashboard does not replace a live booking engine, payment gateway, member app, attendance scanner, access-control tool, or sports league registration system. It also does not automatically sync with a CRM or payment processor.
For larger organizations, the best setup is to export clean booking records from the source system and use this dashboard as a lightweight analysis and reporting layer.
Best Practices
- Keep the Data Sheet column structure unchanged unless you are comfortable editing formulas and charts.
- Use consistent names for activities, facilities, coaches, membership types, statuses, and time slots.
- Review revenue and operating cost totals against your finance records before leadership reporting.Sports and Recreation Dashboard in Google Sheets
- Protect formula-driven areas so accidental edits do not break cards, charts, or slicers.
- Use slicers during meetings to answer questions by activity, facility, month, status, time slot, coach, or membership type.
- Use the Search Sheet when someone asks about one specific Booking ID.
Explore Relevant Templates
Get the product here: Sports and Recreation Dashboard in Google Sheets.
You may also like Sports & Recreation Dashboard in Excel, Sports & Recreation KPI Dashboard in Excel, Sports & Recreation Dashboard in Power BI, Sports & Recreation KPI Dashboard in Power BI, and Fitness and Wellness Dashboard in Google Sheets.
To build dashboards like this from your own booking data, the Excel Pivot Tables & Dashboards course on NextGenTemplates Academy walks through the techniques with practice files.
Get the Sports and Recreation Dashboard in Google Sheets
Frequently Asked Questions
Is this dashboard built in Google Sheets?
Yes. It is built for Google Sheets and can be copied to Google Drive for editing, sharing, and collaboration.Sports and Recreation Dashboard in Google Sheets
What cards are included on the Overview page?
The Overview page includes Total Bookings, Programme Revenue, Attendance Rate, and Avg Satisfaction.Sports and Recreation Dashboard in Google Sheets
What does the Search Sheet do?
The Search Sheet lets you select a Booking ID and view the full record details, including date, activity, facility, membership type, age group, status, time slot, coach, revenue, operating cost, session hours, and satisfaction score.
Can I replace the sample data?
Yes. Add your own booking records in the Data Sheet using the same format and keep the column structure consistent.
Does this dashboard connect to booking software?
No direct connector is included. Export or prepare your booking records first, then paste them into the Data Sheet.
Can multiple people use it?
Yes. Google Sheets supports team sharing, and you can control view or edit permissions through Google Drive.
About the Author
Built by PK – Microsoft Certified Professional with 15+ years of Excel, Google Sheets, and Power BI experience. Founder of NextGenTemplates, reaching 300K+ subscribers across YouTube channels. Every template is hand-built and tested before release.
Conclusion
The Sports and Recreation Dashboard in Google Sheets gives sports and recreation teams a practical way to review bookings, programme revenue, attendance, satisfaction, activities, facilities, membership revenue, coaching performance, and source records in one shareable workbook. Use it when you need clear dashboard reporting without moving every workflow into a full sports management SaaS platform.Sports and Recreation Dashboard in Google Sheets