The Event Management Analysis Dashboard in HTML is a browser-based analytics solution designed to help event planners, corporate organizers, and marketing teams transform raw event data into meaningful business insights. Unlike traditional dashboards that require Excel, Power BI, or complex BI software, this HTML dashboard runs in any modern web browser — Chrome, Edge, Firefox, or Safari — with zero installation required.Event Management Analysis Dashboard in HTML
If you manage conferences, workshops, trade shows, fundraisers, or corporate events, you already know how challenging it is to pull together revenue, attendee, sponsorship, and budget numbers in one clear view. This Event Management Analysis Dashboard in HTML solves that problem with 5 interactive pages, 6 executive KPI cards, and 20+ dynamic charts packaged into one elegant file.
Event Management Analysis Dashboard Overview
👉 Click here to Purchase the Event Management Analysis Dashboard in HTML
Key Features of the Event Management Analysis Dashboard in HTML
Before we dive into each page, let’s look at what makes this template unique. Built with clean HTML, CSS, and JavaScript, it works offline once downloaded and delivers enterprise-grade analytics without enterprise costs.Event Management Analysis Dashboard in HTML
- 5 Dedicated Analysis Pages — Overview, Event Type Analysis, Regional Performance, Budget & Attendance, and Data View.
- 6 Executive KPI Cards — Total Events, Total Revenue, Total Attendees, Avg Satisfaction, Sponsorship, and Avg Budget.
- 6 Interactive Slicers — Event Type, Category, Region, Status, Marketing Channel, and Year.
- 20+ Dynamic Charts — Revenue, attendees, sponsorship, budget utilization, and satisfaction visualized clearly.
- Upload Excel & Reset — Load your own Excel data in the browser or reset to sample data instantly.
- Dark & Light Mode — Toggle between themes for comfortable viewing any time.
- Data View with Search, Sort, Pagination, and CSV Export — Manage thousands of records without opening a spreadsheet.
- No Software Required — Open index.html in any browser and start analyzing.
Dashboard Pages Explanation
This section walks through each page of the Event Management Analysis Dashboard so you know exactly what to expect before you download it.Event Management Analysis Dashboard in HTML
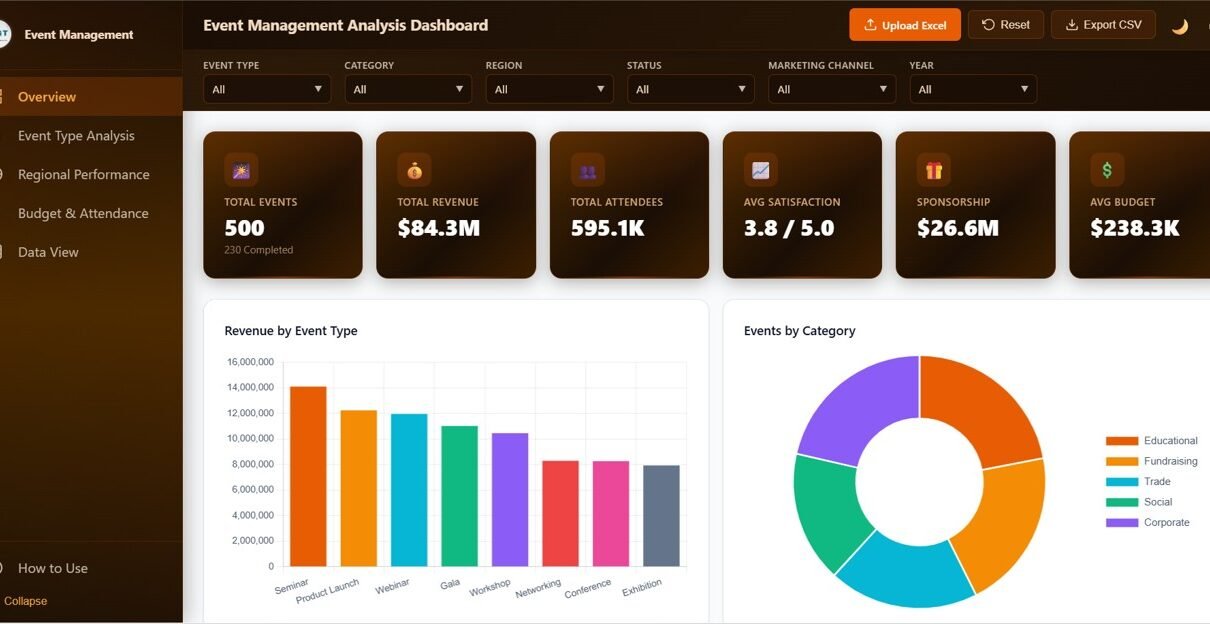
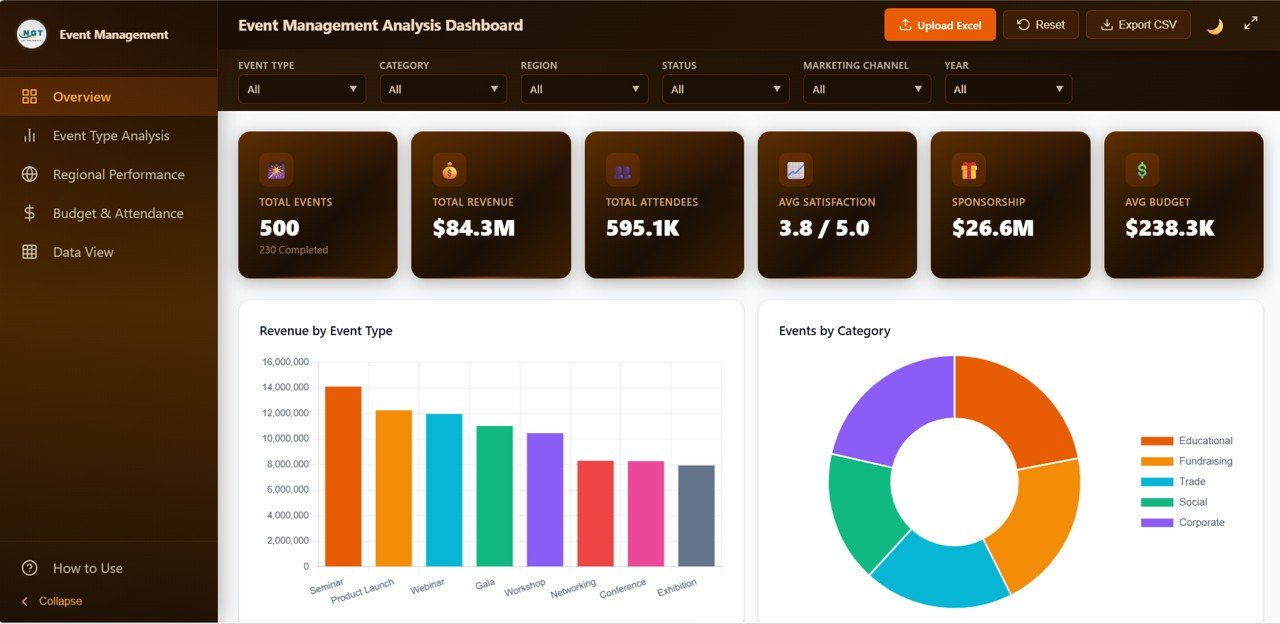
1. Overview Page
The Overview page is your executive command center. At the top, 6 KPI cards give you a single-glance summary of how your event portfolio is performing: Total Events, Total Revenue, Total Attendees, Avg Satisfaction, Sponsorship, and Avg Budget. Below the KPI cards, 6 slicers let you instantly filter the entire dashboard by Event Type, Category, Region, Status, Marketing Channel, and Year.
- Revenue by Event Type — Shows which event formats (seminars, product launches, webinars, galas, workshops, networking, conferences, exhibitions) drive the highest revenue.
- Events by Category — A donut chart revealing the mix of Educational, Fundraising, Trade, Social, and Corporate events in your portfolio.
- Attendees by Category — Reveals which event categories draw the largest audiences for better capacity and venue planning.
- Revenue vs Expenses by Event Type — Compares income and cost side-by-side per event format, spotlighting profitable versus loss-making events.
- Satisfaction Score by Event Type — Benchmarks attendee satisfaction across event formats to identify what delights and what disappoints.Event Management Analysis Dashboard in HTML
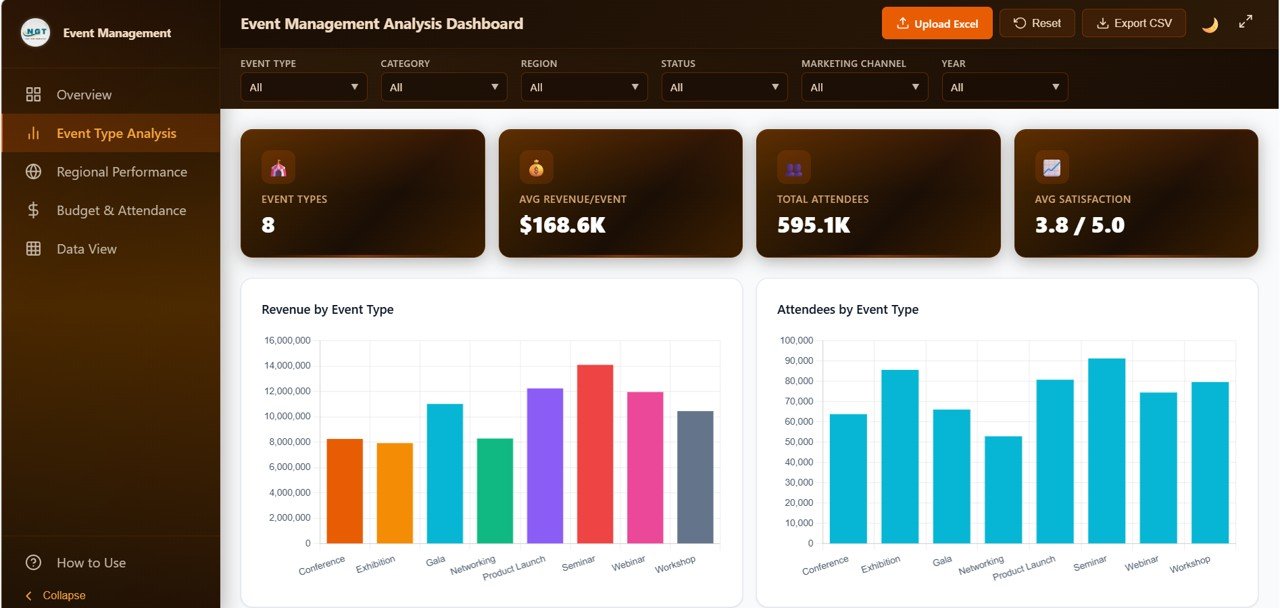
2. Event Type Analysis Page
The Event Type Analysis page drills deeper into performance by event format — seminars, webinars, conferences, workshops, galas, and more. This is where revenue leaders decide where to double down.
- Profit by Event Type — Highlights which event formats deliver the highest margins.
- Events by Event Type — Shows the distribution of events across every format you run.
- Sponsorship by Event Type — Identifies which formats attract the most sponsor dollars.
- Speaker Count by Event Type — Helps plan your speaker roster based on historical trends.
- Avg Ticket Price by Event Type — Optimizes pricing strategy using what attendees actually paid per format.
Event Type Analysis
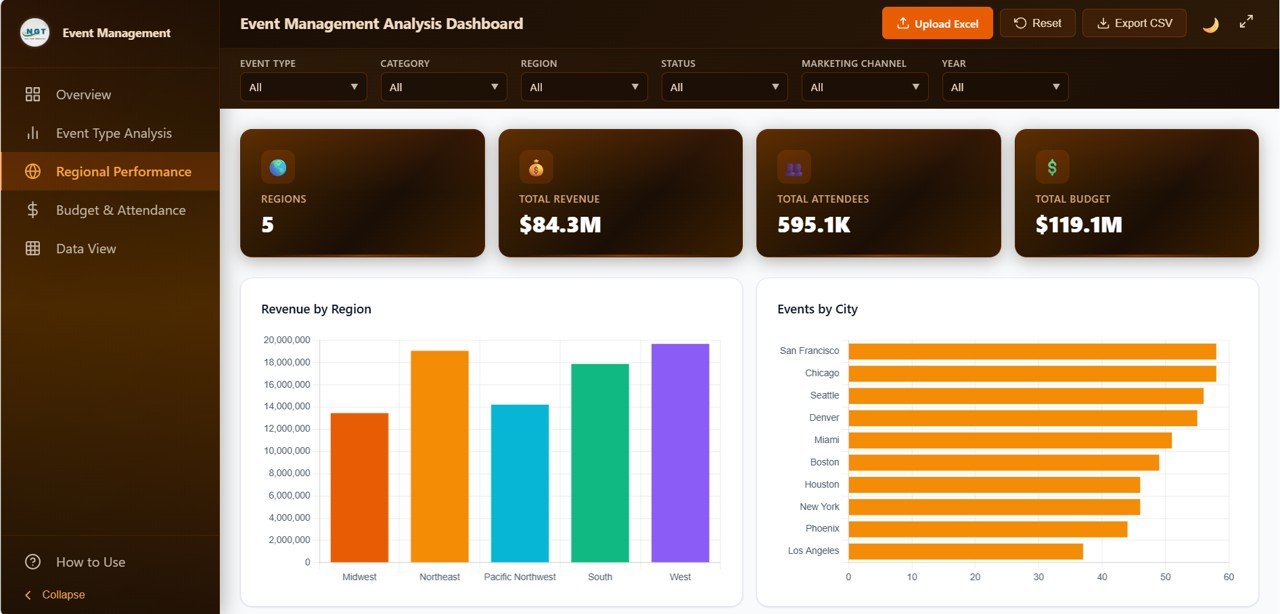
3. Regional Performance Page
This page focuses on location-based intelligence — critical for geographic expansion and venue partnership negotiations.Event Management Analysis Dashboard in HTML
- Revenue by Region — Ranks regions by revenue contribution.
- Events by Region — Maps event volume by geographic area.
- Attendees by City — Zooms into city-level attendance data for micro-market analysis.
- Revenue by Venue — Compares venue ROI to guide partnership decisions.
- Satisfaction by Region — Correlates location with attendee experience.
Regional Performance
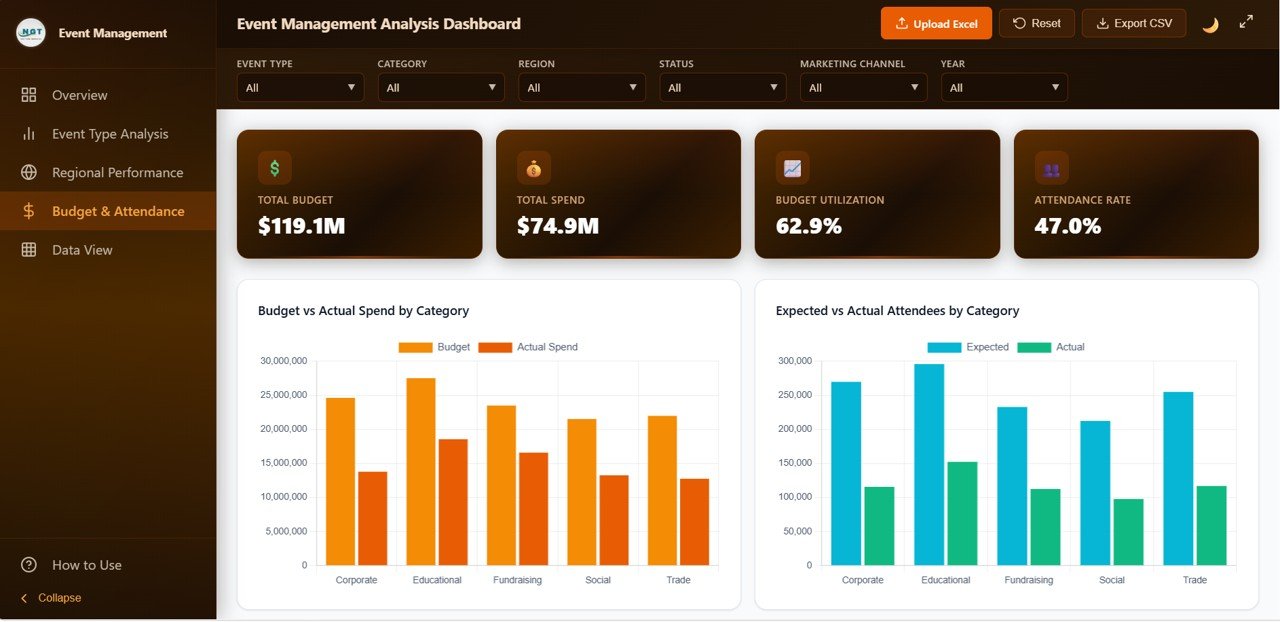
4. Budget & Attendance Page
The Budget & Attendance page combines financial health and audience turnout in one unified view — essential for post-event reviews and next-year planning.
- Budget Utilization by Event Type — Tracks planned budget vs actual spend across event formats.
- Attendance Rate by Event Type — Compares registered vs actual attendees to spot no-show trends.
- Avg Budget by Category — Benchmarks budgets across Educational, Fundraising, Trade, Social, and Corporate events.Event Management Analysis Dashboard in HTML
- Attendees by Event Status — Audience turnout across planned, confirmed, completed, and cancelled events.
- Budget vs Revenue — Profit pressure analysis by event format to protect margins.
Budget & Attendance
5. Data View Page
The Data View page is the power-user’s table view. Every event record is displayed with full interactivity.
- Real-time Search across every field in the dataset.
- Column Sorting ascending or descending on any column.
- Pagination for smooth navigation through thousands of rows.
- CSV Export for sharing filtered data with stakeholders or importing into other tools.
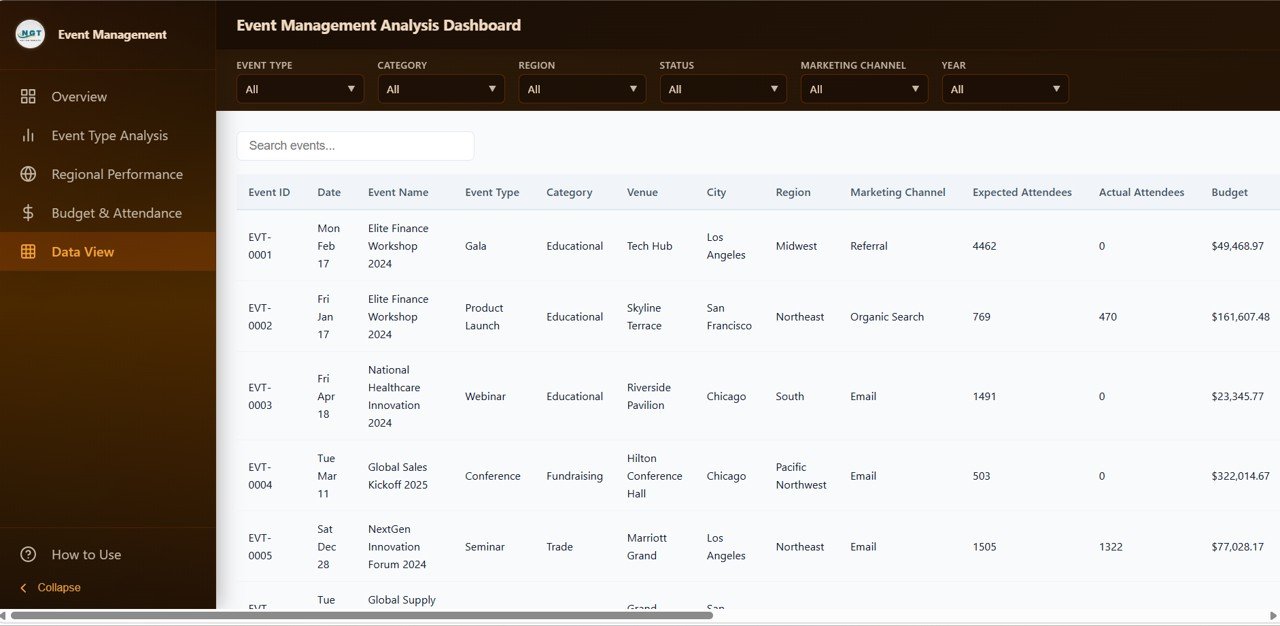
Data View tab
Advantages of the Event Management Analysis Dashboard in HTML
- No Software License Needed — Runs in any browser. Perfect for teams without Microsoft 365 or Power BI Pro licenses.
- Upload Excel In-Browser — Load your own dataset via the Upload Excel button — no file editing required.
- Cross-Device Compatibility — Works on Windows, macOS, Linux, and tablets.
- Shareable — Send the HTML file or host it on any web server for team-wide access.
- Lightweight — Fast load times, no backend, no database setup.
- Dark & Light Themes — Toggle themes for eye comfort in any environment.
- Professional Design — A clean, modern UI suitable for client-facing presentations.
Opportunities for Improvement
While the Event Management Analysis Dashboard in HTML is powerful out of the box, there are a few areas event teams may wish to extend:
- Multi-User Collaboration — The template is single-file based. Teams needing real-time collaboration should consider pairing it with a cloud hosting platform like GitHub Pages or Netlify.
- Automated Data Pipelines — For very large event datasets or real-time feeds, consider connecting the dashboard to an API or database backend.
- Advanced Forecasting — The dashboard focuses on historical and current-period analysis. For predictive planning (forecasts, scenario modeling), pair it with an Excel or Power BI version.
- Mobile-First Responsiveness — While the dashboard is responsive, power users on very small screens may prefer a dedicated mobile-optimized version.
Best Practices
- Clean Your Data First — Standardize event type names, categories, and regions before importing. Consistent naming avoids scattered chart labels.
- Use Descriptive Event IDs — Include year, type, and location in event IDs for easier filtering later.
- Update Monthly — Refresh the data file at month-end so KPI trends stay current.
- Back Up the File — Keep a versioned copy before making structural changes.
- Brand It — Swap placeholder logos and colors to match your company’s visual identity.
- Combine with Calendar — Pair this dashboard with an event calendar for full-cycle planning and reporting.
For more tips on building effective web-based dashboards, review Mozilla’s HTML documentation on MDN and JavaScript reference guides — great resources if you want to extend this template further.
Explore Relevant Templates
If you’re shopping for more dashboard templates to complement your event analytics workflow, here are some popular picks from NextGenTemplates:
- Event Management Analysis Dashboard in Excel — The Excel version of this same dashboard, with pivot tables and native formulas.
- Wedding Budget Dashboard in HTML — Perfect for wedding planners managing vendor costs and guest logistics.
- Nonprofit Fundraising Dashboard in HTML — A fundraising analytics template for charity events and donor campaigns.
- Church Finance Dashboard in HTML — Tracks tithes, offerings, and faith-based event finances.
- Browse all HTML Dashboard Templates — Explore our full library of browser-based analytics templates.
Frequently Asked Questions
What is the Event Management Analysis Dashboard in HTML used for?
The Event Management Analysis Dashboard in HTML is used to analyze event performance across revenue, attendees, sponsorship, budget, and satisfaction. It delivers 6 executive KPIs and 20+ charts across 5 pages — Overview, Event Type Analysis, Regional Performance, Budget & Attendance, and Data View — giving event planners a complete analytics view without Excel or Power BI.
How do I open the HTML dashboard template after purchase?
After downloading, unzip the file and double-click index.html. The dashboard opens in your default browser — no software installation, no admin rights, no server setup required.
Can I upload my own Excel data into the dashboard?
Yes. The dashboard includes an Upload Excel button in the top toolbar. Click it to load your own event data instantly, or press Reset to restore the sample dataset. Every KPI card and chart updates automatically when new data is loaded.
Which browsers does this HTML dashboard support?
The Event Management Analysis Dashboard in HTML works on all modern browsers including Google Chrome, Microsoft Edge, Mozilla Firefox, and Apple Safari — on Windows, macOS, Linux, and tablets.
Is this template suitable for small event teams or large agencies?
Both. Small teams benefit from the zero-setup simplicity, while large agencies appreciate the ability to handle thousands of event records with built-in search, sort, pagination, and CSV export.
Can I host this dashboard online for my team to access?
Yes. Simply upload the HTML folder to any web server, GitHub Pages, Netlify, or your company’s intranet. Your team can then access the dashboard from any browser via the hosted URL.
Conclusion
The Event Management Analysis Dashboard in HTML combines the clarity of a modern BI tool with the simplicity of a static web file. With 5 pages — Overview, Event Type Analysis, Regional Performance, Budget & Attendance, and Data View — plus 6 KPIs and 20+ interactive charts, it gives you a complete 360° view of your event portfolio in one elegant, browser-based file.
If you’re ready to stop juggling spreadsheets and start making data-driven event decisions, this template is the fastest path to professional analytics. It pairs perfectly with the Event Management Analysis Dashboard in Excel for teams that prefer spreadsheet-native workflows.
👉 Click here to Purchase the Event Management Analysis Dashboard in HTML
For step-by-step video tutorials on Google Sheets, HTML dashboards, and general tech how-tos, visit our YouTube channel → YouTube.com/@NeoTechNavigators