Walk through the Event Success Tracking Dashboard in Google Sheets: 6 tabs, 4 KPI cards, 16 charts, slicers, Search sheet, and Data sheet for event revenue, profit, venue, client, and ticket tracking.
Tag: event analysis
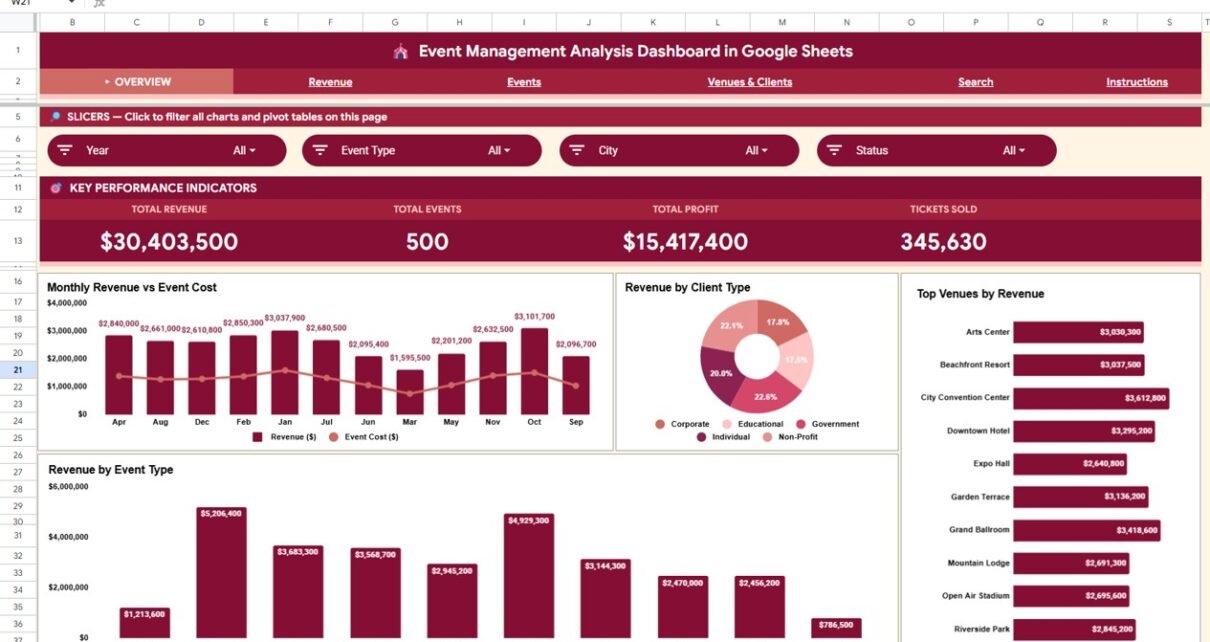
Event Management Analysis Dashboard in Google Sheets
Track event revenue, profit, tickets sold, and venue performance using the Event Management Analysis Dashboard in Google Sheets — 6 pages, 4 KPI cards, 14 charts, and interactive slicers. One-time download, no subscription.
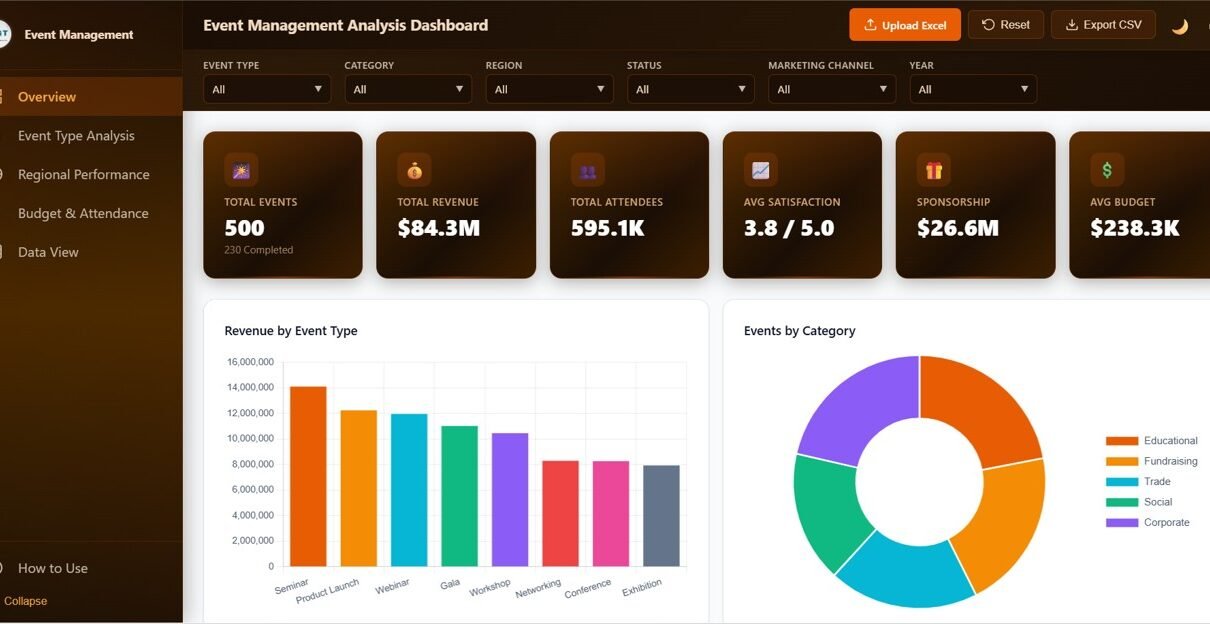
Event Management Analysis Dashboard in HTML
The Event Management Analysis Dashboard in HTML is a browser-based analytics template with 5 interactive pages — Overview, Event Type Analysis, Regional Performance, Budget & Attendance, and Data View — plus 6 KPIs and 20+ charts covering revenue, attendees, sponsorship, budget, and satisfaction. Works in any modern browser — no Excel or Power BI needed.
Office Event Feedback Tracker in Google Sheets
Hosting office events is a great way to engage employees, foster collaboration, and promote a positive workplace culture. But how do you measure the effectiveness of these events? Simple — you use the Office Event Feedback Tracker in Google Sheets. This ready-to-use template allows you to collect feedback, analyze responses, and gain insights into how […]