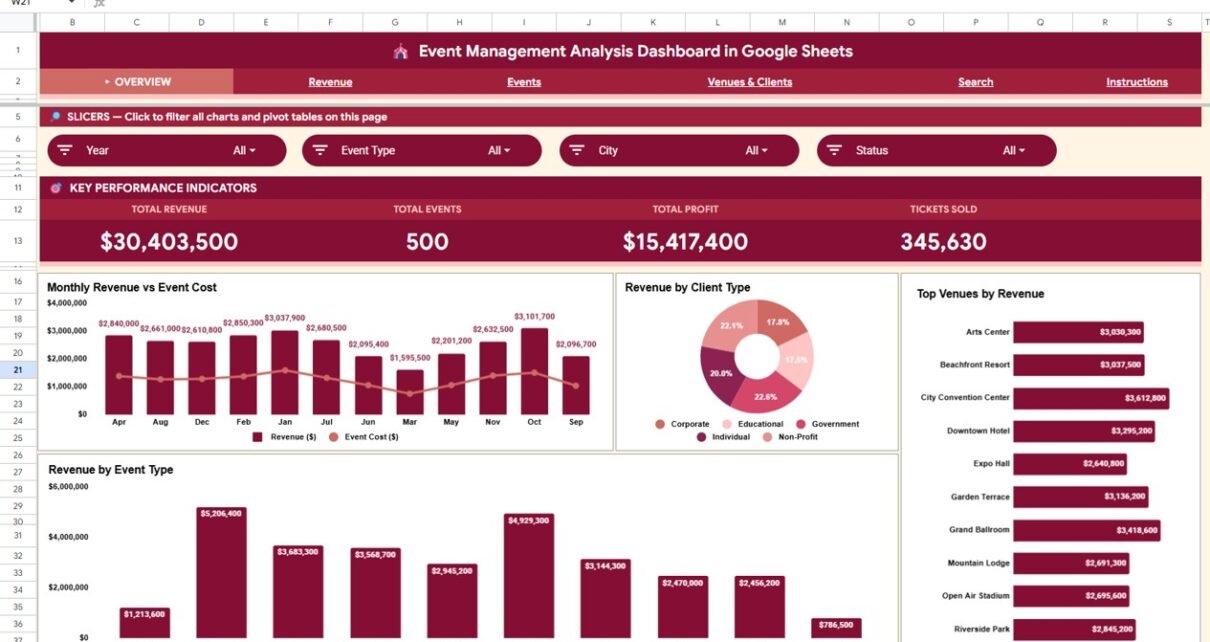
Track event revenue, profit, tickets sold, and venue performance using the Event Management Analysis Dashboard in Google Sheets — 6 pages, 4 KPI cards, 14 charts, and interactive slicers. One-time download, no subscription.
Online Tutorial for Data Analysis and Automation
Track event revenue, profit, tickets sold, and venue performance using the Event Management Analysis Dashboard in Google Sheets — 6 pages, 4 KPI cards, 14 charts, and interactive slicers. One-time download, no subscription.
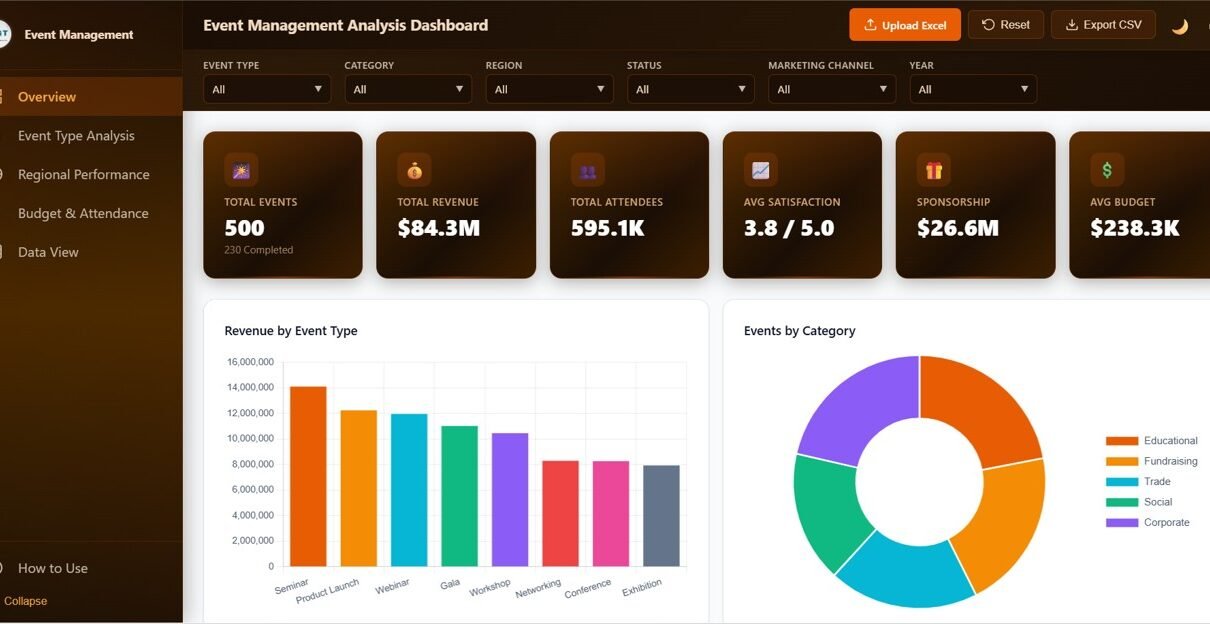
The Event Management Analysis Dashboard in HTML is a browser-based analytics template with 5 interactive pages — Overview, Event Type Analysis, Regional Performance, Budget & Attendance, and Data View — plus 6 KPIs and 20+ charts covering revenue, attendees, sponsorship, budget, and satisfaction. Works in any modern browser — no Excel or Power BI needed.
Event management has evolved significantly in recent years. Today, organizers must track performance, monitor budgets, evaluate attendee satisfaction, and measure event success using data-driven insights. However, many event teams still rely on manual spreadsheets and scattered reports. As a result, they struggle to evaluate performance accurately and make timely improvements. Therefore, organizations increasingly adopt structured […]