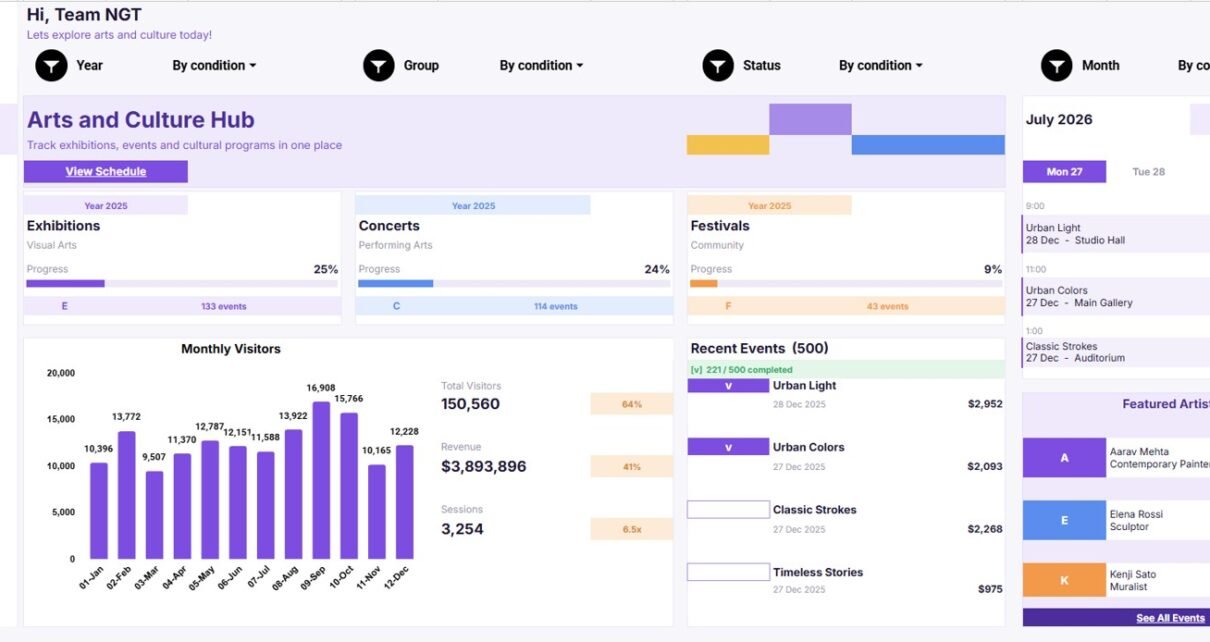
Explore how the Arts and Culture Dashboard in Google Sheets tracks exhibitions, concerts, festivals, visitors, artists, venues, programs, revenue, costs, and source data in one editable template.
Online Tutorial for Data Analysis and Automation
Explore how the Arts and Culture Dashboard in Google Sheets tracks exhibitions, concerts, festivals, visitors, artists, venues, programs, revenue, costs, and source data in one editable template.
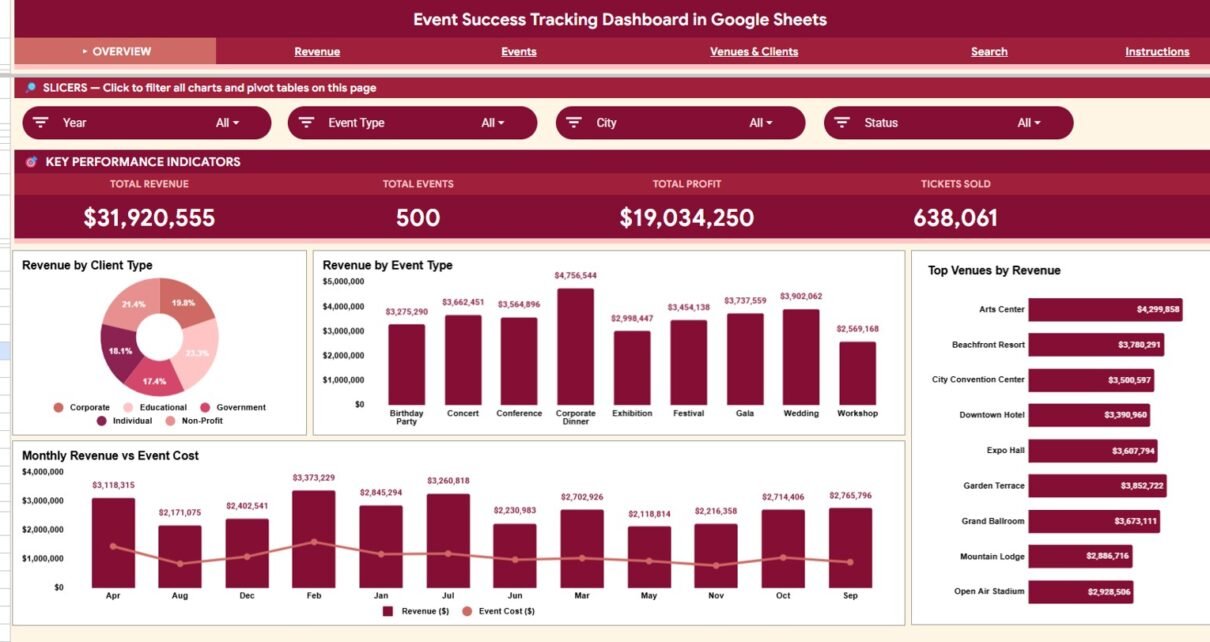
Walk through the Event Success Tracking Dashboard in Google Sheets: 6 tabs, 4 KPI cards, 16 charts, slicers, Search sheet, and Data sheet for event revenue, profit, venue, client, and ticket tracking.
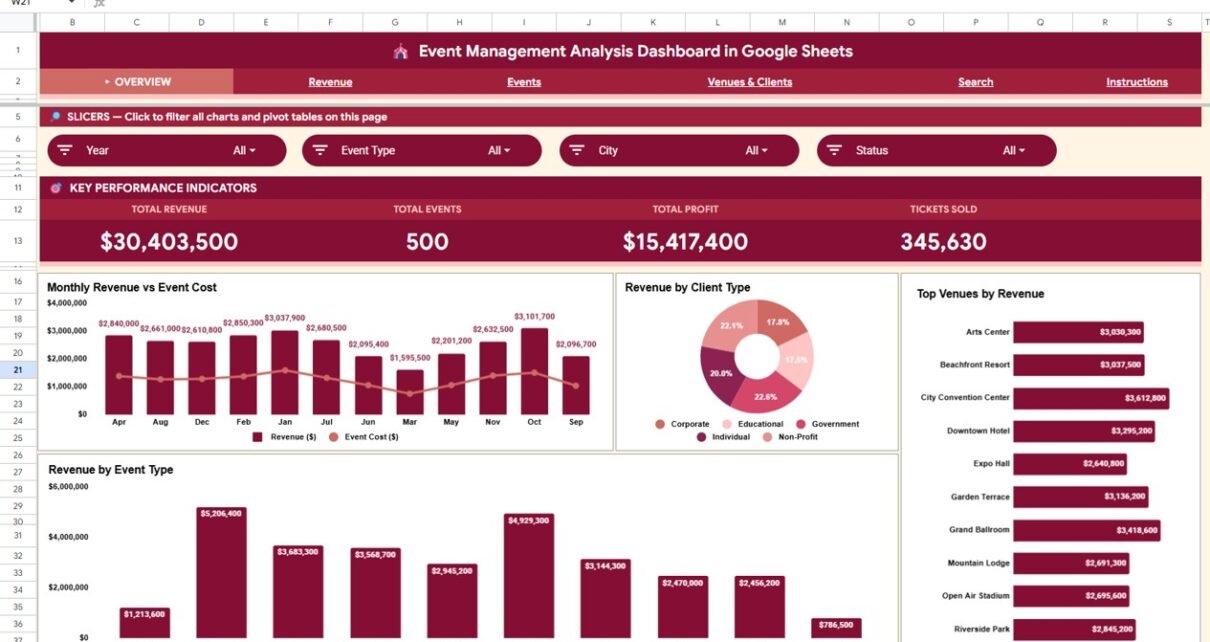
Track event revenue, profit, tickets sold, and venue performance using the Event Management Analysis Dashboard in Google Sheets — 6 pages, 4 KPI cards, 14 charts, and interactive slicers. One-time download, no subscription.
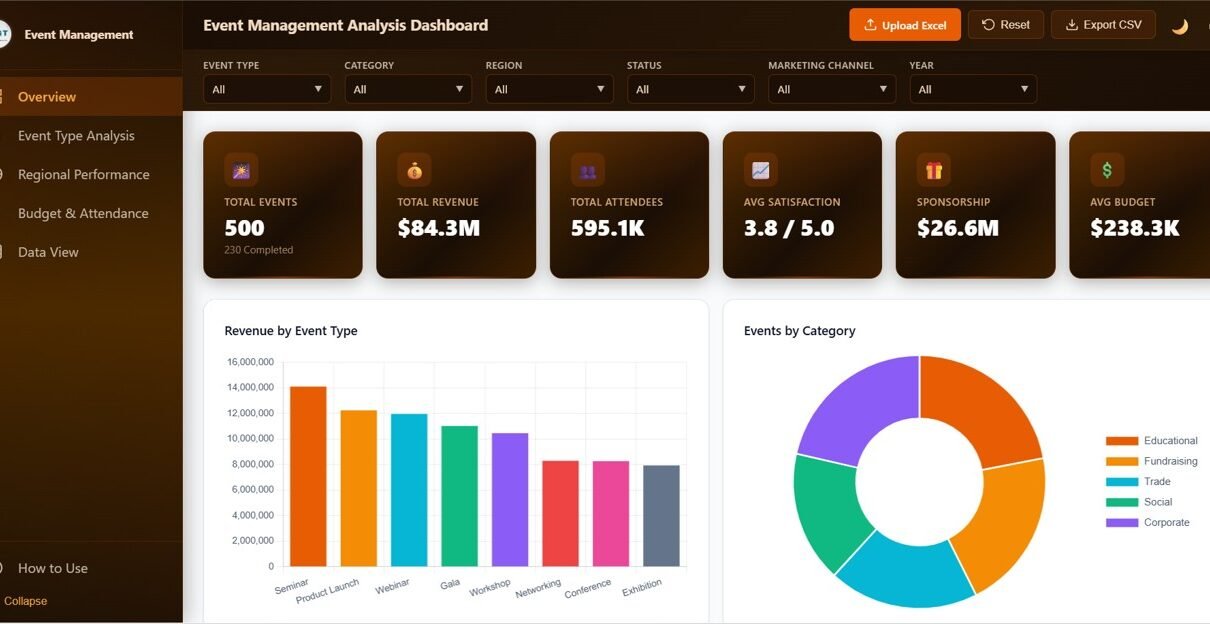
The Event Management Analysis Dashboard in HTML is a browser-based analytics template with 5 interactive pages — Overview, Event Type Analysis, Regional Performance, Budget & Attendance, and Data View — plus 6 KPIs and 20+ charts covering revenue, attendees, sponsorship, budget, and satisfaction. Works in any modern browser — no Excel or Power BI needed.
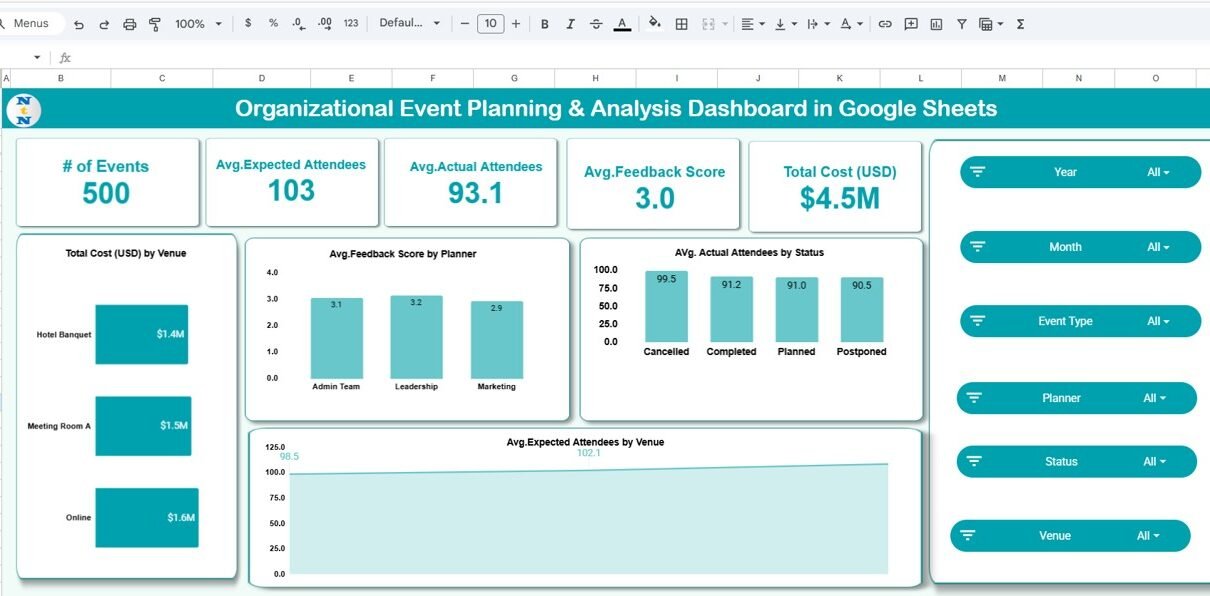
Managing organizational events efficiently requires proper planning, tracking, and post-event analysis. The Organizational Event Planning & Analysis Dashboard in Google Sheets provides a ready-to-use solution for planners, coordinators, and event managers to monitor all aspects of their events — from attendee numbers to costs and feedback — in one centralized dashboard.Organizational Event Planning & Analysis […]