Salon and Spa Dashboard in Google Sheets is a professionally designed, ready-to-use interactive dashboard template built for salon owners, spa managers, beauty professionals, and wellness business operators who want to track revenue, monitor staff performance, analyze service trends, and measure client satisfaction — all inside Google Sheets. This template includes 4 interactive analysis pages covering Overview, Services, Staff, and Revenue, plus a Search Page for instant record lookup and a structured Data Sheet for easy data entry. Whether you manage a boutique day spa, a multi-branch hair salon, or a full-service wellness center, this Google Sheets Dashboard Template transforms your raw appointment data into beautiful, actionable visual insights that help you maximize profitability and deliver exceptional client experiences.
Running a salon or spa without data-driven insights means missed revenue opportunities, underperforming staff going unnoticed, and client satisfaction issues slipping through the cracks. This dashboard solves that by consolidating all your key salon metrics into one clean, interactive, and insight-driven experience. The Salon and Spa Dashboard in Google Sheets tracks 5 key performance indicators including Total Revenue, Total Profit, Total Appointments, Avg. Rating, and Completion Rate across multiple service categories, staff members, branches, client types, and payment methods. Simply make a copy of the Google Sheet, replace the sample data with your own records, and every chart and KPI updates automatically. If you prefer working in other platforms, explore the Salon and Spa Dashboard in Excel or the Salon and Spa Dashboard in Power BI.
Key Features of Salon and Spa Dashboard in Google Sheets
Click here to Purchase the Salon and Spa Dashboard in Google Sheets
The Salon and Spa Dashboard in Google Sheets is packed with features that make salon and spa analytics effortless. Here are the key highlights that set this template apart from generic spreadsheet solutions:
- 4 Interactive Analysis Pages + Search + Data Sheet — Overview, Services, Staff, and Revenue pages deliver complete visibility into your salon and spa business operations with dynamic charts, KPI cards, and interactive slicers for instant filtering.
- 5 Real-Time KPI Cards — Monitor Total Revenue, Total Profit, Total Appointments, Avg. Rating, and Completion Rate at a glance from the Overview page for instant business health checks.
- Service Category Analysis — Understand which treatments drive the most revenue with Revenue by Client Type, Revenue by Payment Method, Average Rating by Category, and Revenue by Service Category charts.
- Staff Performance Tracking — Evaluate individual therapist and stylist contributions with Revenue by Staff Member, Average Rating by Staff, and Staff Revenue and Appointments analysis.
- Revenue Deep Dive — Analyze financial performance with Monthly Revenue, Cost and Profit Trend, Monthly Revenue Trend, Monthly Profit Distribution, and Branch Revenue and Profit Comparison charts.
- Smart Search Feature — Select any Record ID and instantly view all 14 appointment details including date, client name, service, staff member, amount, cost, profit, and rating.
- No Advanced Skills Required — Built entirely with Google Sheets formulas and native charts. No coding, no macros, no add-ons needed.
Dashboard Pages Explained
Click here to Purchase the Salon and Spa Dashboard in Google Sheets
1. Overview Page
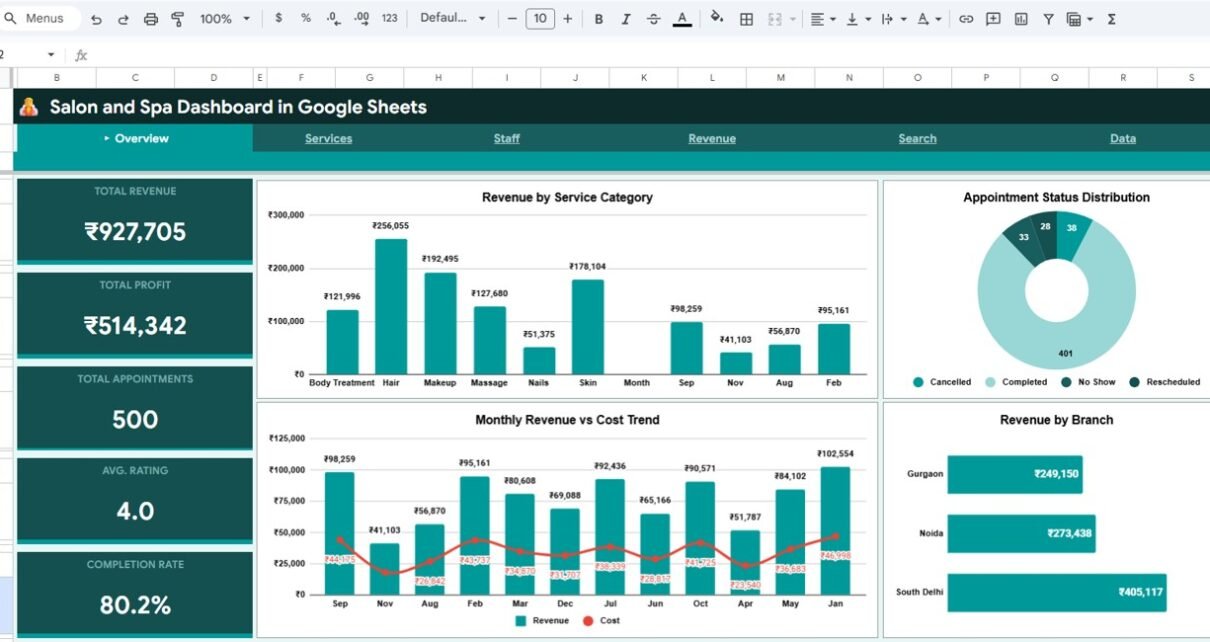
The Overview page serves as the command center for your salon and spa business. At the top, you will find 5 high-level KPI cards showing Total Revenue, Total Profit, Total Appointments, Avg. Rating, and Completion Rate. These cards give you an immediate pulse check on your business health without needing to navigate further.
Below the KPI cards, the page features several interactive charts. The Revenue by Service Category chart helps you understand which treatment types generate the most income. The Monthly Revenue vs Cost Trend chart visualizes your financial trajectory over time. The Appointment Status Distribution chart shows how your appointments break down between completed, cancelled, and no-show categories. The Revenue by Branch chart enables multi-location operators to compare performance across different salon branches. Multiple slicers allow you to filter all charts simultaneously for focused analysis.
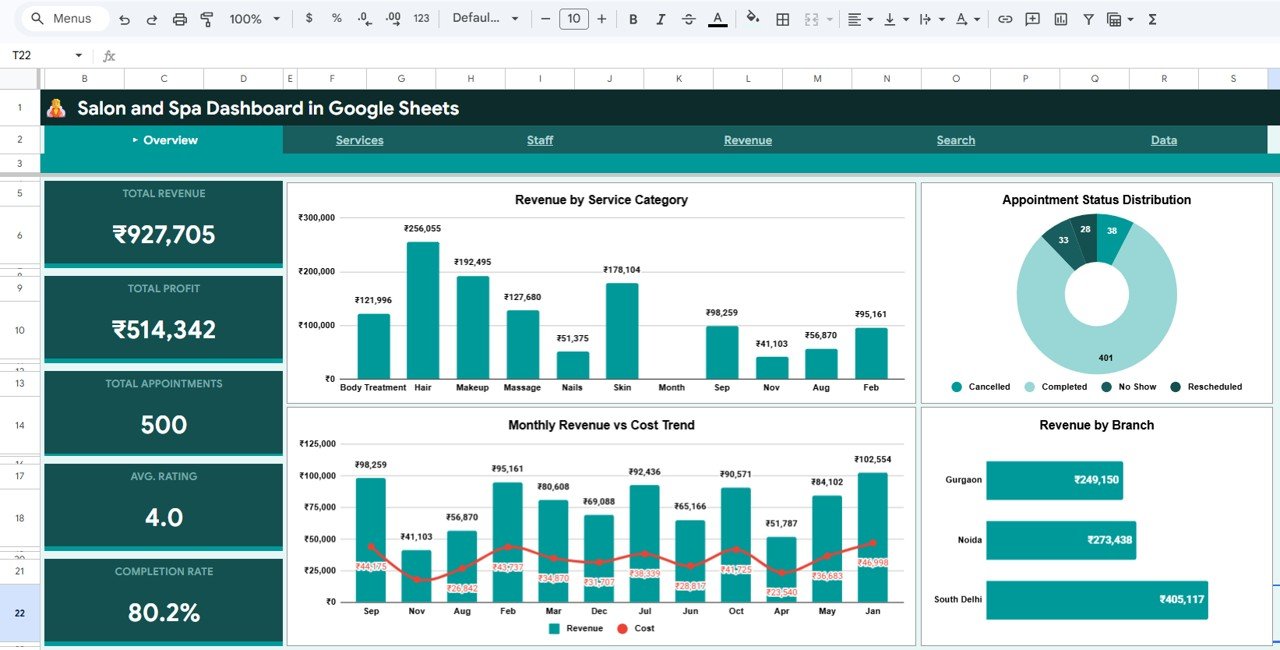
Salon and Spa Dashboard in Google Sheets
2. Services Page
The Services page dives deep into your salon’s treatment offerings. This page helps you understand which services drive the most revenue and which client segments are most valuable. The Revenue by Client Type chart segments your income by customer categories. The Revenue by Payment Method chart reveals which payment options your clients prefer. The Average Rating by Category chart shows client satisfaction levels across different treatment types. The Revenue by Service Category chart provides a detailed breakdown of income across all your service offerings, helping you optimize your service menu and pricing strategy.
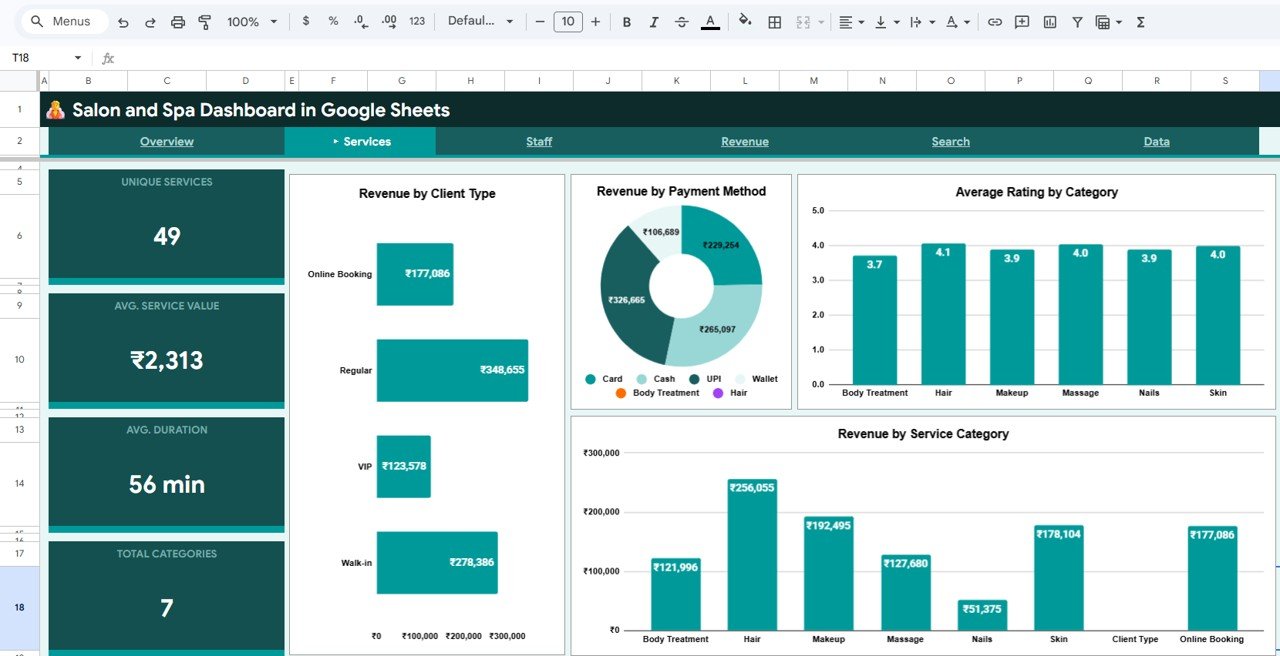
Services Page
3. Staff Page
The Staff page is designed to evaluate your team’s performance and identify both top performers and coaching opportunities. The Revenue by Staff Member chart ranks your therapists and stylists by the revenue they generate. The Average Rating by Staff chart shows which team members receive the highest client satisfaction scores. The Staff Revenue and Appointments analysis combines both metrics to give you a complete picture of each staff member’s productivity and client appeal. This page is essential for performance reviews, incentive distribution, and strategic scheduling decisions.
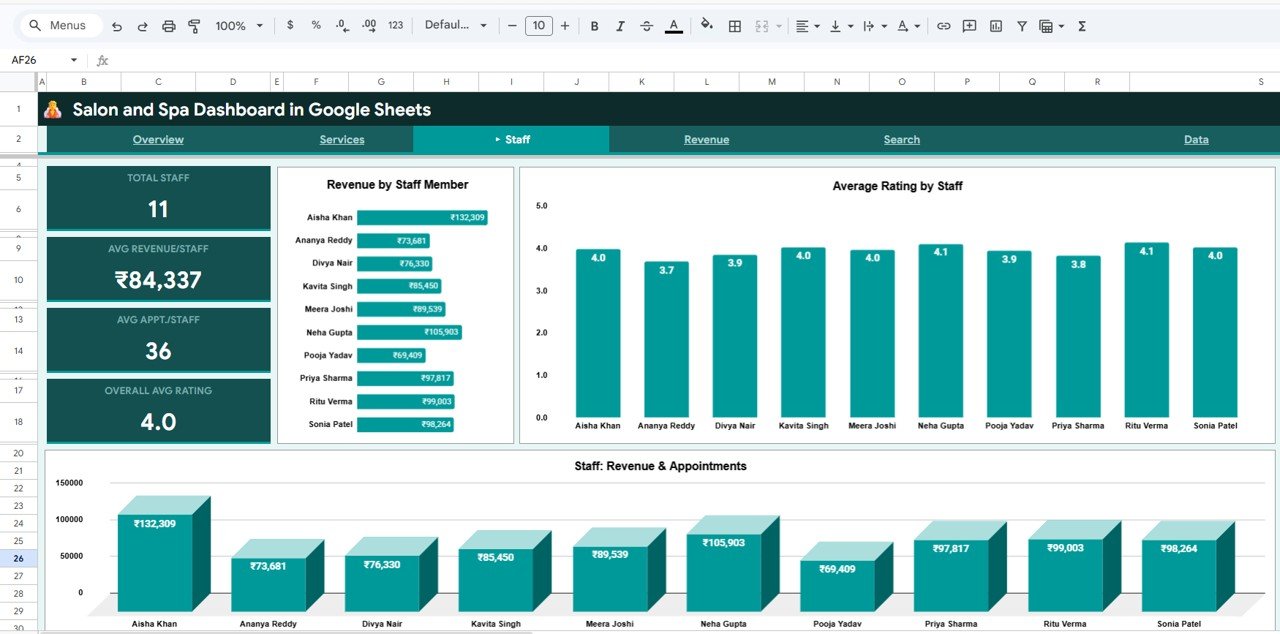
Staff Page
4. Revenue Page
The Revenue page provides a comprehensive financial analysis of your salon or spa business. The Monthly Revenue, Cost and Profit Trend chart shows your financial trajectory over time, helping you spot seasonal patterns and growth trends. The Monthly Revenue Trend chart isolates income patterns for clearer trend analysis. The Monthly Profit Distribution chart reveals which months deliver the strongest bottom-line results. The Branch Revenue and Profit Comparison chart is particularly valuable for multi-location salon operators, enabling side-by-side performance comparison across all branches to identify which locations are thriving and which need attention.
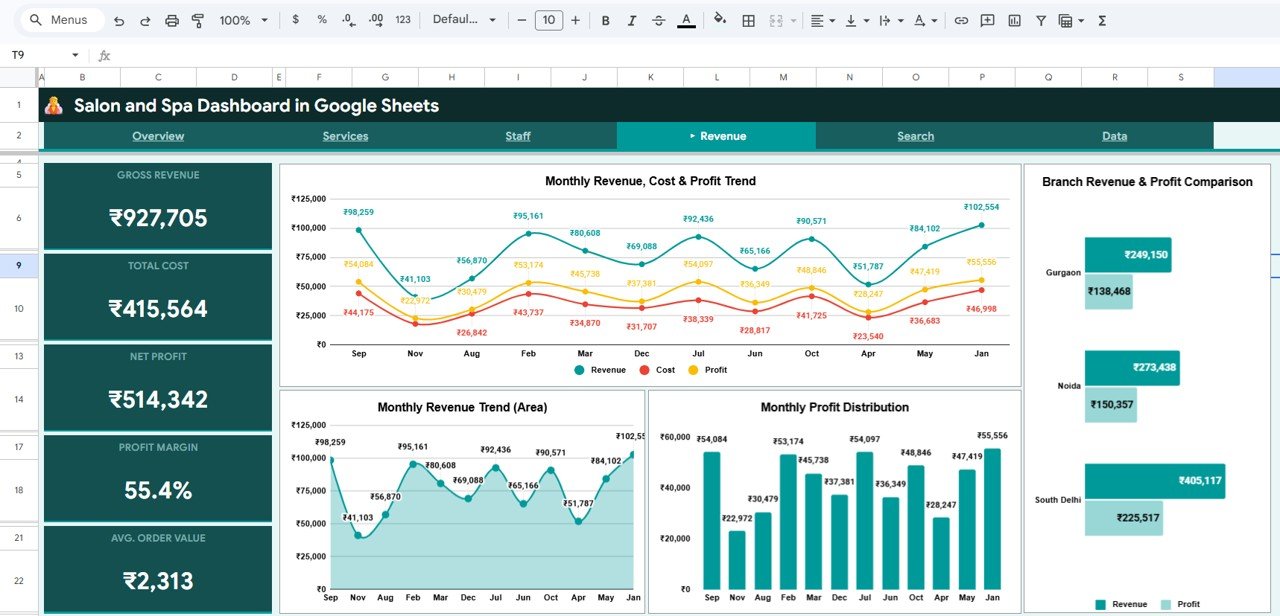
Revenue Page
5. Search Page
The Search page is a powerful record lookup feature that allows you to search any appointment by selecting the Record ID from a dropdown. It instantly displays all the details of that appointment including date, client name, service category, service, staff member, duration, amount, cost, profit, payment method, client type, rating, status, and branch. This feature is invaluable for quickly resolving client inquiries, verifying appointment details, and auditing individual transactions without scrolling through hundreds of data rows.
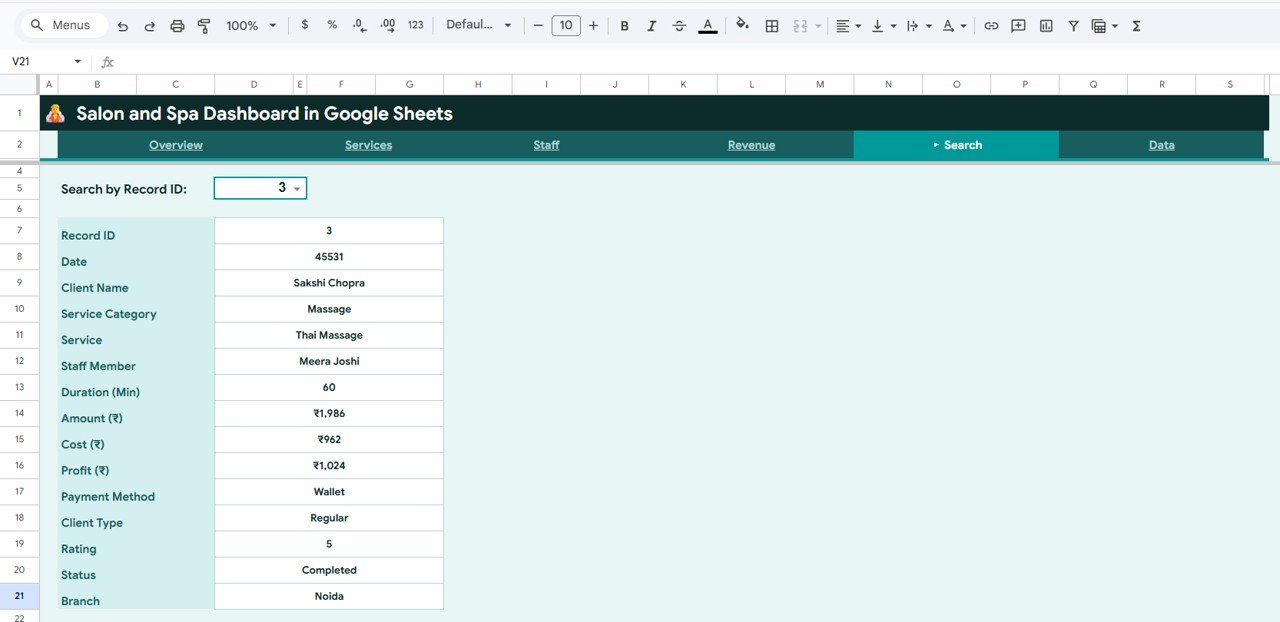
Search Sheet Tab
6. Data Sheet
The Data Sheet is where you enter your salon appointment records. It comes pre-loaded with realistic sample data so you can see the dashboard in action immediately. Simply replace the sample records with your own salon data in the same column format and all 4 analysis pages, KPI cards, and charts update automatically. The columns are pre-formatted and clearly labeled for easy data entry.
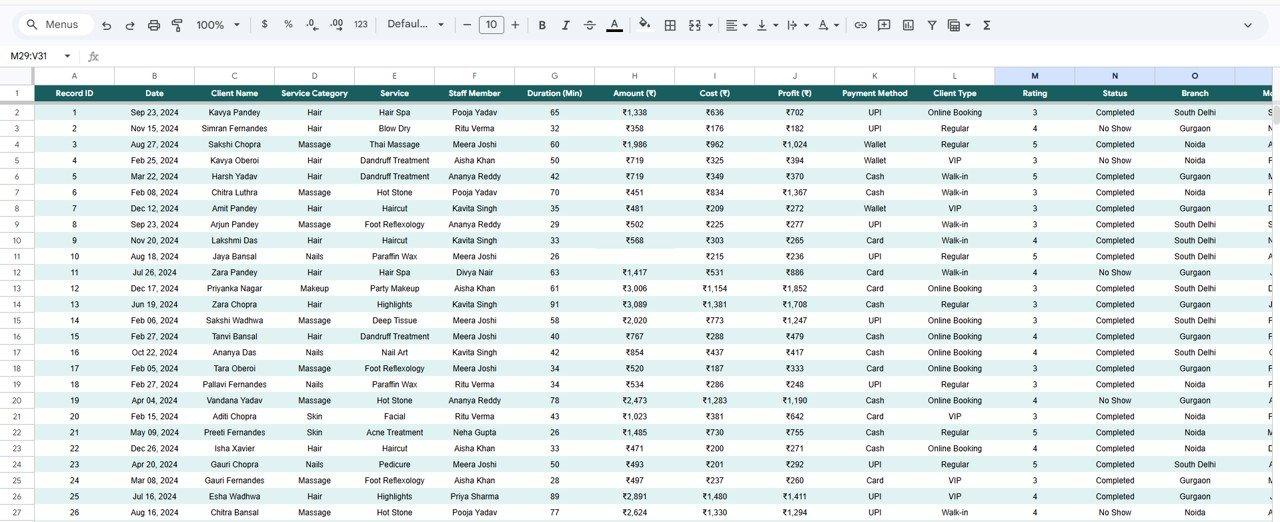
Data Sheet Tab
Advantages of Salon and Spa Dashboard in Google Sheets
This dashboard offers several compelling advantages for salon and spa businesses. First, it provides complete business visibility by consolidating revenue, service, staff, and branch data into one centralized location. Second, the cloud-based nature of Google Sheets means you can access your salon analytics from any device — desktop, tablet, or mobile — and collaborate with your team in real time. Third, the interactive slicers allow instant filtering so you can analyze specific time periods, service categories, or branches without modifying any formulas. Fourth, the template requires absolutely no coding or advanced spreadsheet skills, making it accessible to salon owners who may not have a technical background. Finally, the multi-branch comparison capability is a game-changer for salon chains that need to monitor and compare location-level performance.
Opportunities for Improvement
While the dashboard provides excellent analytics coverage, there are some areas where users might extend its capabilities. Adding a customer retention tracking page would help salons monitor repeat visit rates and client lifetime value. Integrating appointment scheduling data directly from booking platforms like Fresha or Booksy would eliminate manual data entry. A product inventory tracking module would benefit salons that sell retail products alongside services. Additionally, predictive analytics for seasonal demand forecasting could help salon managers plan staffing levels more effectively.
Best Practices for Using This Dashboard
Click here to Purchase the Salon and Spa Dashboard in Google Sheets
To get the most value from the Salon and Spa Dashboard in Google Sheets, follow these best practices. Update your data weekly or bi-weekly to keep insights current and actionable. Use the slicers on the Overview page to analyze performance by specific time periods during seasonal peaks like holidays and wedding season. Review the Staff page monthly during team meetings to recognize top performers and set improvement goals. Compare branch performance quarterly using the Revenue page to identify underperforming locations. Use the Search page to quickly resolve any client queries about past appointments. Finally, share the dashboard with your management team using Google Sheets sharing permissions for collaborative decision-making.
Explore Relevant Templates
If you found the Salon and Spa Dashboard in Google Sheets useful, you may also be interested in these related templates:
- Salon and Spa Dashboard in Excel — The Excel version with pivot-powered charts and interactive slicers for offline analysis.
- Salon and Spa Dashboard in Power BI — Advanced interactive Power BI version with drill-through capabilities.
- Luxury Spa KPI Dashboard in Google Sheets — MTD and YTD KPI tracking with target vs actual comparison for luxury spa businesses.
- Veterinary Clinic Dashboard in Google Sheets — Similar service-industry analytics for veterinary clinics and animal hospitals.
Browse the complete collection of Google Sheets Dashboard Templates on NextGenTemplates for more industry-specific analytics solutions. For Google Sheets charting tutorials, visit the official Google documentation.
Frequently Asked Questions
What KPIs does the Salon and Spa Dashboard in Google Sheets track?
The Salon and Spa Dashboard in Google Sheets tracks 5 key performance indicators: Total Revenue, Total Profit, Total Appointments, Avg. Rating, and Completion Rate. It also provides detailed analysis across 4 interactive pages covering service category performance, staff productivity, revenue trends, and branch-level comparisons with over 15 dynamic charts.
Do I need advanced Google Sheets skills to use this salon dashboard?
No. Simply replace the sample data in the Data Sheet with your own salon records and all charts, KPIs, and analysis pages update automatically. No formulas to write, no coding required. The template is designed to be completely plug-and-play.
Can I track multiple salon branches with this dashboard?
Yes. The Overview page includes a Revenue by Branch chart and the Revenue page features a Branch Revenue and Profit Comparison chart. Use slicers to filter by specific branches or view combined performance across all locations.
What is the best Google Sheets dashboard for salon and spa businesses?
The Salon and Spa Dashboard in Google Sheets from NextGenTemplates is one of the best options available. It includes 4 interactive analysis pages, a record search feature, a structured data sheet, 5 KPI cards, and over 15 dynamic charts covering services, staff, revenue, and branch performance — all in a cloud-based, collaborative Google Sheets format.
Can I use this dashboard for a hair salon, nail salon, or wellness center?
Absolutely. The dashboard is designed for any beauty or wellness business — hair salons, nail studios, day spas, massage centers, barbershops, and full-service wellness facilities. Simply customize the service categories in the Data Sheet to match your business offerings.
Is this dashboard available in Excel or Power BI?
Yes. NextGenTemplates offers the Salon and Spa Dashboard in Excel for offline pivot-powered analytics and the Salon and Spa Dashboard in Power BI for advanced interactive reporting with drill-through capabilities.
Conclusion
The Salon and Spa Dashboard in Google Sheets is a must-have analytics tool for any beauty or wellness business looking to make data-driven decisions. With 4 comprehensive analysis pages tracking everything from service revenue and staff performance to client satisfaction and branch comparisons, this template eliminates the guesswork from salon management. The cloud-based Google Sheets format means you can access your analytics from anywhere, collaborate with your team in real time, and never worry about software installation or compatibility issues. Download it today, paste your data, and start uncovering insights that drive growth for your salon or spa business.
Click here to Purchase the Salon and Spa Dashboard in Google Sheets
Visit our YouTube channel for step-by-step Google Sheets tutorials: Youtube.com/@NeoTechNavigators