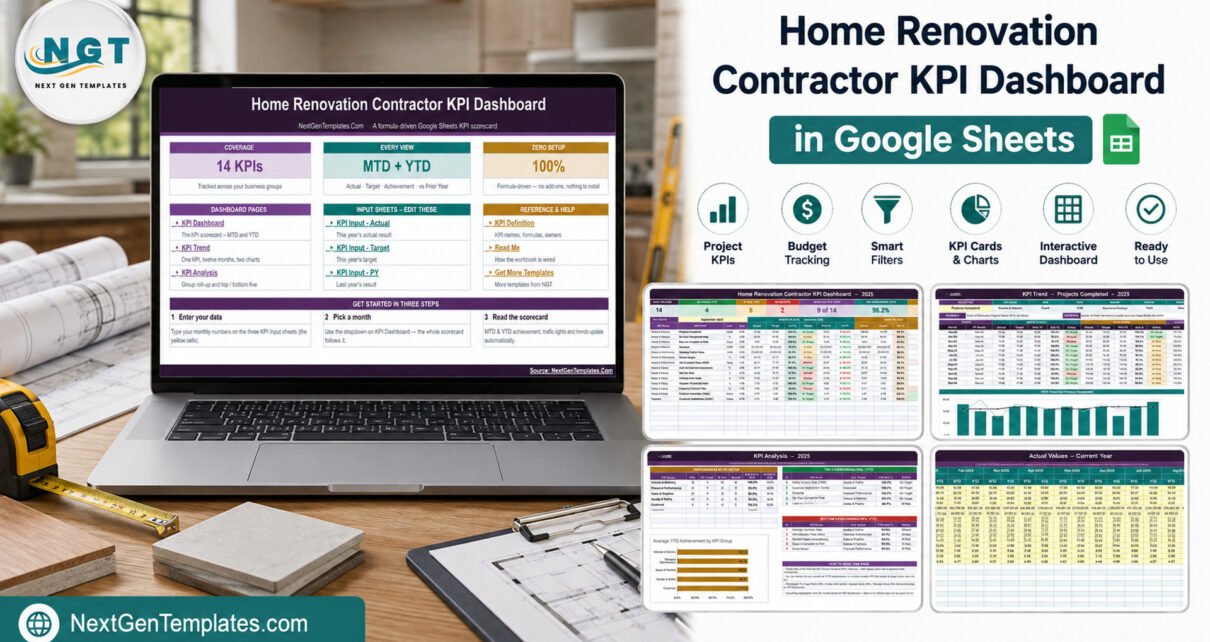
The Home Renovation Contractor KPI Dashboard in Google Sheets tracks 14 KPIs across 5 business groups on 10 linked sheets, and reports every one of them month-to-date and year-to-date at the same time. Each KPI shows Actual, Target, Achievement %, a traffic-light Status, Prior Year and a vs-PY arrow — twice, once for the month you pick and once for the year so far. Twelve months of numbers are already wired in, the thresholds are On Target from 100%, At Risk 95–99% and Missed below 95%, and the whole file is formula-driven with nothing to install.Home Renovation Contractor KPI Dashboard in Google Sheets
Most renovation and remodeling firms already know their revenue. What they usually cannot answer in one place is whether on-time completion is slipping, whether change orders are eating the contract value, how long invoices are taking to collect, and whether the bid win rate is heading the right way. This template puts those answers on one page. It is a reporting layer over numbers you type in — it does not run your jobs, and it makes no claim about compliance, permits or estimating accuracy.Home Renovation Contractor KPI Dashboard in Google Sheets
Get the Home Renovation Contractor KPI Dashboard in Google Sheets
Important: what this template is and is not
Before anything else, in plain language. This is a Google Sheets reporting template over data the buyer types in. It does not:
- establish compliance with building codes, permitting, licensing, lien or home-improvement-contract law in any jurisdiction;
- constitute a structural, electrical, plumbing or safety assessment, an inspection record, or a warranty;Home Renovation Contractor KPI Dashboard in Google Sheets
- produce estimates, bids or contracts that are binding, accurate or fit to hand a customer;
- replace a licensed contractor’s statutory dutiesHome Renovation Contractor KPI Dashboard in Google Sheets
Every margin, cycle-time, change-order, punch-list and satisfaction figure you see in the screenshots below is buyer-entered demo data, invented to show the layout. None of it describes a real company.Home Renovation Contractor KPI Dashboard in Google Sheets
Key Features of This Renovation KPI Dashboard
- 14 KPIs in 5 groups. Volume & Delivery: Projects Completed, On-Time Completion Rate, Days to Complete vs Plan. Financial Performance: Revenue, Average Project Value, Gross Margin, AR Collection Days (DSO). Sales & Pipeline: Lead-to-Contract Conversion, Bid Win Rate. Quality & Safety: Change-Order Rate, Rework / Punch-List Rate, Warranty Callback Rate, Safety Incident Rate (TRIR). Customer: Customer Satisfaction (CSAT).
- One month dropdown drives everything. Pick a month on the KPI Dashboard sheet and the scorecard, the trend page and the analysis roll-up all re-base to it. There is no refresh step and no query to run.Home Renovation Contractor KPI Dashboard in Google Sheets
- Upper-the-better and lower-the-better are handled separately. Achievement is Actual ÷ Target for UTB metrics and Target ÷ Actual for LTB metrics, so beating a callback, rework or cycle-time target scores above 100% instead of reading like a miss.
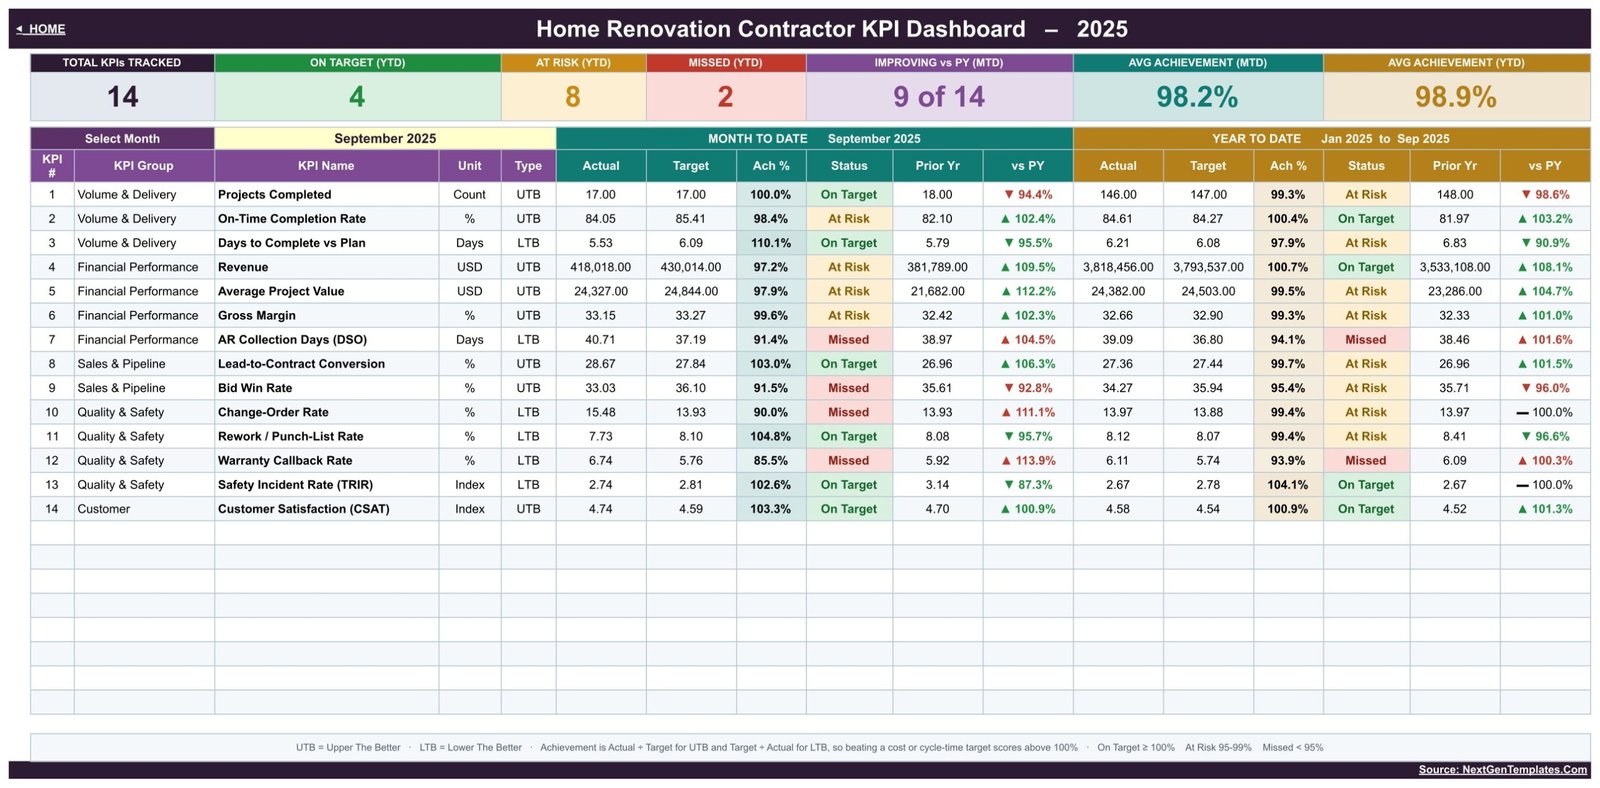
- Seven header tiles. Total KPIs Tracked, On Target (YTD), At Risk (YTD), Missed (YTD), Improving vs PY (MTD), and average achievement for MTD and for YTD.
- The KPI list is the master. Add, rename or delete a KPI — or invent a new KPI Group — on the KPI Definition sheet and every other sheet follows automatically.Home Renovation Contractor KPI Dashboard in Google Sheets
- Owners, priorities and written formulas. Each KPI carries an owner (Operations Manager, Project Scheduler, Estimating Lead, Site Supervisor, Warranty Coordinator, Safety Officer, Client Success Lead and others), a Critical / High / Medium priority, a reporting frequency, a formula and a definition.Home Renovation Contractor KPI Dashboard in Google Sheets
Dashboard Pages Explanation
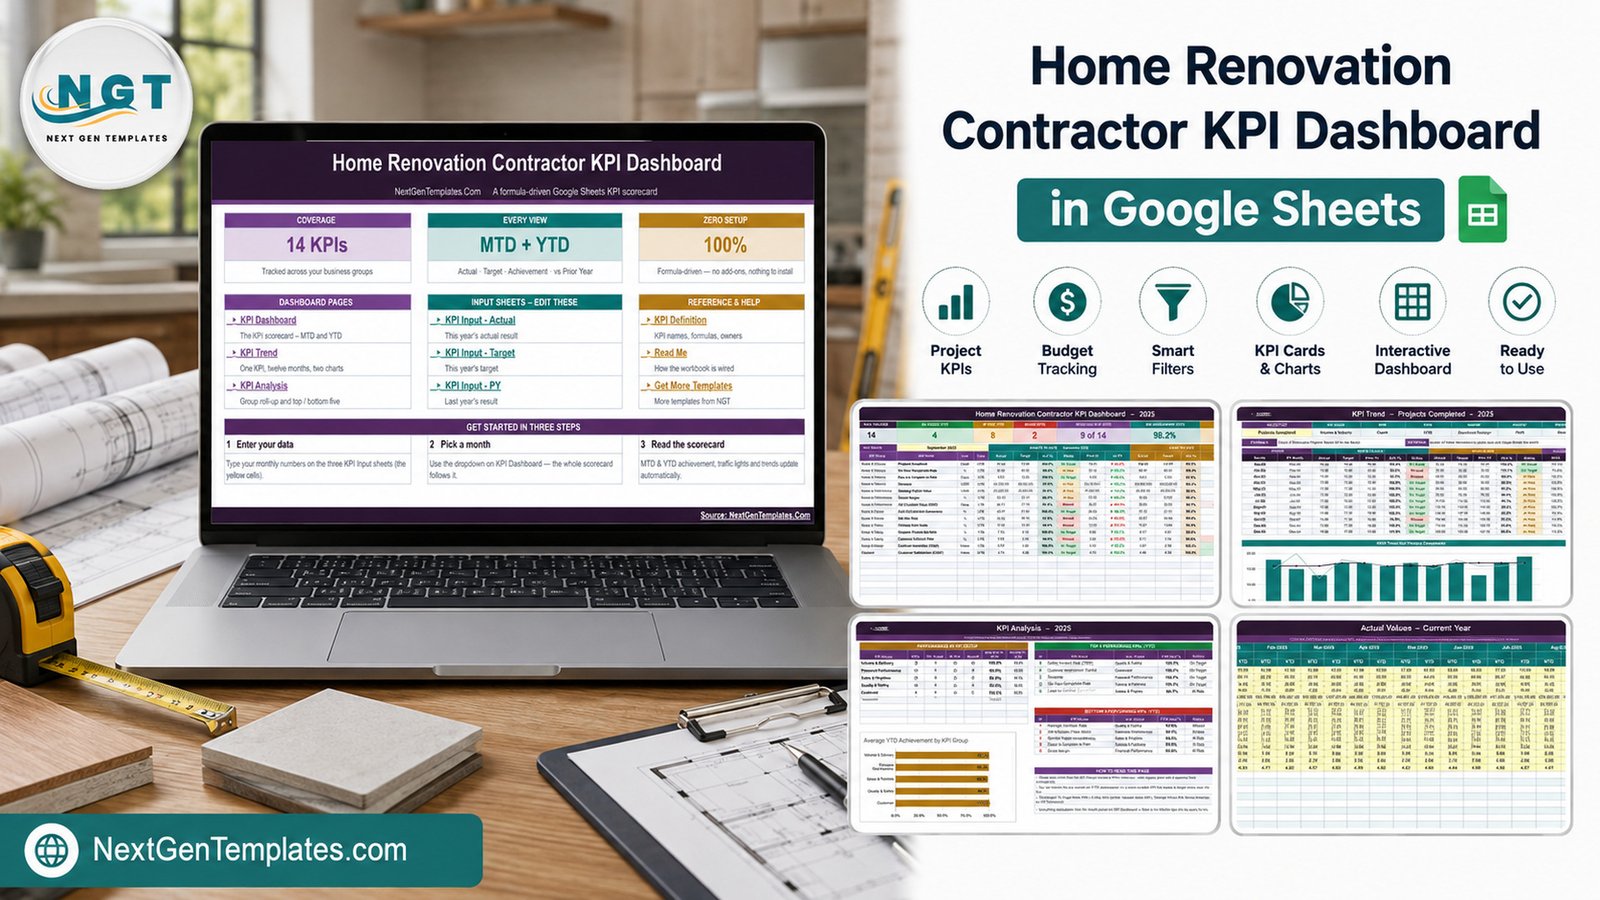
The workbook has ten sheets: Home, KPI Dashboard, KPI Trend, KPI Analysis, KPI Input – Actual, KPI Input – Target, KPI Input – PY, KPI Definition, Read Me and Get More Templates. Six are shown here.Home Renovation Contractor KPI Dashboard in Google Sheets
Home
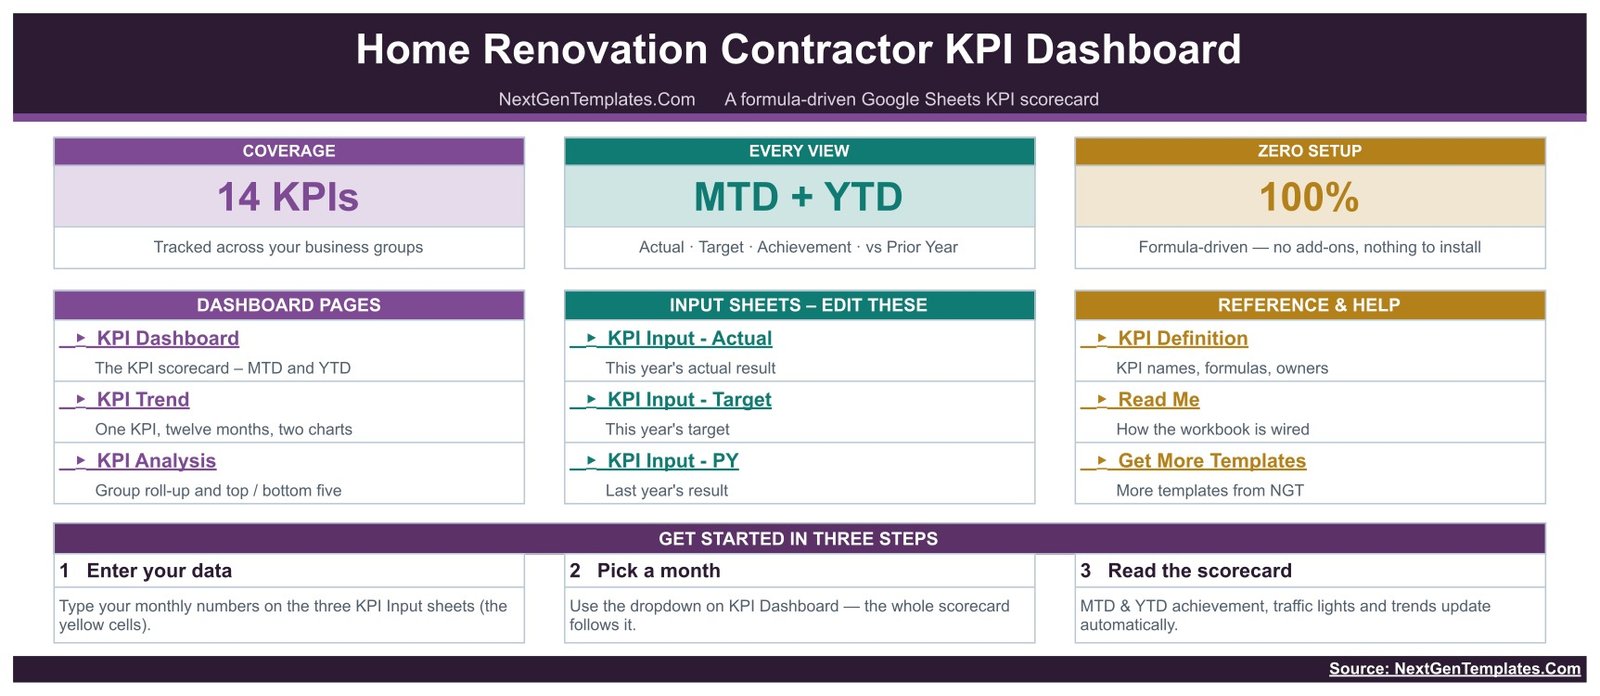
The navigation page. Three stat cards state the coverage (14 KPIs), the views (MTD + YTD across Actual, Target, Achievement and vs Prior Year) and the setup (100% formula-driven, nothing to install). Three link columns below them jump to the dashboard pages, the three input sheets and the reference sheets, followed by a three-step start guideHome Renovation Contractor KPI Dashboard in Google Sheets
KPI Dashboard
The scorecard. Under the seven header tiles and the Select Month dropdown, all 14 KPIs are listed with their group, unit and type, then a Month-to-Date block and a Year-to-Date block, each carrying Actual, Target, Ach %, Status, Prior Yr and vs PY. A footnote on the sheet spells out the UTB/LTB rule and the three status thresholds.Home Renovation Contractor KPI Dashboard in Google Sheets
KPI Trend
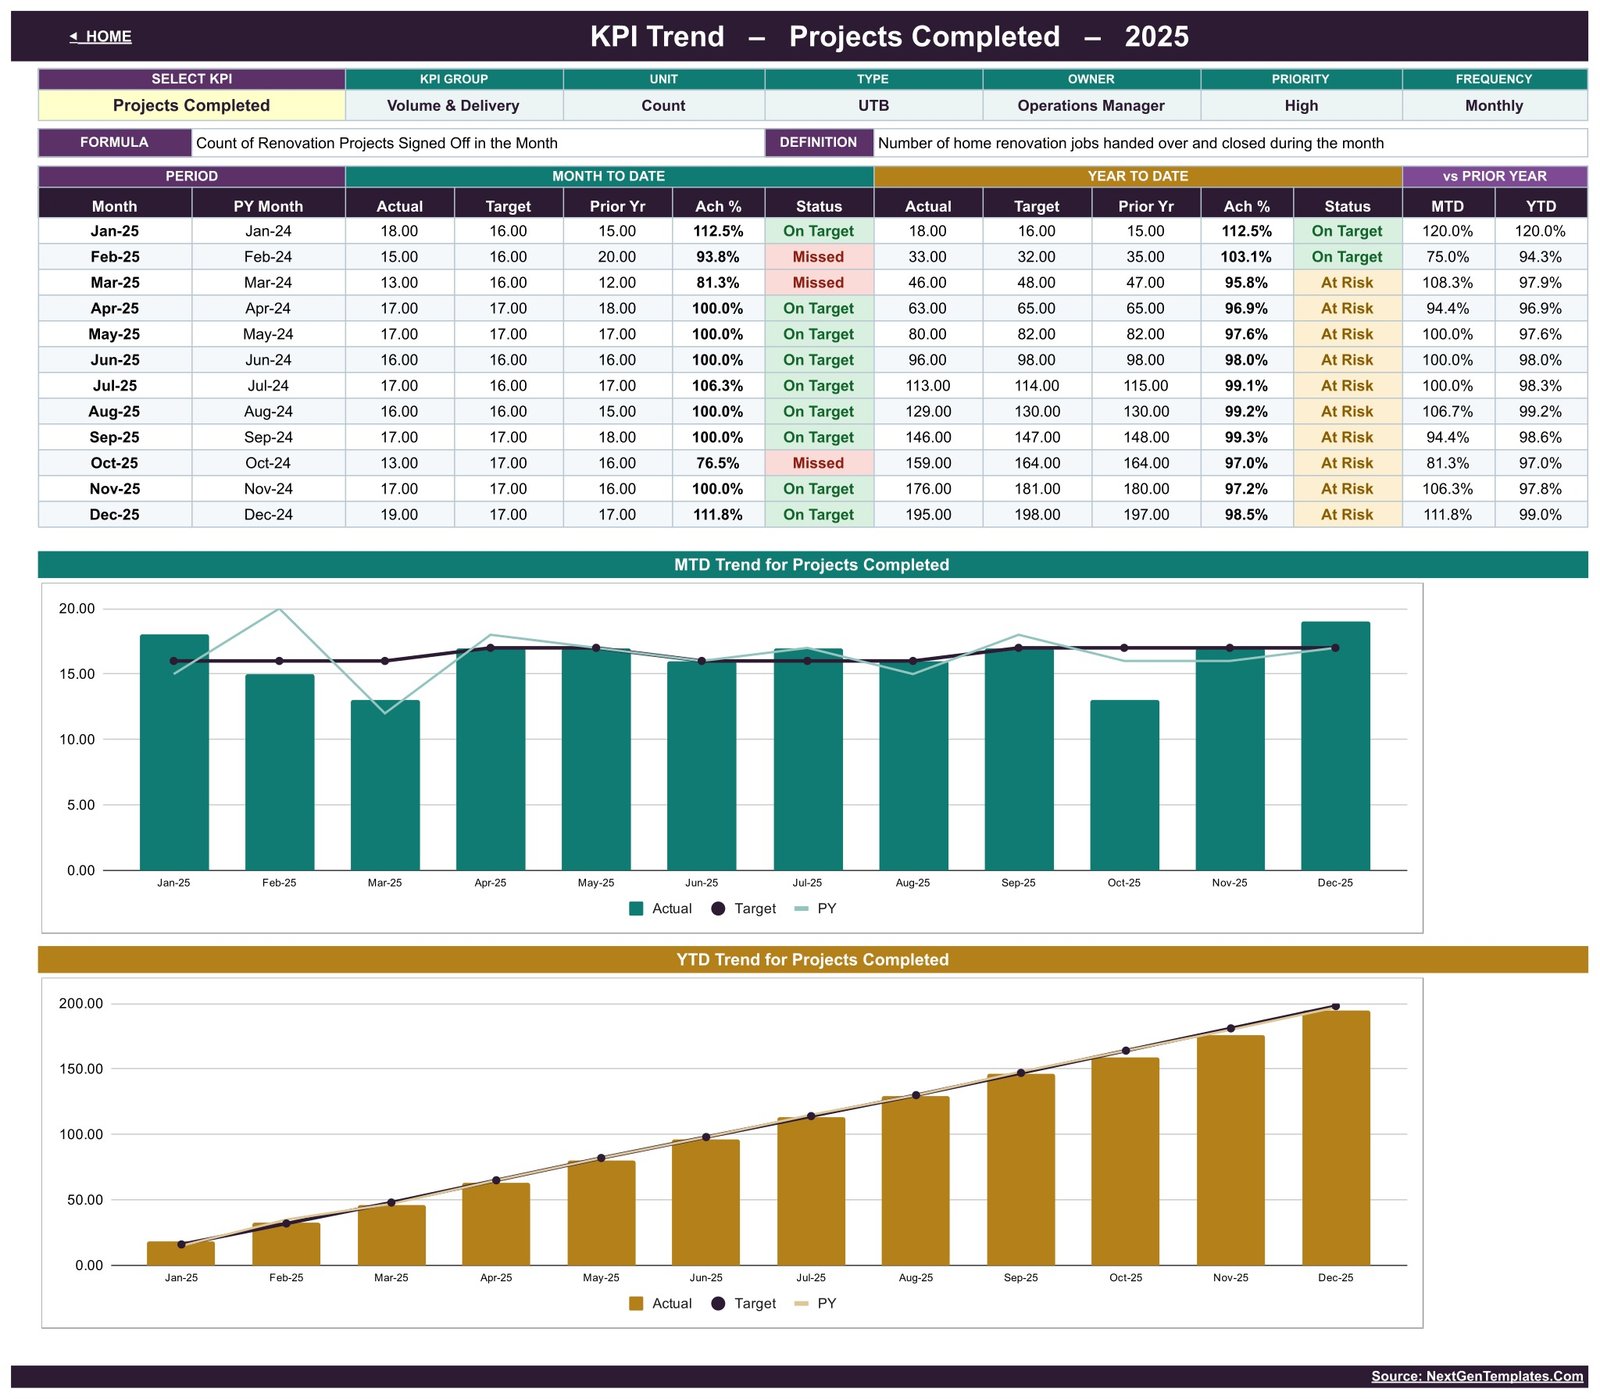
One KPI over twelve months. The selector at the top pulls that KPI’s group, unit, type, owner, priority, frequency, formula and definition, then a table lists every month with MTD and YTD actual, target, prior year, achievement and status, plus vs-prior-year columns. Two charts follow — MTD Trend for Projects Completed and YTD Trend for Projects Completed — each plotting actual columns against a target line and a prior-year line.Home Renovation Contractor KPI Dashboard in Google Sheets
KPI Analysis
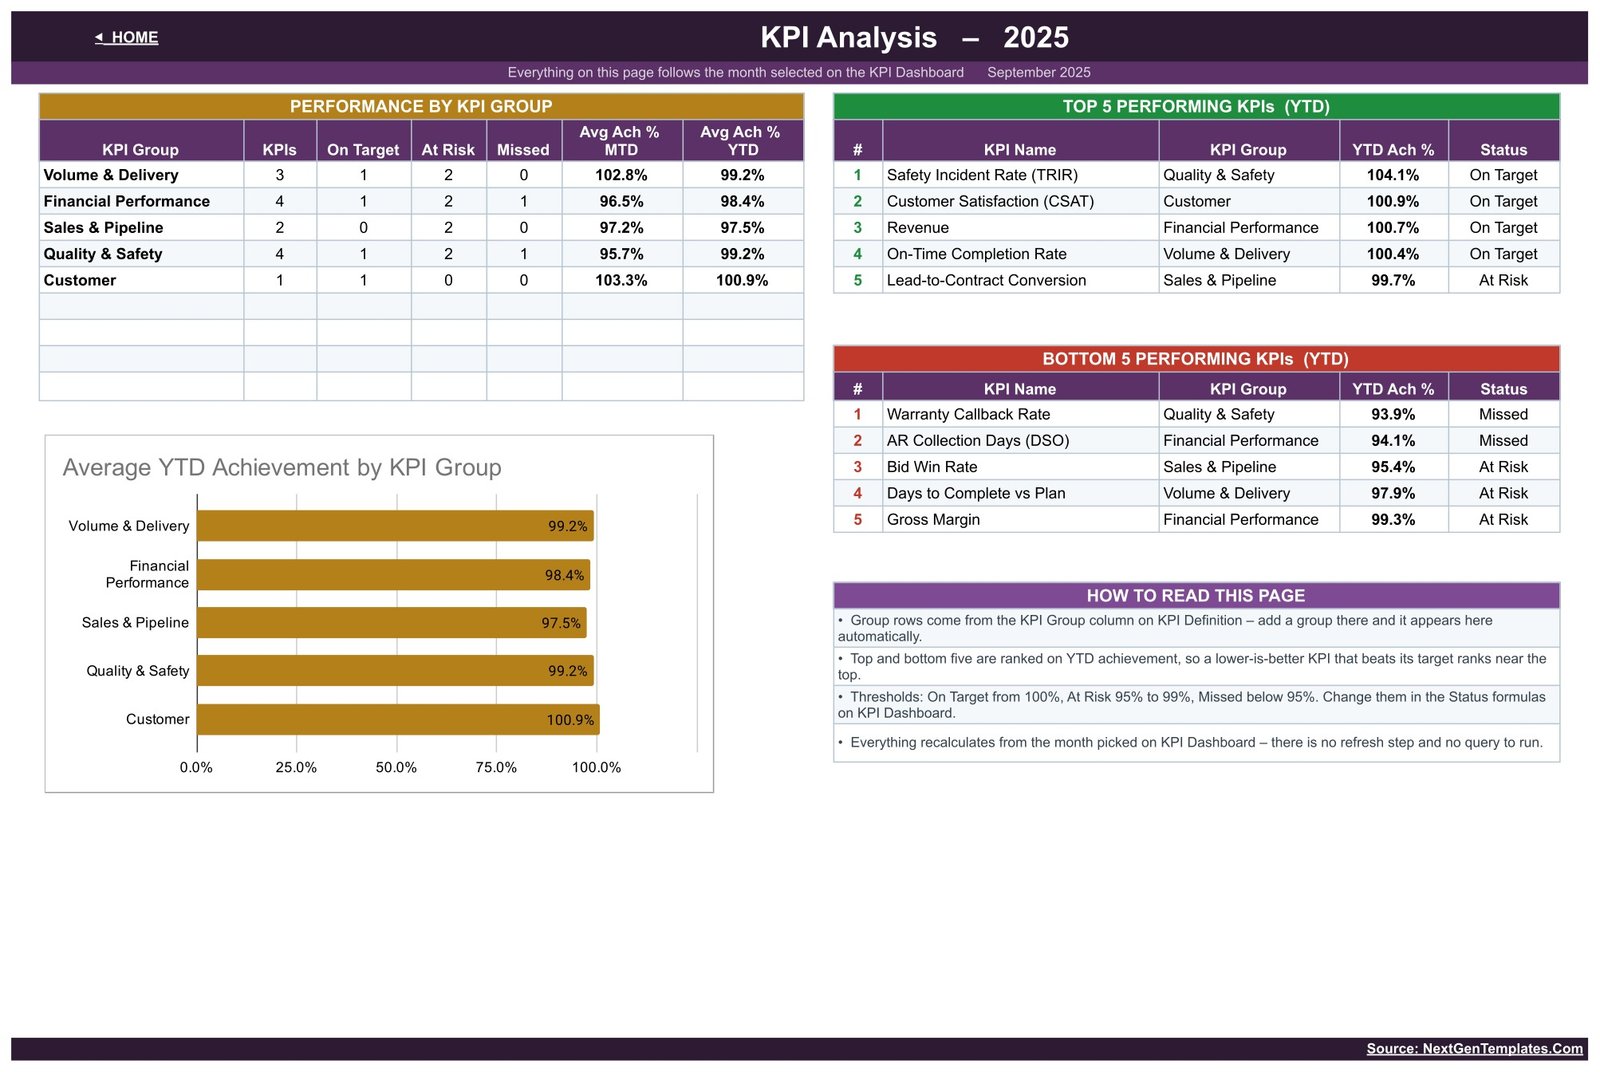
The roll-up. Performance by KPI Group counts the KPIs, On Target, At Risk and Missed in each group and averages achievement for MTD and YTD. Top 5 and Bottom 5 Performing KPIs (YTD) rank all 14 metrics with their group and status. The chart Average YTD Achievement by KPI Group compares the five groups, and a How To Read This Page panel explains where the thresholds live.
KPI Input – Actual
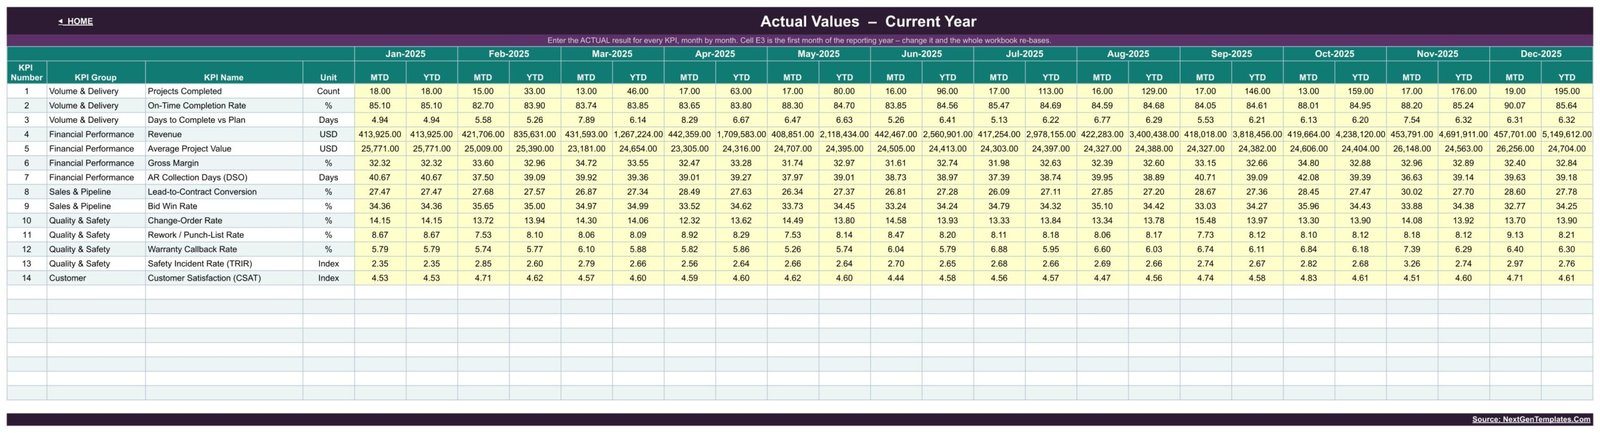
Where the typing happens. Every KPI has an MTD and a YTD cell for each of the twelve months, all in yellow. Two further sheets in the identical layout hold this year’s target and last year’s result. Cell E3 sets the first month of the reporting year, so an April–March or July–June year behaves the same way.
KPI Definition
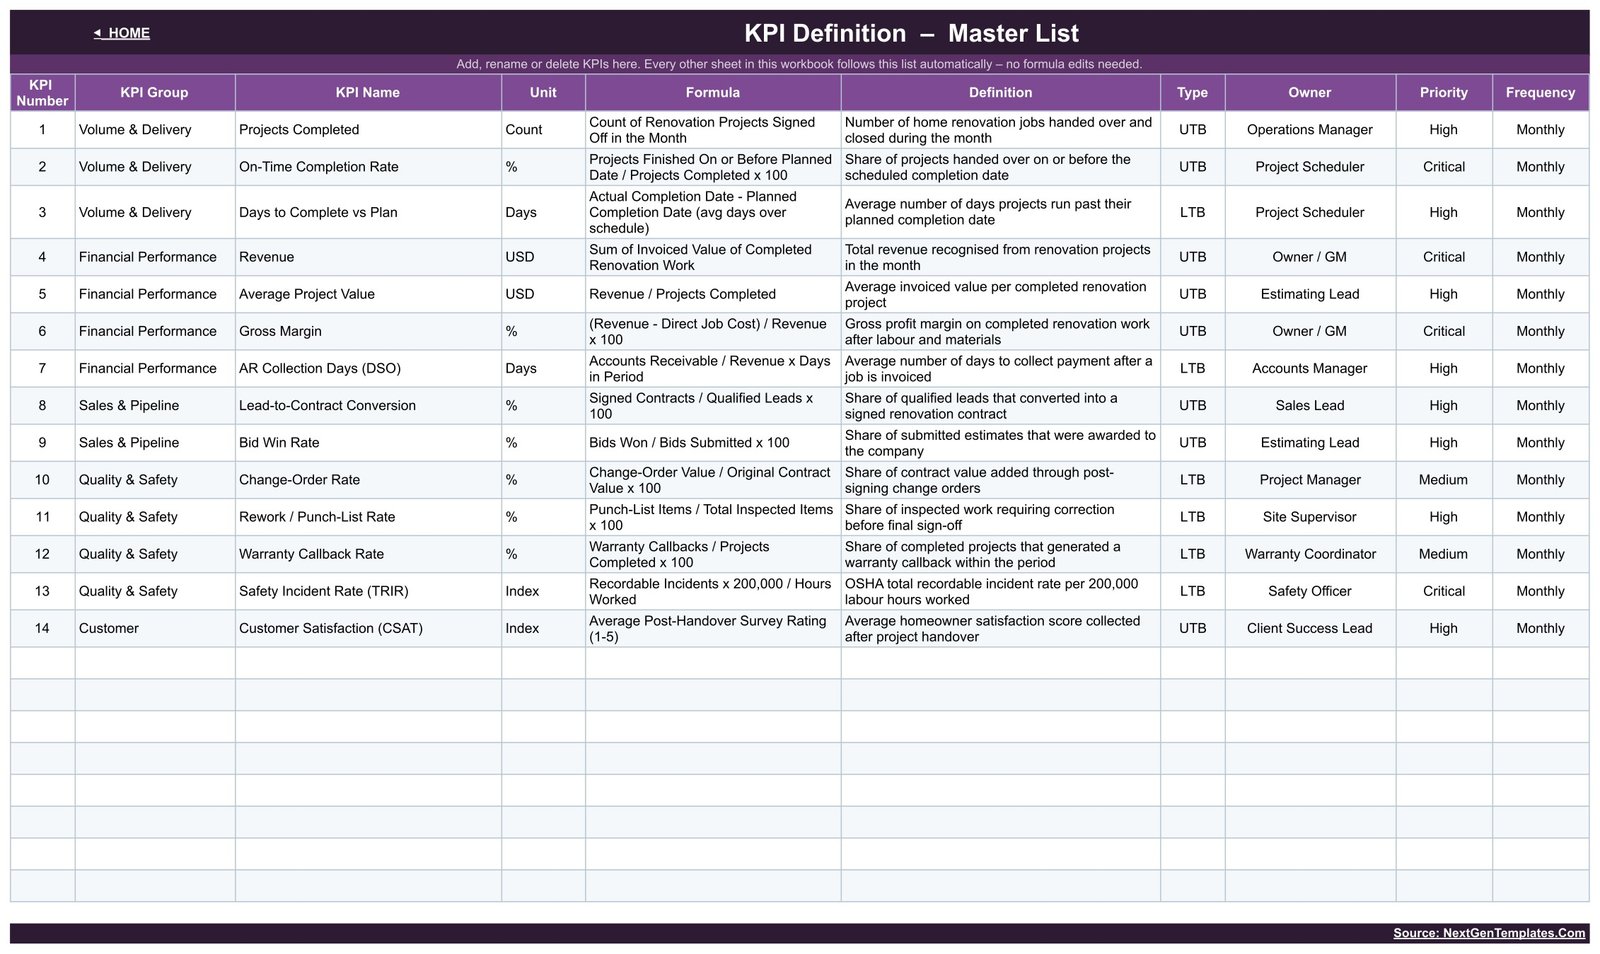
The master list: group, name, unit, formula, definition, type, owner, priority and frequency for all 14 KPIs. Safety Incident Rate (TRIR), for instance, is written out as Recordable Incidents × 200,000 ÷ Hours Worked — the standard OSHA recordable-incident rate — and is owned by the Safety Officer at Critical priority.
Google Sheets vs. a Microsoft Excel Dashboard vs. Paid Job-Costing SaaS — Feature Comparison
| Feature | This Google Sheets KPI dashboard | Microsoft Excel dashboard | Buildertrend / JobTread / CoConstruct |
|---|---|---|---|
| Cost | $8.99 one-time ✅ | $10–25 one-time plus an Office licence | $99–$499 per month |
| Platform | Any browser, a Google account only ✅ | Desktop Excel | Vendor web app |
| Setup time | Under 15 minutes ✅ | Under 15 minutes | Days of onboarding |
| Real-time team collaboration | Native, multi-user ✅ | Needs OneDrive co-authoring | Yes ✅ |
| Mobile access | Free Sheets app ✅ | Excel mobile, limited | Yes ✅ |
| Share with a link | Yes, view or edit ✅ | File attachment | Paid seat required |
| Customisable KPIs | Edit one list, all pages follow ✅ | Edit named ranges | Vendor-defined fields |
| Job costing and scheduling engine | No — reporting only | No | Yes ✅ |
| Year-1 cost at 5 users | $8.99 ✅ | ~$25 plus licences | $1,200–$6,000 |
For a renovation firm that wants a board-ready monthly scorecard without paying for a full job-costing platform, this dashboard sits in the sweet spot — it reports, it does not run your jobs.
Who Should Use This Template
Perfect for:
- Owners of 3–50 person renovation, remodeling and fit-out firms who want one agreed monthly number set
- Operations and project managers who report on-time completion, punch-list and change-order rates
- Estimating and sales leads tracking bid win rate and lead-to-contract conversion
- Bookkeepers and office managers already assembling revenue, margin and collection days by hand
Not a fit if:
- You need a document that proves code compliance, licensing or permit status — this is not that document
- You want live job costing, scheduling, purchase orders or a client portal — buy a platform instead
- You expect the numbers to arrive automatically from QuickBooks or a field app; entry here is manual
- You need the demo figures to mean something — they are invented sample data and nothing more
Real-World Use Cases
Dan runs a 12-crew kitchen-and-bath remodeling company. On the first Monday of each month he types his numbers into the Actual sheet, picks the month, and walks into the leadership meeting with on-time completion, gross margin and warranty callbacks already colour-coded — instead of rebuilding a spreadsheet from invoices every month.
Priya is the office manager at a whole-home renovation firm. She opens the KPI Trend page, selects AR Collection Days (DSO), and shows the owner four straight months of drift against last year’s line — a twelve-month table rather than an argument.
Marcus estimates for a general contractor. He lives in the Sales & Pipeline group, watching Bid Win Rate and Lead-to-Contract Conversion, and uses the Bottom 5 Performing KPIs table to decide which quotes are worth chasing next quarter.
Advantages of the Home Renovation Contractor KPI Dashboard in Google Sheets
The practical gain is time. Fourteen metrics that normally live in four different places — the accounting file, the scheduler, the estimator’s spreadsheet and the punch-list clipboard — land on one page that anyone with the link can read on a phone from a job site. The cost gain is obvious too: a one-time $8.99 against $99 a month and up for a job-management platform, if all you actually need is the monthly scorecard.
Because it is plain Google Sheets, nothing is locked. There is no add-on to authorise, no script to approve and no vendor account. If you want a fifteenth KPI, you add a row. If your fiscal year starts in April, you change one cell. Standard Google Sheets functions are all that is under the hood.
Opportunities for Improvement
Two honest notes from reviewing this build. First, every KPI — including derived ones — is typed in rather than calculated from the others. Average Project Value is documented as Revenue ÷ Projects Completed, but it is an input cell, so the demo values do not reconcile exactly against the Revenue and Projects Completed rows; if you want it computed, replace the input cell with a formula. Second, the vs-Prior-Year columns on the KPI Trend page are plain text, while the same columns on the KPI Dashboard are coloured by direction — a cosmetic inconsistency between two pages.
Everything else checked out: the seven header tiles, the group roll-up counts, the Top 5 and Bottom 5 rankings and the cumulative YTD totals all recompute correctly from the visible numbers. Beyond that, the usual spreadsheet limits apply — data entry is manual, there is no audit trail, and anyone with edit access can overwrite a cell.
Best Practices
- Fix the KPI list first. Edit KPI Definition before you type a single number, so you are not re-entering months of history later.
- Share view-only with the wider team and keep edit rights with one person, so the yellow cells stay clean.
- Enter the prior-year sheet once. It is what makes the vs-PY arrows and the trend chart’s PY line worth anything.
- Agree the thresholds. If 95% is not really “At Risk” for your firm, change the Status formulas and say so in the Read Me sheet.
- Keep a copy per year. Duplicate the file each January rather than overwriting last year’s actuals.
Explore Relevant Templates
The closest relative is the Home Renovation Contractor KPI Scorecard in Google Sheets — same topic, different product: a 10-KPI scorecard without this file’s month picker, KPI Trend page and KPI Analysis roll-up. For single-trade and single-room work, look at the Kitchen Remodeling KPI Scorecard and the Bathroom Remodeling KPI Scorecard. Commercial fit-out teams are covered by the Interior Fit-Out KPI Scorecard and the Scaffolding Services KPI Scorecard. If you want to see the identical dashboard structure applied to another trade first, the CCTV Installation KPI Dashboard in Google Sheets uses the same month-picker layout.
Also available as: a Power BI edition — Home Renovation Contractor KPI Dashboard in Power BI, slug home-renovation-contractor-kpi-dashboard-in-power-bi — is being prepared and is not live yet, so there is no link to give you. It is a separate build with its own KPI set and its own page count, not a port of this file. A Kitchen Remodeling KPI Dashboard in Google Sheets is also in preparation.
Want to build skills like this step by step? The Excel Pivot Tables & Dashboards course on NextGenTemplates Academy covers KPI reporting from the ground up, with practice files.
Get the Home Renovation Contractor KPI Dashboard in Google Sheets
Frequently Asked Questions
Does this make our renovation work compliant or our estimates accurate?
No. It is a reporting template over numbers you type in. It does not establish building-code, permit, licensing or lien compliance, it is not an inspection record or safety assessment, and it produces no binding or accurate estimate, bid or contract. Your licensed obligations are unchanged.
Are the figures in the screenshots real?
No. Revenue, margins, cycle times, change-order rates, callback rates and satisfaction scores in the images are invented demo data used to show the layout. Clear them and type your own into the three input sheets.
What KPIs does the Home Renovation Contractor KPI Dashboard in Google Sheets track?
Fourteen: Projects Completed, On-Time Completion Rate, Days to Complete vs Plan, Revenue, Average Project Value, Gross Margin, AR Collection Days (DSO), Lead-to-Contract Conversion, Bid Win Rate, Change-Order Rate, Rework / Punch-List Rate, Warranty Callback Rate, Safety Incident Rate (TRIR) and Customer Satisfaction (CSAT).
Can I change the KPIs or the status thresholds?
Yes to both. The KPI Definition sheet is the master list — add, rename or delete rows and every page follows. The On Target / At Risk / Missed cut-offs live in ordinary Status formulas on the KPI Dashboard sheet and can be edited directly.
How long does setup take?
Under 15 minutes to copy the file, set your first reporting month in cell E3 and start entering. Loading all three input sheets with a full twelve months of history takes longer, but the dashboard is usable from the first month you type.
How does this compare to Buildertrend or JobTread?
Those platforms manage jobs — scheduling, costing, client portals — from roughly $99 per month. The Home Renovation Contractor KPI Dashboard in Google Sheets is an $8.99 one-time monthly scorecard. It reports the outcome of your work rather than running it, and many firms happily use both.
Do I need Excel or any add-on?
Neither. The file opens in Google Sheets in any browser with a free Google account, and it is 100% formula-driven — no add-ons to authorise, no scripts to approve and no refresh step to remember.
About the Author
Built by PK — Microsoft Certified Professional with 15+ years of Excel, Google Sheets and Power BI experience. Founder of NextGenTemplates, reaching 300K+ subscribers across YouTube channels. Every template is hand-built and tested before release.
Conclusion
If your monthly renovation review currently means opening four files and arguing about which number is right, this one replaces the argument with a single colour-coded page — 14 KPIs, MTD and YTD, month picker, twelve-month trends and a group roll-up, for less than the cost of one lunch. Just remember what it is: a report over your own typed numbers, not a compliance document and not a job-management system.
Instant download · One-time payment · No subscription
Last updated: September 2026