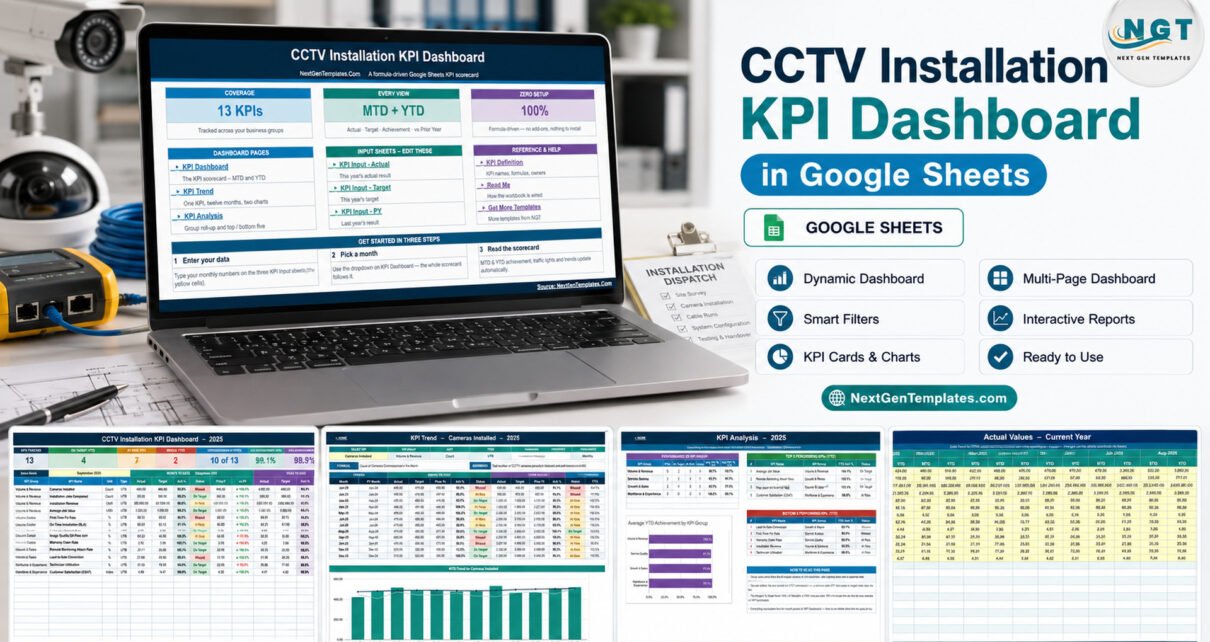
CCTV Installation KPI Dashboard in Google Sheets brings 13 operational measures into one formula-driven monthly review. A CCTV contractor can compare actual, target and prior-year results, see MTD and YTD achievement, and separate On Target, At Risk and Missed performance without subscribing to field-service software. The template covers volume, revenue, service quality, sales growth and workforce experience. It does not connect to cameras or automate job dispatch; it turns figures you already collect into a clear scorecard, trend view and management analysis.
If you have been searching for a CCTV installation dashboard, Google Sheets KPI dashboard, security installation KPI template or CCTV contractor performance tracker, this article explains exactly what the workbook includes, how its formulas work and where it fits in your reporting process.
Get the CCTV Installation KPI Dashboard in Google Sheets

Key Features of CCTV Installation KPI Dashboard in Google Sheets
The workbook combines a monthly selector, direction-aware KPI calculations and three management views. Its supplied list contains 13 measures:
- Cameras Installed
- Installation Jobs Completed
- Installation Revenue
- Average Job Value
- First-Time Fix Rate
- On-Time Installation (SLA)
- Callback / Rework Rate
- Image Quality QA Pass Rate
- Warranty Claim Rate
- Remote Monitoring Attach Rate
- Lead-to-Sale Conversion
- Technician Utilisation
- Customer Satisfaction (CSAT)
Each definition specifies a unit, formula, owner, priority, frequency and direction. UTB means upper is better; LTB means lower is better. That distinction matters for callback and warranty rates because beating a lower target should increase achievement rather than reduce it.

Dashboard Pages Explanation
Home and navigation
The Home page confirms the 13-KPI scope and groups the workbook into dashboard pages, input sheets, and reference/help pages. Its three-step workflow is straightforward: enter monthly data, pick a month, then read the scorecard.
KPI Dashboard
The main scorecard presents seven headline cards: total KPIs tracked; YTD counts for On Target, At Risk and Missed; the number improving versus prior year for the selected month; average MTD achievement; and average YTD achievement. Each KPI row then shows MTD and YTD actual, target, achievement, status, prior-year result and comparison.
KPI Trend
Select one KPI to see its group, unit, type, owner, priority, frequency, formula and definition. The table lays out all twelve months while two charts compare actual, target and prior-year values for MTD and cumulative YTD performance.

KPI Analysis
This page rolls results into Volume & Revenue, Service Quality, Growth & Sales, and Workforce & Experience. It displays group-level counts and average achievement, a YTD group chart, plus top-five and bottom-five tables. Everything follows the month selected on KPI Dashboard.

Input and definition sheets
KPI Input – Actual, KPI Input – Target and KPI Input – PY hold monthly values for the current and previous year. KPI Definition is the editable master list. The screenshot below shows the actual-value layout; target and previous-year pages use the same month-by-month approach.


CCTV Installation KPI Dashboard vs. Excel vs. Paid Field-Service SaaS – Feature Comparison
| Feature | Google Sheets template | Excel dashboard | Paid field-service SaaS |
|---|---|---|---|
| Cost model | $8.99 sale price, one time | Usually one-time file cost | Often monthly per user |
| Setup time | Make a copy and replace sample figures | Download, store and configure | Account setup and onboarding |
| Team collaboration | Native Google sharing | Depends on cloud storage | Usually native |
| Editable KPI definitions | Yes, including UTB/LTB direction | Usually editable | Depends on subscription and module |
| Live camera monitoring | No | No | Only in specialist platforms |
| Dispatch, work orders and CRM | No | No | Often available |
| Best fit | Flexible monthly management reporting | Offline or Microsoft-centric reporting | Integrated operational workflow |
The template is deliberately narrower than SaaS. It gives managers an auditable spreadsheet calculation and an editable definition register. It does not pretend to replace quoting, scheduling, stock control, customer records or surveillance software.
Who Should Use This Template
CCTV installation companies, security-system contractors, branch managers, quality-assurance leads, sales directors and operations teams can use it when monthly source figures already exist. The shared-sheet format is useful when several reviewers need the same scorecard but only nominated owners should edit inputs.
It is not suitable if you require technician routing, real-time job updates, customer sign-off, equipment serial-number tracking, live camera feeds, automated SLA clocks or direct integrations. Those requirements call for a field-service, CRM or security-management application.
Real-World Use Cases
Monthly operations meeting
Priya, an operations manager, loads the previous month’s results and selects the review month. She uses the status counts to focus the meeting on missed and at-risk KPIs rather than reading every line equally.
Quality improvement
Daniel, a QA lead, compares first-time fix rate, callback/rework rate, image-quality QA and warranty claims. KPI Trend helps him separate a one-month swing from a recurring pattern.
Commercial performance
Amira, a sales director, reviews installation revenue, average job value, monitoring attachment and lead conversion. The prior-year columns provide context without claiming that the template forecasts future sales.
Advantages of This CCTV Installation Dashboard
- Clear scope: 13 named measures are supplied, with formulas and definitions visible.
- Direction-aware logic: lower-is-better quality rates are scored correctly.
- Multiple review levels: executives see summary cards, managers see rows, and analysts can inspect monthly trends.
- Editable governance: owners, priorities and frequencies can be changed in the master list.
- Collaboration: your own Google Sheets copy can use familiar sharing permissions.
- No add-on requirement: calculations are formula-driven inside the workbook.
Opportunities for Improvement
Like any reusable spreadsheet, this template depends on consistent inputs. It has no automatic import from accounting, job-management or camera systems. The supplied thresholds are generic, not contractual service levels. Businesses should review the KPI definitions, owners and targets before adopting them. If a KPI requires a weighted formula, a rolling window or job-level audit trail, an advanced user will need to extend the model.
Best Practices
- Agree each definition and data owner before the first reporting cycle.
- Keep raw source records outside the dashboard and enter only verified monthly aggregates.
- Restrict edit access to input owners; give reviewers view or comment access.
- Do not change formulas during a live review. Record proposed changes and apply them before the next cycle.
- Annotate unusual events separately so a one-off project does not get mistaken for a trend.
- Archive a monthly PDF or version snapshot when governance requires a fixed record.
Google provides official guidance for sharing files from Google Drive, including viewer, commenter and editor permissions.
Explore Relevant Templates
Read our CCTV Installation KPI Scorecard guide for the separate, simpler scorecard-family product, or compare the Security System Installation KPI Scorecard guide. Installation teams can also view the store’s Solar Panel Installation KPI Dashboard and Glass Installation KPI Dashboard. Browse the full Google Sheets KPI dashboard collection.
Get the CCTV Installation KPI Dashboard in Google Sheets
Want to build skills like this step by step? The Excel Pivot Tables & Dashboards course on NextGenTemplates Academy walks you through it with practice files.
Frequently Asked Questions
Is this the same as the CCTV Installation KPI Scorecard?
No. This KPI Dashboard includes KPI Trend, KPI Analysis and separate actual, target and prior-year input pages. The scorecard is a different template family.
How many KPIs are included?
There are 13 supplied KPI definitions across four groups. They can be renamed or replaced.
What data do I need?
You need monthly actual, target and previous-year values for the KPIs you choose to keep.
Does it monitor cameras or jobs in real time?
No. It does not connect to surveillance hardware, dispatch tools, ticketing systems or APIs.
Can I change the status rules?
Yes, if you are comfortable editing spreadsheet formulas. The supplied rules are On Target from 100%, At Risk from 95% to 99%, and Missed below 95%.
Can several people use it?
Yes. After making your copy, apply Google Sheets sharing permissions that match each person’s role.
What arrives after purchase?
The downloadable PDF includes the Google Sheets copy link. Click it to create an editable copy in your own Google Drive.
About the Author
Built by PK – Microsoft Certified Professional with 15+ years of Excel, Google Sheets, and Power BI experience. Founder of NextGenTemplates, reaching 300K+ subscribers across YouTube channels. Every template is hand-built and tested before release.
Conclusion
CCTV Installation KPI Dashboard in Google Sheets is a focused reporting tool for contractors that want monthly visibility without a recurring software commitment. Its strongest advantage is transparency: the KPI list, direction, ownership, monthly inputs and calculations remain visible and editable. Use it as a repeatable review layer over your existing operational data, not as a replacement for systems that create or validate that data.
For more spreadsheet tutorials, visit PK: An Excel Expert on YouTube.
Last updated: September 11, 2026.