Interior Fit Out KPI Scorecard in Google Sheets gives contractors and project teams a focused monthly view of ten programme, cost, quality, safety and handover measures. Enter actual, target and prior-year values, choose a month, and the formula-driven cards update with status lights, changes and mini trends. A separate KPI Trend sheet compares MTD and YTD performance across all twelve months. This is a reporting template, not construction-management software: it does not schedule work, calculate estimates, manage snags or certify compliance.
Teams evaluating an interior fit-out scorecard, fit-out project KPI template, Google Sheets KPI scorecard or construction project performance tracker can use this guide to understand the workbook’s exact scope before buying.
Get the Interior Fit-Out KPI Scorecard in Google Sheets
Key Features of Interior Fit Out KPI Scorecard in Google Sheets
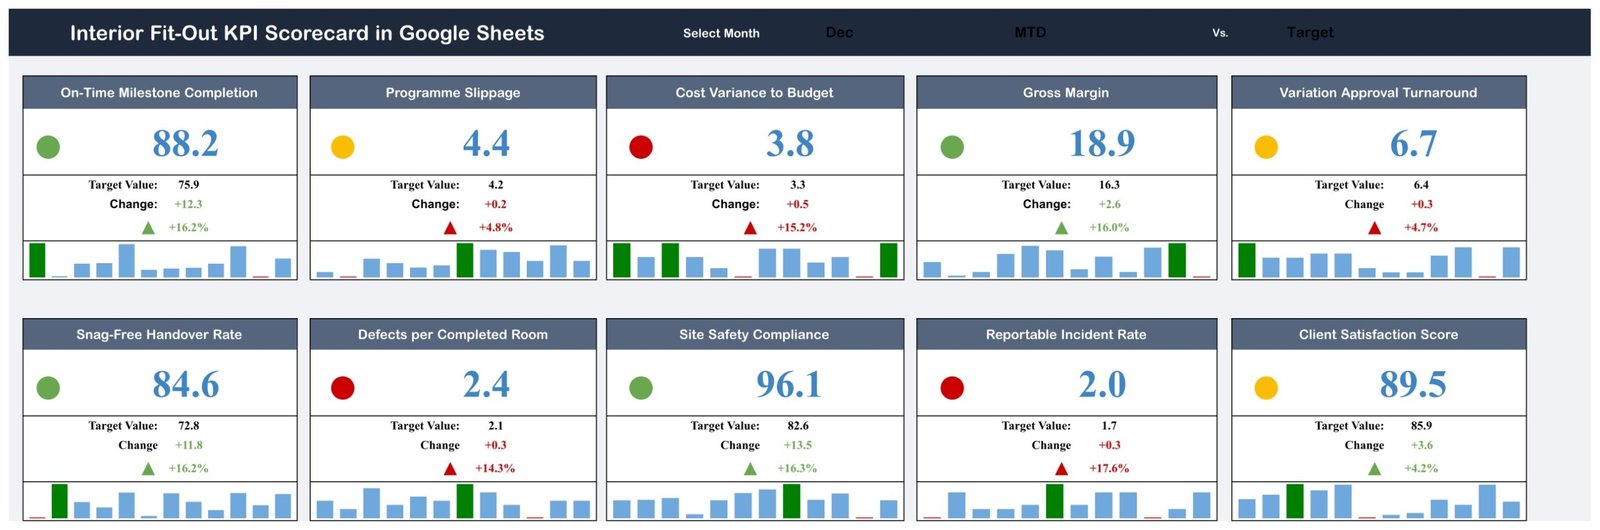
The scorecard ships with ten editable measures: On-Time Milestone Completion, Programme Slippage, Cost Variance to Budget, Gross Margin, Variation Approval Turnaround, Snag-Free Handover Rate, Defects per Completed Room, Site Safety Compliance, Reportable Incident Rate and Client Satisfaction Score.
The definitions distinguish upper-is-better measures from lower-is-better measures. This is important because lower programme slippage, fewer defects and a lower incident rate should score favourably, while higher milestone completion, gross margin and satisfaction should score favourably. The visible status lights give reviewers a quick route into the measures that need evidence or action.
Scorecard Pages Explanation
Main Scorecard
The main page contains ten cards arranged in two rows. Each card shows the selected month’s value, target, numerical change, percentage change, status light and a compact twelve-month series. The supplied sample is set to December. The month selector is the “Smart Filters” capability shown in the marketing image; there is no separate slicer engine.
KPI Trend
Select one KPI to see its group, unit, direction, formula and definition. Two charts compare MTD and YTD actual, prior-year and target values from January to December. This view is designed for investigation after the summary card identifies a question.

KPI Definition
The definition table documents all ten names, groups, units, formulas, plain-language definitions and UTB/LTB types. For example, On-Time Milestone Completion is milestones met on or before date divided by total milestones, while Programme Slippage is the forecast completion date less the contract completion date.

Input Data
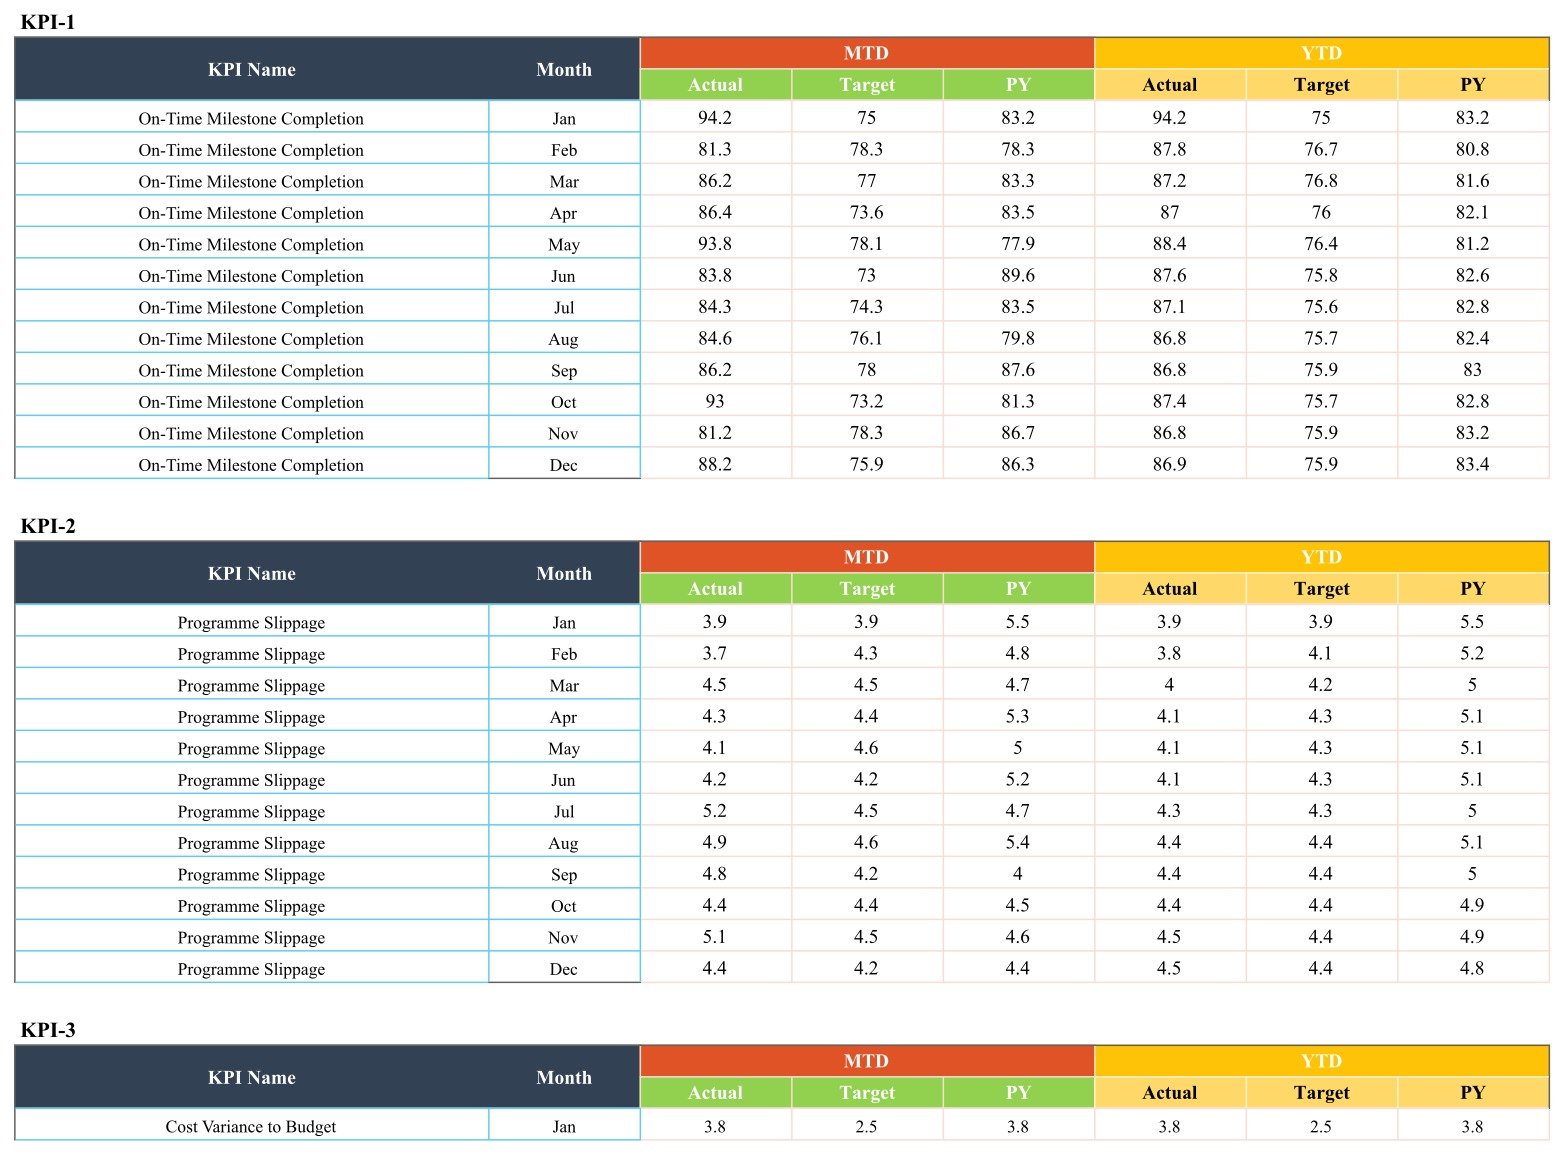
The input sheet organises each KPI by month with MTD and YTD actual, target and prior-year columns. Users replace the sample values with verified monthly aggregates. It is not a transaction database, so detailed cost lines, snag records and incident reports should remain in their proper source systems.
Interior Fit-Out KPI Scorecard vs. Excel vs. Paid Construction SaaS – Feature Comparison
| Feature | Google Sheets scorecard | Excel alternative | Paid construction SaaS |
|---|---|---|---|
| Cost model | $8.99 sale price, one time | Usually one-time file cost | Usually recurring |
| Setup | Make a copy and replace samples | Download and configure | Account setup and onboarding |
| Collaboration | Native Google sharing | Depends on cloud storage | Usually native |
| KPI definitions | Ten supplied and editable | Usually editable | Depends on vendor module |
| Schedules, drawings and RFIs | Not included | Not included | Often available |
| Detailed cost control | Aggregate KPIs only | Depends on workbook | Often available |
| Best fit | Flexible monthly review | Offline reporting | Integrated project workflow |
This scorecard fits between informal monthly slides and a full construction platform. It makes KPI logic visible and editable, but it relies on users to prepare correct inputs. That trade-off keeps the template affordable and adaptable.
Who Should Use This Template
Interior fit-out contractors, commercial managers, programme leads, project directors, quality teams and client-handover managers can use it when source data already exists. It works best when one person owns each measure and the team agrees definitions before comparing projects.
Do not use it as the sole system for contract administration, cost accounting, programme control, health and safety, statutory reporting or evidence retention. It offers a scorecard view, not the operational records behind that view.
Real-World Use Cases
Programme governance
Aisha tracks on-time milestones and slippage across active fit-out packages. When December worsens, she checks the underlying programme rather than treating the dashboard number as proof of cause.
Commercial performance
Ben reviews cost variance, gross margin and variation approval turnaround. He uses the status cards to prioritise which project records need reconciliation before the client meeting.
Quality and handover
Meera compares snag-free handover, defects per completed room and client satisfaction. She keeps detailed snag lists and survey responses outside the scorecard to preserve an auditable source.
Advantages of This Google Sheets KPI Scorecard
- Balanced coverage: programme, cost, quality, safety and handover appear in one review.
- Visible formula definitions: reviewers can see how each measure is intended to be calculated.
- Direction-aware scoring: the model handles both higher-is-better and lower-is-better KPIs.
- Monthly and cumulative views: MTD and YTD columns reduce the need for separate scorecards.
- Trend context: twelve-month charts help distinguish isolated exceptions from persistent movement.
- Shared access: normal Google Sheets permissions can support viewers, commenters and editors.
Opportunities for Improvement
The template does not import data automatically or keep a job-level audit trail. Its formulas should be reviewed against your contracts, accounting policy and reporting conventions. The supplied Reportable Incident Rate is normalised per 100,000 hours; other organisations or regulators may use a different basis. “Site Safety Compliance” is a user-entered KPI and does not establish legal compliance. Teams needing project-level drill-down, evidence attachments or automatic alerts should integrate other systems or extend the workbook carefully.
Best Practices
- Define the reporting cut-off, owner and evidence source for every KPI.
- Validate units and UTB/LTB direction before entering the first month.
- Keep detailed source records in the systems that own them.
- Restrict edit permission on formula cells and use viewer access for stakeholders.
- Review exceptions with narrative context; never infer root cause from a traffic light alone.
- Save a dated snapshot when a contract or governance process requires a fixed record.
For the first reporting cycle, work through one KPI from source evidence to scorecard output before loading all ten. Confirm that the same reporting period is used for actual, target and prior-year values, especially where YTD figures are cumulative. After the test agrees with the source, repeat the method for the remaining rows. Give each KPI owner a short data note covering the source system, cut-off time, exclusions and rounding rule. When a definition changes, record the effective month so historic comparisons are not silently reinterpreted. Treat a red or amber card as a prompt for investigation: open the programme, cost report, snag list, audit evidence or client survey that supplied the number. This simple control keeps the scorecard useful without asking it to become the source system.Interior Fit-Out KPI Scorecard in Google Sheets
Google’s official guide explains how to share files from Google Drive with viewer, commenter and editor access.Interior Fit-Out KPI Scorecard in Google Sheets
Explore Relevant Templates
For closely related reading, see our Home Renovation Contractor KPI Scorecard guide, Kitchen Remodeling KPI Scorecard guide and Bathroom Remodeling KPI Scorecard guide. Buyers can also compare the store’s Flooring Installation KPI Scorecard or browse the Google Sheets KPI template collection.Interior Fit-Out KPI Scorecard in Google Sheets
Get the Interior Fit-Out KPI Scorecard in Google Sheets
Want to build skills like this step by step? The Excel Pivot Tables & Dashboards course on NextGenTemplates Academy walks you through it with practice files.
Frequently Asked Questions
How many KPIs are included?
Ten measures are supplied across programme, commercial, quality, safety and client-handover themesInterior Fit-Out KPI Scorecard in Google Sheets
Can I change the KPI names and formulas?
Yes. The definition table is editable, but test changes carefully so the scorecard direction and source inputs stay aligned.
Does it track individual projects?
The supplied design is a consolidated monthly scorecard. It does not include a project register or project-level drill-down.Interior Fit-Out KPI Scorecard in Google Sheets
Does it replace a snagging or safety system?
No. It reports aggregate metrics and does not store detailed snag, audit or incident records.Interior Fit-Out KPI Scorecard in Google Sheets
What does Smart Filters mean?
It refers to the month dropdown and KPI selector visible in the workbook. There is no separate filter engine or add-on.
Can my team collaborate?
Yes. Apply Google Sheets permissions after creating your own copy.Interior Fit-Out KPI Scorecard in Google Sheets
What arrives after purchase?
The download is a PDF containing the Google Sheets copy link for this template.Interior Fit-Out KPI Scorecard in Google Sheets
About the Author
Built by PK – Microsoft Certified Professional with 15+ years of Excel, Google Sheets, and Power BI experience. Founder of NextGenTemplates, reaching 300K+ subscribers across YouTube channels. Every template is hand-built and tested before release.Interior Fit-Out KPI Scorecard in Google Sheets
Conclusion
Interior Fit Out KPI Scorecard in Google Sheets is best used as a transparent monthly review layer over trusted project records. Its ten cards make mixed performance visible, while the trend, definitions and input pages keep calculations understandable. Review the supplied formulas against your own reporting policy, maintain the underlying evidence, and use the traffic lights to ask better questions rather than as a substitute for professional judgement.Interior Fit-Out KPI Scorecard in Google Sheets
For more spreadsheet tutorials, visit PK: An Excel Expert on YouTube.
Last updated: September 11, 2026.Interior Fit-Out KPI Scorecard in Google Sheets