10 KPIs, 4 operating groups, 12 months, and MTD plus YTD views define the Scaffolding Services KPI Scorecard in Google Sheets. It turns approved monthly actual, target, and prior-year values into ten visual cards with traffic lights and compact trends. The workbook is intended for a recurring management review, not for recording individual scaffolds, inspections, workers, incidents, customers, or sites.
This walkthrough uses the real four-page template and names every supplied metric. It also explains the limits around safety and reporting terms. The scaffolding KPI template can highlight an internal variance, but it cannot determine legal duties or prove that work is safe or compliant.
Get the Scaffolding Services KPI Scorecard in Google Sheets
Key Features of the Scaffolding Services KPI Scorecard in Google Sheets
- 10 scaffolding performance measures across safety, operations, commercial results, and customer service.
- Ten-card scorecard with value, target, change, percentage change, status light, and monthly mini-chart.
- Month selector covering January through December.
- MTD and YTD modes for current-month and cumulative review.
- Actual, Target, or PY comparison selected from the scorecard.
- Direction-aware logic for 6 upper-the-better and 4 lower-the-better KPIs.
- KPI Trend page with Actual, Target, and PY charts for one selected metric.
- Definition table containing group, name, unit, formula, description, and UTB/LTB type.
- Monthly KPI Data table with MTD and YTD Actual, Target, and PY columns.
- Google Drive collaboration without an add-on, macro, or recurring software fee.
Scorecard Pages Explained
Scaffolding Services KPI Scorecard
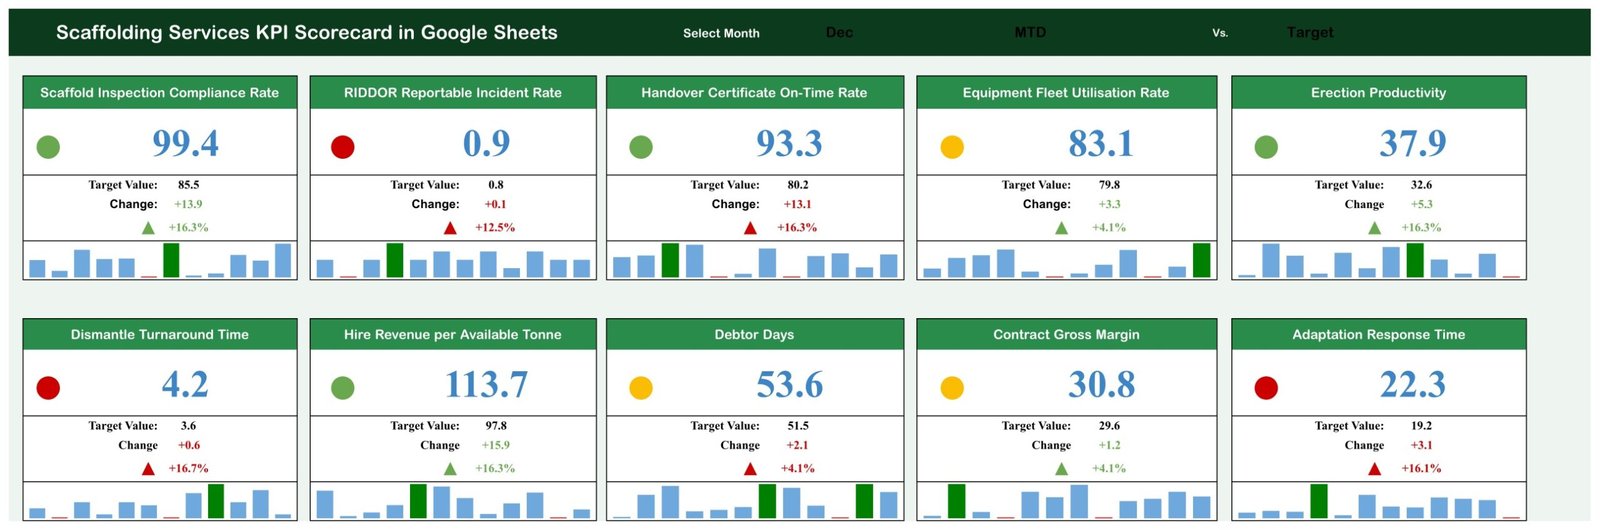
The main page contains exactly ten KPI cards. Select a month, choose MTD or YTD, and select whether the cards compare against Target or Previous Year. Each card presents the current value, comparison value, absolute change, percentage change, and coloured status, with a twelve-month chart beneath.
The December sample shows Scaffold Inspection Compliance Rate at 99.4 against an 85.5 target, RIDDOR Reportable Incident Rate at 0.9 against 0.8, Handover Certificate On-Time Rate at 93.3 against 80.2, and Equipment Fleet Utilisation Rate at 83.1 against 79.8. These values are fictional examples. They are not benchmarks, recommended targets, or statements about a real contractor.
KPI Trend
The trend page keeps the selected KPI’s group, unit, type, formula, and definition visible. Two charts compare Actual, Target, and PY across all 12 months: one for MTD and one for YTD. This makes it possible to distinguish a one-month change from a cumulative movement.

KPI Definition
The definition table is the reference page. It lists every metric, group, unit, written formula, definition, and direction. Reviewing this page is essential because the displayed formula text is a template definition; each business must confirm its data source, unit, reporting population, cut-off rules, and legal terminology before use.

KPI Data
The data page contains a monthly block for each KPI. MTD and YTD sections each hold Actual, Target, and PY. The supplied rows demonstrate the mechanics, including how a monthly actual rolls into a cumulative YTD value. Replace every fictional entry with an approved figure before presenting the scorecard as business performance.

The 10 KPIs and Their Scoring Direction
| KPI | Group | Unit | Direction |
|---|---|---|---|
| Scaffold Inspection Compliance Rate | Safety & Compliance | % | UTB |
| RIDDOR Reportable Incident Rate | Safety & Compliance | Per 100k hours | LTB |
| Handover Certificate On-Time Rate | Safety & Compliance | % | UTB |
| Equipment Fleet Utilisation Rate | Operations & Utilisation | % | UTB |
| Erection Productivity | Operations & Utilisation | m2/labour-day | UTB |
| Dismantle Turnaround Time | Operations & Utilisation | Days | LTB |
| Hire Revenue per Available Tonne | Commercial & Finance | GBP | UTB |
| Debtor Days | Commercial & Finance | Days | LTB |
| Contract Gross Margin | Commercial & Finance | % | UTB |
| Adaptation Response Time | Customer & Service | Hours | LTB |
Direction is not cosmetic. A lower incident rate, turnaround time, debtor-days result, or response time should be favourable. The LTB setting prevents the traffic light from rewarding a higher number in those four rows.
Scaffolding Services KPI Scorecard vs. Excel vs. Paid Hire Software – Feature Comparison
| Area | This Google Sheets KPI scorecard | Excel scorecard | Paid scaffold-hire platform |
|---|---|---|---|
| Price model | $8.99 sale price, one time | Template plus Microsoft 365 if required | Recurring subscription |
| Setup | Make a copy and replace monthly totals | Download and edit locally | Configuration and onboarding |
| Collaboration | Normal Google Drive sharing | Usually OneDrive or a shared file | Seat-based user accounts |
| Formula transparency | Visible in the sheet | Visible in the workbook | Vendor-controlled |
| Five-user year-one template cost | $8.99 total | Template plus licences | Usually hundreds or more |
| Asset and site records | No | Only if separately built | Often included |
| Inspection and handover evidence | No | No unless separately designed | Varies by system |
| Best use | Monthly review from approved aggregates | Local or offline reporting | Day-to-day hire and field operations |
Who Should Use This Template
The scorecard is aimed at scaffold contractors, access-service firms, hire depots, and project operations that already know their monthly totals. A managing director can see all four groups on one page. An operations lead can connect fleet utilisation with erection output and dismantle turnaround. A commercial manager can watch hire revenue, collection time, and contract margin together. A health-and-safety lead can include approved aggregate inspection, handover, and incident-rate figures in the same monthly meeting.
It is not appropriate as the primary record for scaffold design, inspection, handover, tagging, training, competence, RAMS, work at height, incidents, statutory notification, asset movement, hire contracts, customer accounts, or site activity. It does not store names, addresses, scaffold identifiers, incident details, or documentary evidence.
Real-World Use Cases
Depot utilisation review
A depot manager can compare Equipment Fleet Utilisation Rate with Hire Revenue per Available Tonne. If utilisation rises without revenue per tonne, the mix or pricing may need investigation rather than more stock.
Delivery and return-cycle review
An operations manager can read Erection Productivity with Dismantle Turnaround Time. Because one is UTB and the other LTB, the scorecard makes the desired direction explicit.
Commercial cash review
A commercial manager can place Contract Gross Margin beside Debtor Days. Strong margin does not remove the need to monitor how long payment collection takes.
Safety-management conversation
A safety leader can discuss the inspection, handover, and incident-rate indicators as aggregate internal signals. The underlying approved records and reporting process remain outside the template.
Advantages of the Scaffolding Services KPI Scorecard in Google Sheets
The main advantage is a consistent management view. As a scaffolding performance scorecard, its ten cards use the same month and comparison settings, which reduces mismatched reporting periods. Visible formulas and directions make review easier than a locked application. The KPI Trend page adds context without requiring a separate chart pack. Because the file sits in Google Drive, several reviewers can access one controlled copy.
The template is also intentionally limited to aggregates. Teams can use it without copying worker, customer, incident, or site-level personal data into a general management dashboard. That separation does not remove data-protection duties, but it supports a cleaner scope.
Opportunities for Improvement
Data entry is manual; there is no connection to hire, accounting, inspection, or incident systems. The scorecard does not include commentary fields, automated reminders, evidence attachments, access logs, or locked reporting periods. It has no quarterly or rolling-12-month view. The RIDDOR label and formula must be reviewed against the business’s current approved definition and reporting population before use.
A future edition could add structured imports, exception notes, configurable status bands, protected ranges, and a controlled sign-off page. None of those are included or advertised here.
Best Practices
- Assign one accountable owner and source system to every KPI.
- Confirm units, denominators, cut-off dates, UTB/LTB direction, and MTD/YTD logic before use.
- Use approved aggregate data and keep personal or incident-level details in controlled source records.
- Protect formula cells and grant edit permission only to the designated maintainers.
- Keep an untouched master copy before making structural changes.
- Replace all fictional values and document the reporting period used.
- Do not infer statutory reporting duties from a traffic light. The official HSE reporting guide explains who should report and how the reporting process works.
Explore Relevant Templates
- Home Renovation Contractor KPI Scorecard in Google Sheets
- Paving Contractor KPI Scorecard in Google Sheets
- Concrete Contractor KPI Scorecard in Google Sheets
- Roofing Contractor KPI Scorecard in Google Sheets
- Electrical Contractor KPI Scorecard in Google Sheets
Get the Scaffolding Services KPI Scorecard in Google Sheets
For a deeper look at the reporting skills behind scorecards, the Excel Pivot Tables & Dashboards course on NextGenTemplates Academy comes with practice files.
Frequently Asked Questions
How many KPIs does the scorecard include?
Ten: three safety and compliance indicators, three operations and utilisation measures, three commercial and finance measures, and one customer-service measure.
Can I change the KPIs?
Yes, but review the definition, data, and formula links together, then test every month and comparison setting.
What do UTB and LTB mean?
UTB means upper-the-better; LTB means lower-the-better. The direction controls whether a result above or below target is favourable.
Does this replace scaffold inspections or handover certificates?
No. It records aggregate KPI values only and is not an inspection, design, handover, tagging, or asset-control record.
Does the RIDDOR KPI decide or submit statutory reports?
No. It neither determines reportability nor sends a notification. The responsible person must follow current official guidance and the organisation’s approved process.
Are the sample values industry benchmarks?
No. They are fictional numbers included to demonstrate the scorecard and trend logic.
Does it require an add-on or Apps Script?
No. The current workbook is formula-driven and uses standard Google Sheets features.
About the Author
Built by PK – Microsoft Certified Professional with 15+ years of Excel, Google Sheets, and Power BI experience. Founder of NextGenTemplates, reaching 300K+ subscribers across YouTube channels. Every template is hand-built and tested before release.
Conclusion
The Scaffolding Services KPI Scorecard in Google Sheets gives a scaffold-service team a clear monthly review of ten approved aggregate measures. Its cards, selectable comparison, direction-aware traffic lights, trend page, and visible definitions support management discussion without claiming to replace operational or statutory records.
View the Scaffolding Services KPI Scorecard in Google Sheets on NextGenTemplates. For spreadsheet tutorials, visit PK: An Excel Expert on YouTube.
Last updated: September 11, 2026.