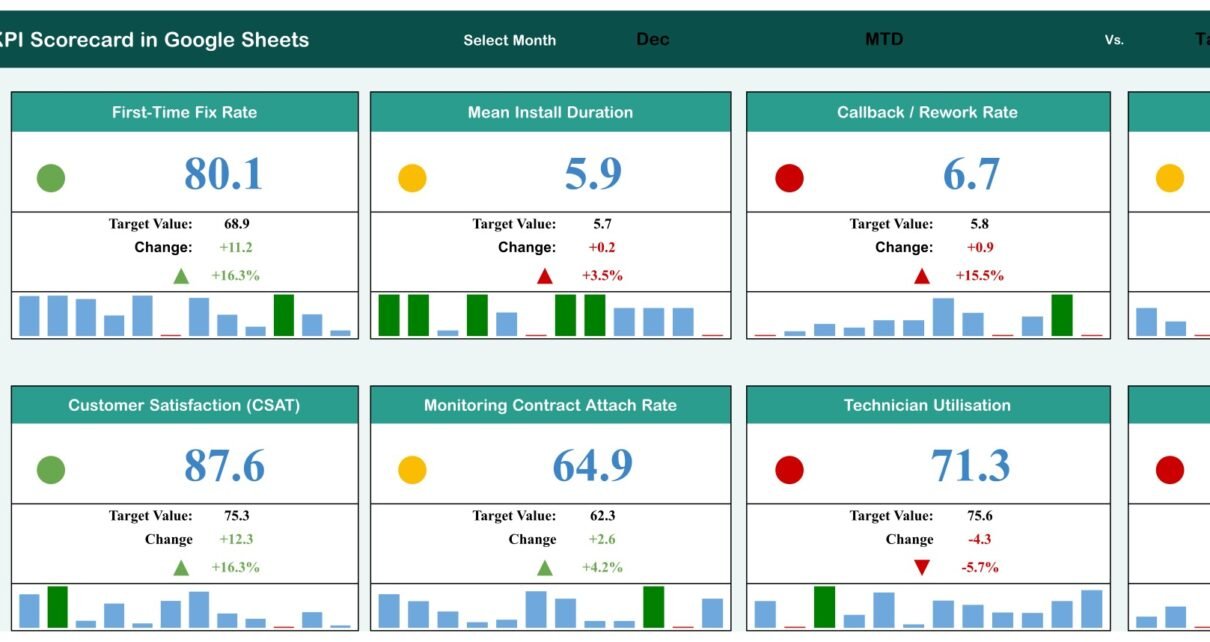
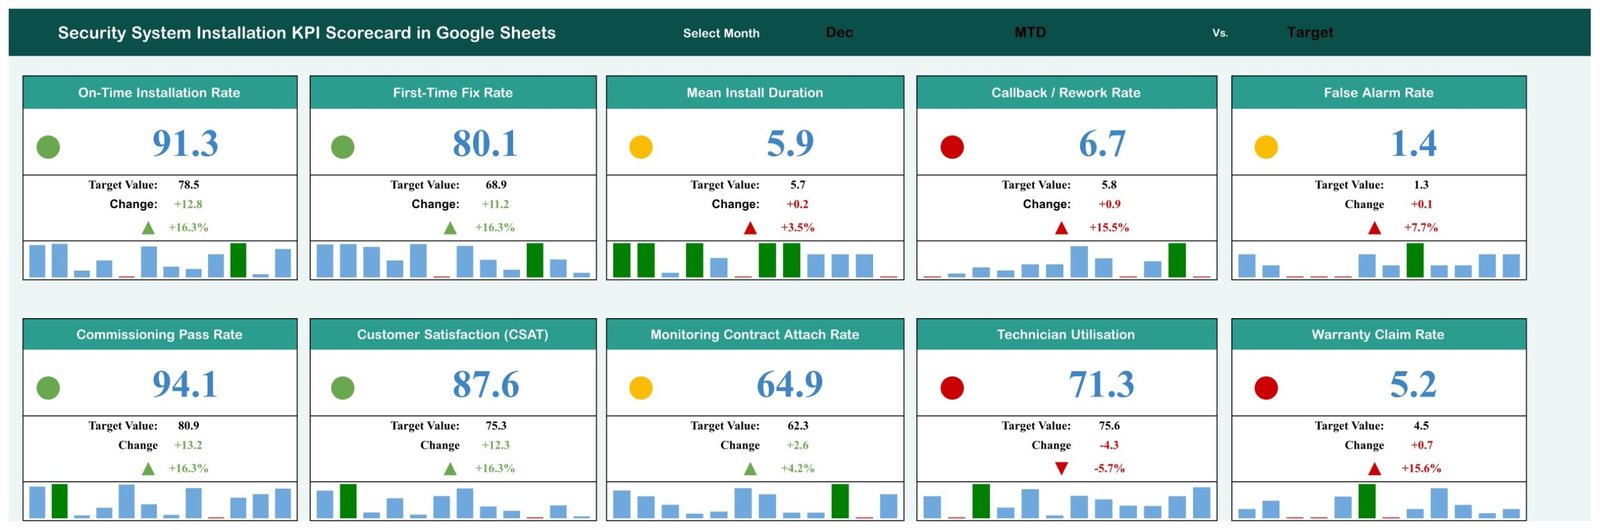
The Security System Installation KPI Scorecard in Google Sheets tracks 10 installation KPIs across 4 KPI groups and 8 tabs, with 12 months of MTD and YTD figures — 720 numbers in all — already loaded on the Input Data sheet. A single month dropdown drives all ten cards, six metrics are scored Upper-the-Better and four Lower-the-Better, and every card carries a red / amber / green light, a variance arrow and a twelve-month sparkline.
Most security system installation firms already know their numbers. On-time rate lives in the scheduler, callbacks live in the service inbox, false alarms live in a monthly note from the monitoring centre, and none of them ever sit on the same page at the same time. That is the gap this scorecard closes: one page, one month, ten metrics, coloured so you can see in three seconds which one needs a conversation.
Get the Security System Installation KPI Scorecard in Google Sheets
Key Features of the Security System Installation KPI Scorecard
- Ten security-install KPIs on one page. On-Time Installation Rate, First-Time Fix Rate, Mean Install Duration, Callback / Rework Rate, False Alarm Rate, Commissioning Pass Rate, Customer Satisfaction (CSAT), Monitoring Contract Attach Rate, Technician Utilisation and Warranty Claim Rate.
- Four KPI groups. Installation Delivery, Quality & Reliability, Commercial and Workforce — so the page reads as a business, not as a list.
- Traffic lights that understand direction. The KPI Definition tab tags each metric UTB or LTB. A falling Callback / Rework Rate or False Alarm Rate scores green, not red.
- Three header dropdowns. Select Month, MTD vs YTD, and Target vs PY. Between them you get four readings of the same month without touching a formula.
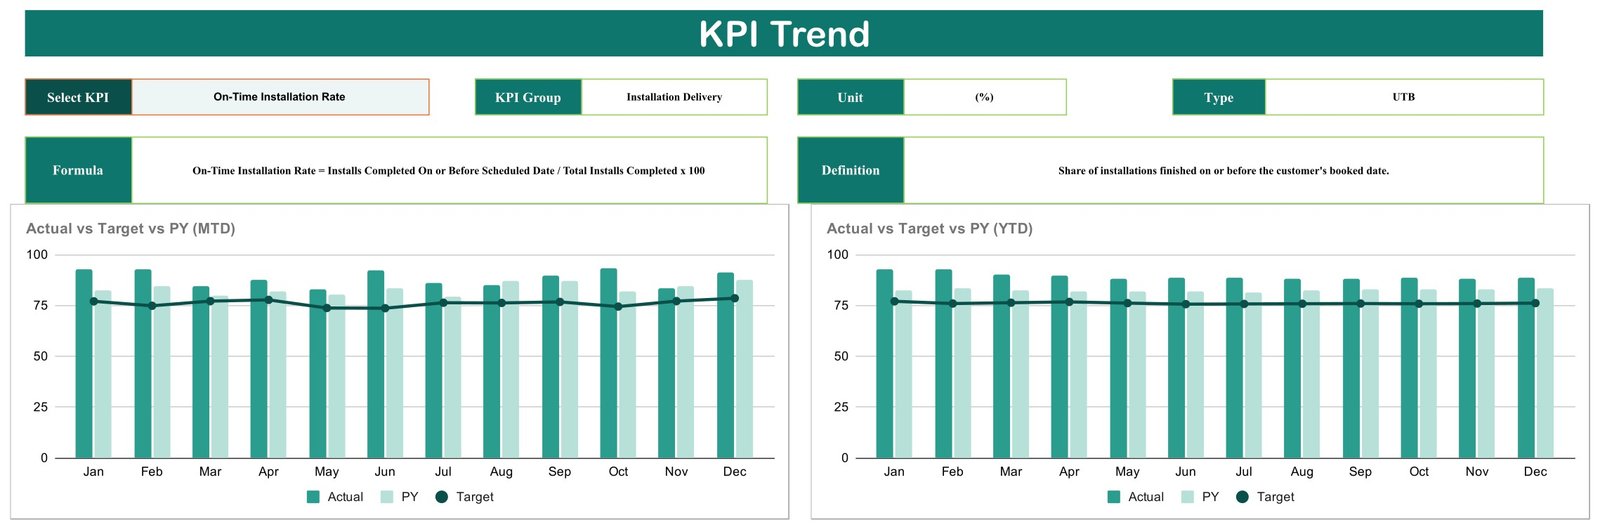
- A KPI Trend page that pairs the chosen metric’s formula and definition with Actual vs Target vs PY charts for both MTD and YTD.
- Every calculation written down. First-Time Fix Rate = Jobs Resolved on First Visit / Total Service Jobs x 100, and nine more like it, visible without opening a cell.
Sheets Explanation
The workbook has 8 tabs. Four are yours; the other four (Support, Trend_Support, Color Settings and a Read Me placeholder) hold the plumbing.
Scorecard
The page you open every month. Ten cards, each showing the selected month’s actual value in large type, the target beneath it, the absolute change, the percentage change with an up or down arrow, a red / amber / green light and a twelve-month sparkline. In the shipped sample data for December, On-Time Installation Rate reads 91.3 against a target of 78.5 (green), while Callback / Rework Rate reads 6.7 against 5.8 and turns red.
KPI Trend
Pick one KPI and this page fills in its KPI Group, Unit, Type, Formula and Definition, then draws two charts: Actual vs Target vs PY (MTD) and Actual vs Target vs PY (YTD), each spanning January to December. Actual and prior year are columns; target is a line across the top.
KPI Definition
The rulebook: ten numbered rows carrying KPI Group, KPI Name, Unit, Formula, Definition and Type. Units are mixed on purpose — percentages, hours for Mean Install Duration, a score for CSAT and “per system per month” for False Alarm Rate. Change a name here and it changes everywhere.

Input Data
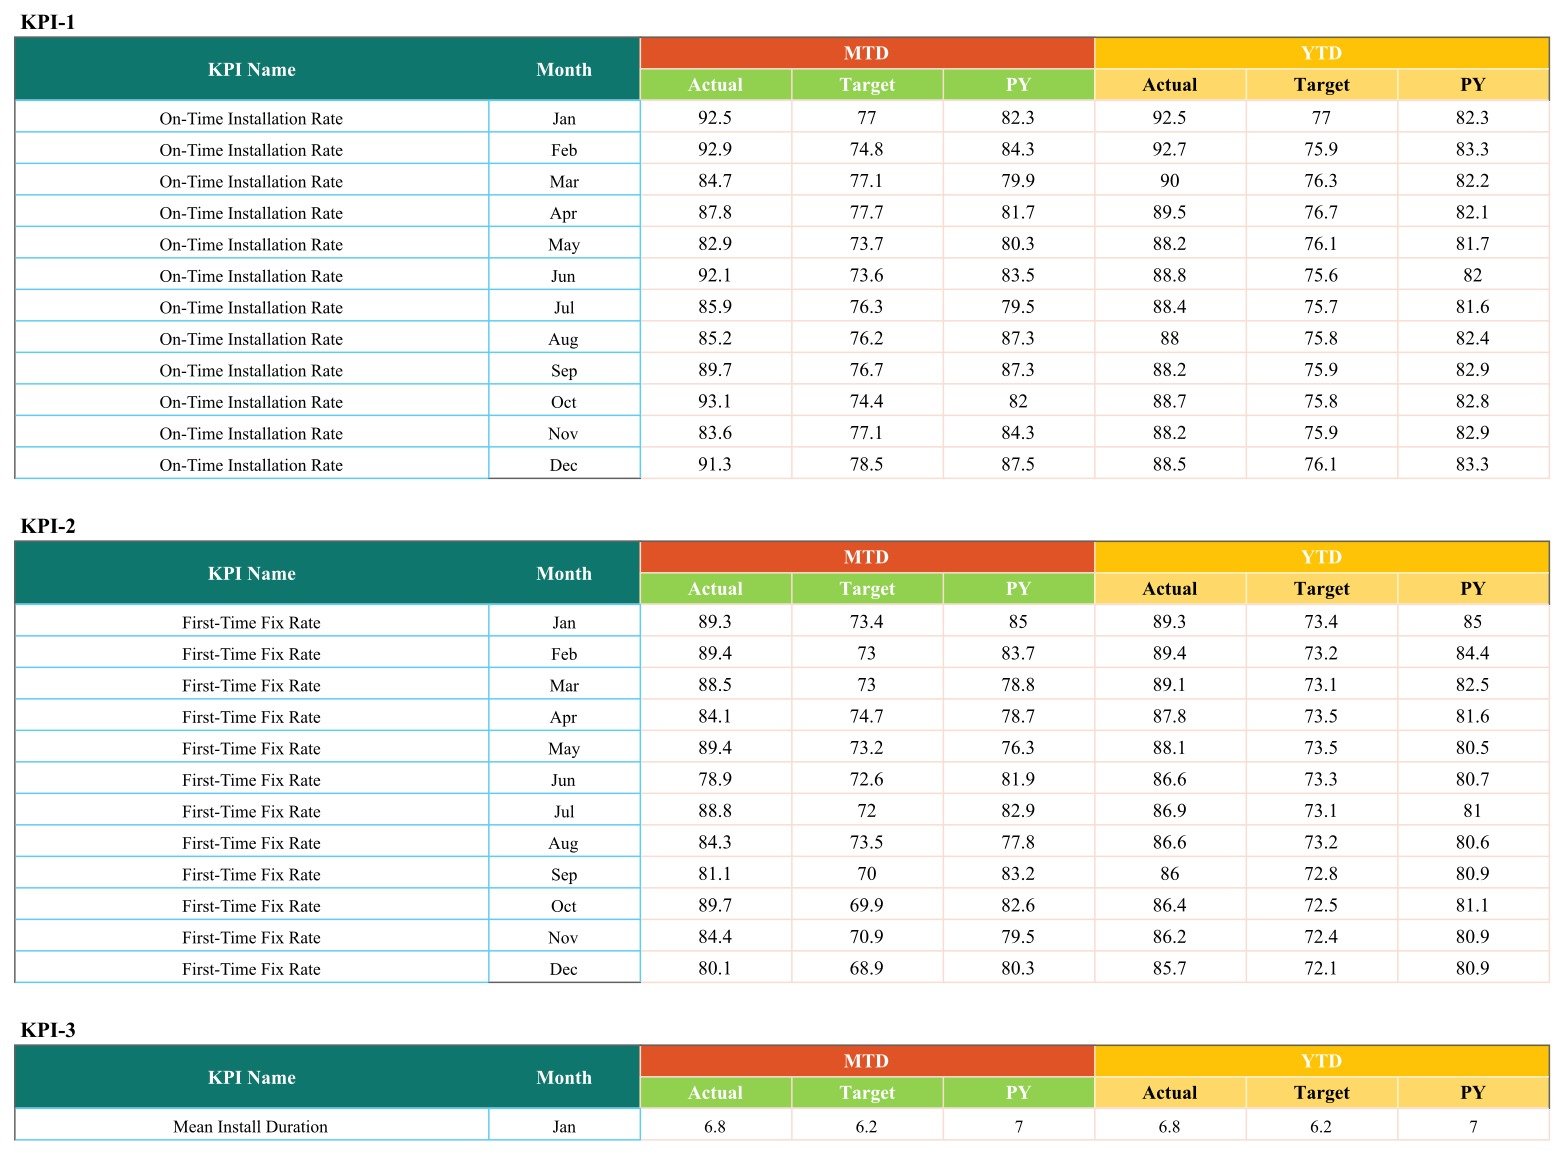
The only tab you type in. Ten stacked blocks, one per KPI, each with twelve month rows holding MTD Actual, MTD Target, MTD PY, YTD Actual, YTD Target and YTD PY. Everything else in the file reads from here.
Security System Installation KPI Scorecard vs. Excel Scorecard vs. Paid Field-Service SaaS — Feature Comparison
| Feature | This Google Sheets Scorecard | Microsoft Excel Scorecard | ServiceTitan / Jobber / Simpro |
|---|---|---|---|
| Cost | $8.99 one-time | $9.99 one-time | $49-300 / user / month |
| Platform | Google Sheets, browser or app | Desktop Excel | Vendor cloud |
| Setup time | Under 10 minutes | Under 10 minutes | 2-8 weeks onboarding |
| Real-time team collaboration | ✅ Native, multi-editor | Only via OneDrive co-authoring | ✅ Included |
| Mobile access | ✅ Google Sheets app | Limited | ✅ Dedicated app |
| Editable KPI names and formulas | ✅ Edit KPI Definition, cards follow | ✅ Editable | Vendor-defined metric set |
| Share with a link | ✅ One Google Drive link | Send the file | Per-seat login required |
| Job dispatch, invoicing, GPS | ❌ Not included | ❌ Not included | ✅ Full operational suite |
| Year-1 cost at 5 users | $8.99 | $9.99 | $2,940-18,000 |
For a security-install firm that wants a clean monthly KPI review without per-technician SaaS fees, this scorecard sits in the sweet spot — it reports on the work, it does not run the work.
Who Should Use This Template
Perfect for:
- Owners and operations managers of alarm, CCTV and access-control installation firms with 3-60 technicians
- Branch managers who present a one-page monthly KPI review upward
- Service coordinators tracking callbacks, first-time fix and false alarms month over month
- Anyone replacing a hand-built KPI spreadsheet that nobody trusts any more
Not a fit if:
- You need dispatch, technician GPS, invoicing or customer scheduling — this reports on the work, it does not run it
- You expect a live feed from an alarm receiving centre or a monitoring platform; every figure is entered monthly
- You want automatic alerts when a KPI turns red — the card colours, but nothing is sent
- You are looking for compliance, certification or code-conformance evidence; this template makes no such claim
Real-World Use Cases
Marcus owns a 14-technician alarm and CCTV installation firm. On the first Monday of each month he opens the scorecard, selects the month just closed, and reads the ten cards in about ten seconds. On-Time Installation Rate is green; Callback / Rework Rate is red. He clicks through to KPI Trend, sees callbacks rising for three consecutive months, and schedules a refresher on panel commissioning — a call he used to make on instinct.
Priya coordinates service for a regional access-control installer. False Alarm Rate and Commissioning Pass Rate are the two numbers that drive most of her inbound complaint calls, so she keeps both on the wall screen. When a customer phones about a recurring nuisance activation, the month dropdown lets her pull up that month’s figures mid-call rather than rebuilding a report afterwards.
Advantages of the Security System Installation KPI Scorecard
- The whole monthly review fits on one screen. Ten cards, coloured, with change and trend — no scrolling, no pivot refresh.
- It costs once. At $8.99 it is roughly what one seat of a field-service platform costs for four days.
- It is honest about direction. Metrics where lower is better are scored as such, which is the single most common mistake in hand-built KPI sheets.
- It is editable end to end. Rename metrics, rewrite formulas, change units — nothing is locked, and the cards follow.
Opportunities for Improvement
A few things are worth knowing before you buy, because no template is right for everyone.
- The month dropdown ships with two labels that do not match the data. The Select Month list on the Scorecard tab offers the long forms “June” and “July”, while the Input Data tab stores the short forms “Jun” and “Jul” like every other month. The lookup behind the cards is an exact text match, so choosing either of those two months blanks all ten cards until you edit the dropdown list to “Jun” and “Jul”. It is a one-minute fix in Data validation, and the KPI Trend page is unaffected because it reads its own month list.
- The Read Me tab is blank. Everything you need is on the KPI Definition tab, but the tab that should introduce the file has no content in it.
- The Color Settings tab is documentation, not a control panel. It shows the red / amber / green variance bands clearly, but the working thresholds live in the Support tab’s formulas — so changing Color Settings alone will not change a light.
- There is no KPI Analysis page. This build ships Scorecard, KPI Trend, KPI Definition and Input Data. If you want cross-KPI analysis, ranking and slicer-driven charts, that is the GS KPI Dashboard line rather than this one.
- Data entry is manual. There is no connector to a scheduler, CRM or monitoring platform; you paste twelve numbers per KPI per year.
Best Practices
- Fix the two month labels first. Open the Select Month cell, edit the Data validation list, and change “June” and “July” to “Jun” and “Jul” so every month works.
- Set targets before you enter actuals. A scorecard with no considered target is just a table of numbers with colours on it.
- Check the Type column against your own definitions. If your firm measures “Fix Rate” as a failure rate rather than a success rate, flip its UTB to LTB.
- Enter data on the same day each month and keep the prior-year column populated — the PY comparator is the half of the scorecard most people leave empty.
- Use KPI Trend before you act. A red card is a question, not an answer; the twelve-month chart usually contains the answer.
- Share the file view-only with the wider team and keep edit rights with whoever owns the numbers. Google’s own guide to sharing and permissions in Google Sheets covers the settings.
Explore Relevant Templates
- Window and Door Installation KPI Scorecard in Google Sheets — the closest relative on this line, same ten-card structure for a different trade.
- Glass Installation KPI Scorecard in Google Sheets — for glazing and glass fit-out businesses.
- Elevator Maintenance KPI Scorecard in Google Sheets — for contractors who also service building systems.
- Solar Panel Installation KPI Scorecard in Google Sheets — another install-and-commission trade with the same scorecard shape.
- Locksmith Business KPI Dashboard in Google Sheets — the natural pairing if you do mechanical locking alongside electronic security.
Want to build reporting pages like this yourself? The Excel Pivot Tables & Dashboards course on NextGenTemplates Academy teaches it step by step, with practice files.
Get the Security System Installation KPI Scorecard in Google Sheets
Frequently Asked Questions
What KPIs does the Security System Installation KPI Scorecard track?
It tracks 10 KPIs: On-Time Installation Rate, First-Time Fix Rate, Mean Install Duration, Callback / Rework Rate, False Alarm Rate, Commissioning Pass Rate, Customer Satisfaction (CSAT), Monitoring Contract Attach Rate, Technician Utilisation and Warranty Claim Rate, grouped as Installation Delivery, Quality & Reliability, Commercial and Workforce.
How long does setup take?
Under 10 minutes. Open the copy link in the PDF, rename any KPIs on the KPI Definition tab, then paste your own monthly figures into Input Data. The Security System Installation KPI Scorecard recalculates every card, light, arrow, sparkline and chart on its own.
Can I add an eleventh KPI?
The Security System Installation KPI Scorecard is built around ten KPI blocks, so adding an eleventh means copying a block on Input Data and extending the Support formulas. Renaming an existing KPI you do not use is far quicker, and is what most buyers do.
How does this compare to ServiceTitan or Jobber?
ServiceTitan and Jobber run your operation — dispatch, scheduling, invoicing — at $49-300 per user per month. The Security System Installation KPI Scorecard is an $8.99 one-time reporting layer over numbers you already have. Many firms run both; this replaces the monthly KPI spreadsheet, not the platform.
Do the traffic lights handle metrics where lower is better?
Yes. Six KPIs are tagged UTB and four LTB on the KPI Definition tab, so a falling Callback / Rework Rate, False Alarm Rate, Mean Install Duration or Warranty Claim Rate scores green. Change any Type and the arrow and light follow immediately.
Is this the same as the GS KPI Dashboard product?
No. The Security System Installation KPI Scorecard is the scorecard line — one month-picker page with ten traffic-light cards plus a KPI Trend page. The GS KPI Dashboard and GS Dashboard lines are wider, multi-page analytical builds with slicers and pivot-driven charts. They complement this file rather than duplicate it.
About the Author
Built by PK — Microsoft Certified Professional with 15+ years of Excel, Google Sheets and Power BI experience. Founder of NextGenTemplates, reaching 300K+ subscribers across YouTube channels. Every template is hand-built and tested before release.
Conclusion
Security system installation runs on small margins, and the difference between a good month and a bad one usually hides in four or five numbers: installs landed on time, jobs needing a second visit, alarms that turned out to be false, and technician hours actually billable. The Security System Installation KPI Scorecard in Google Sheets puts those, and six more, on one page with a colour against each.
Instant download · One-time payment · No subscription
Last updated: September 2026