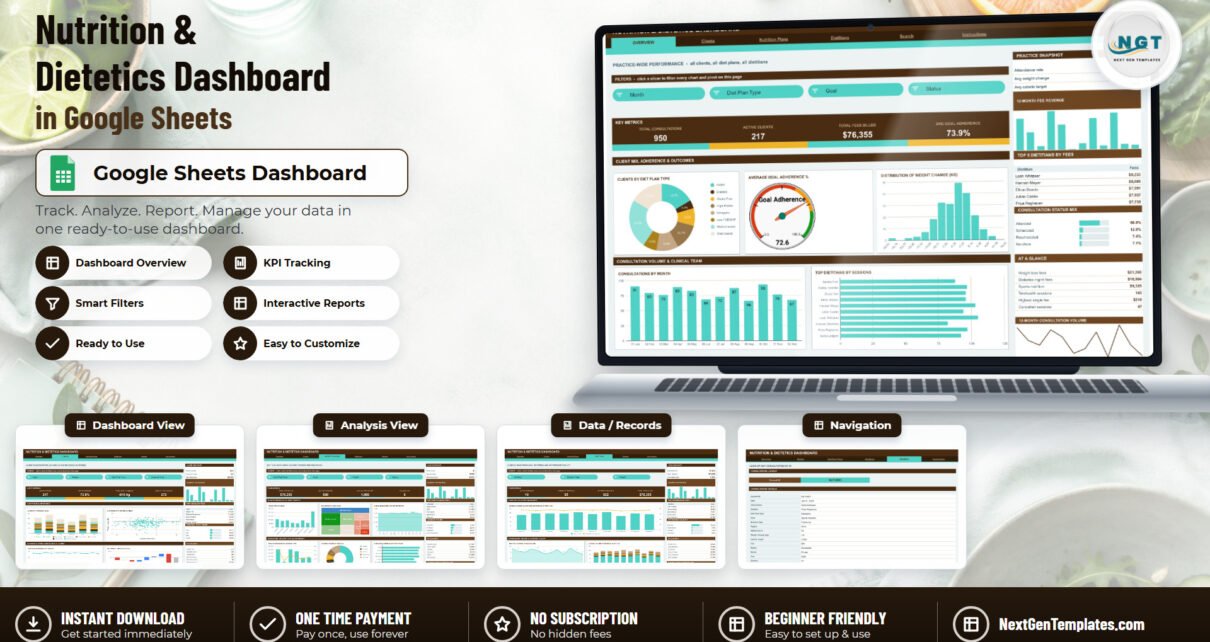
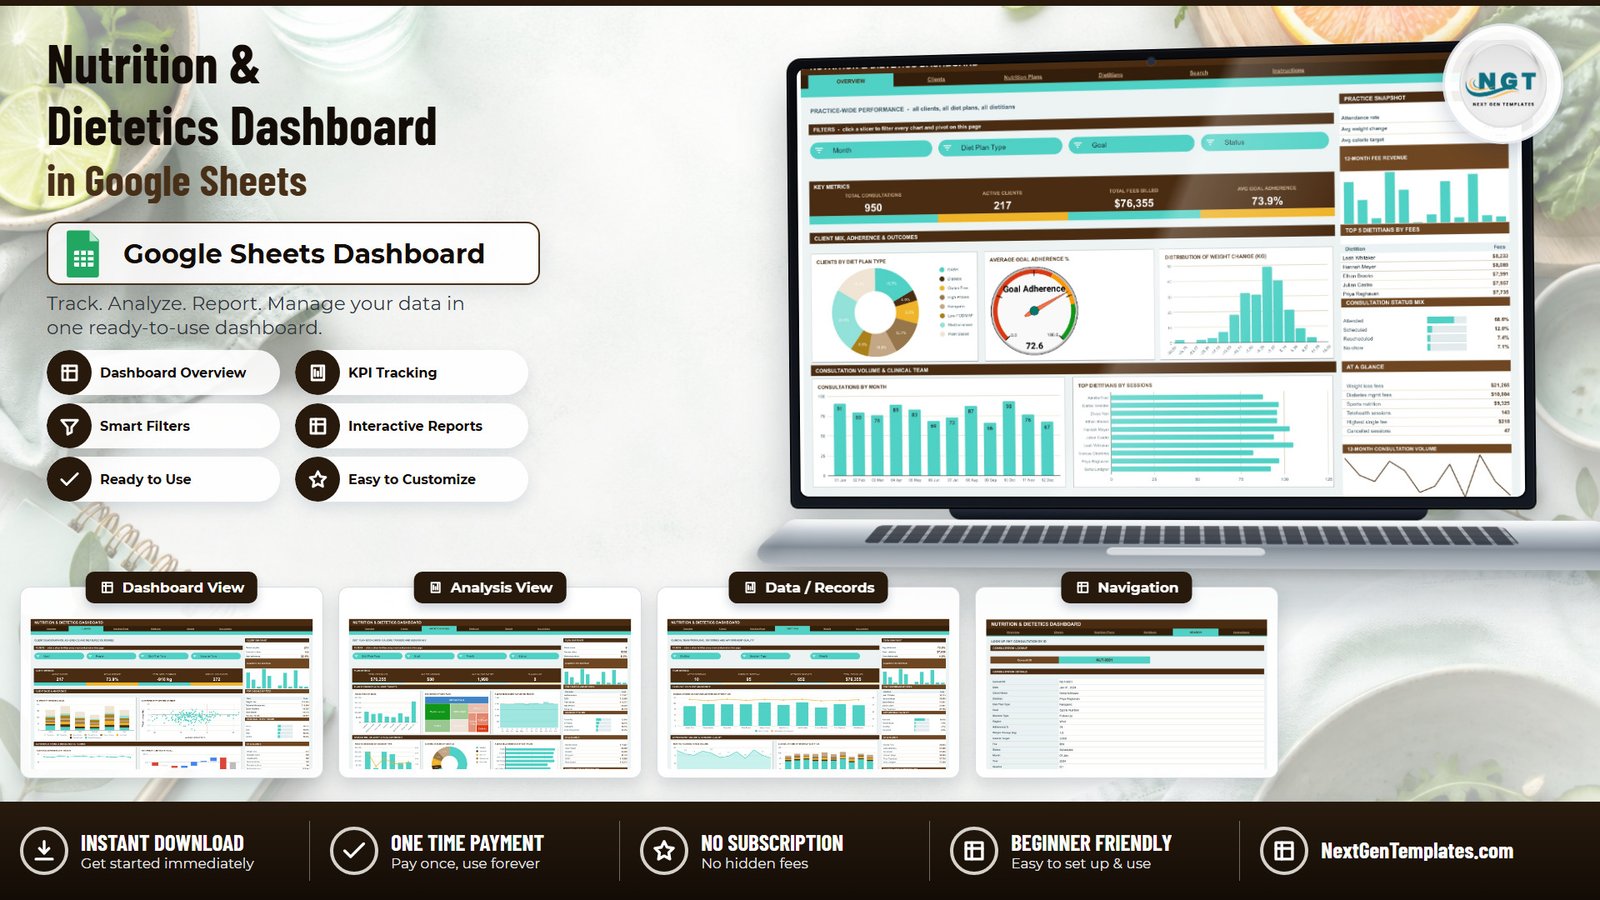
The Nutrition & Dietetics Dashboard in Google Sheets turns a single consultation log into four slicer-driven reporting pages carrying 18 charts, 16 KPI cards and 15 native slicers. It ships loaded with 950 sample consultations across 17 columns spanning 1 January to 27 December 2024 – 217 clients, 10 dietitians, 8 diet plan types, 8 consultation goals, 6 session types and 6 regions. Every chart reads a real Google Sheets pivot table, not a helper formula.
Most nutrition and dietetics practices already keep their consultations in a spreadsheet. What they usually lack is the reporting layer on top of it – the view that says how many sessions actually happened this quarter, which diet plan carries the fee load, and how one practitioner’s no-show rate compares with another’s. That is precisely, and only, what this template does.
Get the Nutrition & Dietetics Dashboard in Google Sheets
Before Anything Else: What This Template Is Not
This matters enough to put above the feature list. The Nutrition & Dietetics Dashboard in Google Sheets is a business reporting template. It is not clinical software. It performs no nutritional assessment, offers no dietary or medical advice, plans no meals, and contains no food or nutrient database. It is not a substitute for a registered dietitian, a physician or any other qualified health professional, and no figure in it should be read as a clinical or health outcome.
The clinical-sounding columns are all inputs, not calculations. Adherence % is a number your practice types in. Weight Change (kg) is a number your practice records. Calorie Target is a number your practice sets. The sheet stores, groups and charts those numbers. It does not derive, validate or interpret any of them.
Key Features of the Nutrition & Dietetics Dashboard in Google Sheets
- Seven tabs – Overview, Clients, Nutrition Plans, Dietitians, Search, Instructions and Data.
- 15 slicers across four pages – Month, Diet Plan Type, Goal, Status, Region, Session Type and Dietitian. Slicers are per page, so each page keeps its own filter state.
- 16 KPI cards, four per page, reading 950 total consultations, 217 active clients, $76,355 total fees billed, 73.9% average goal adherence, -918 kg total weight change, 8 diet plans in use, 10 active dietitians and 652 attended consults on the sample data.
- 18 charts named by metric, using a genuinely varied chart vocabulary: donut, gauge, histogram, column, bar, stacked column, scatter, line, waterfall, treemap, stepped area, combo and area.
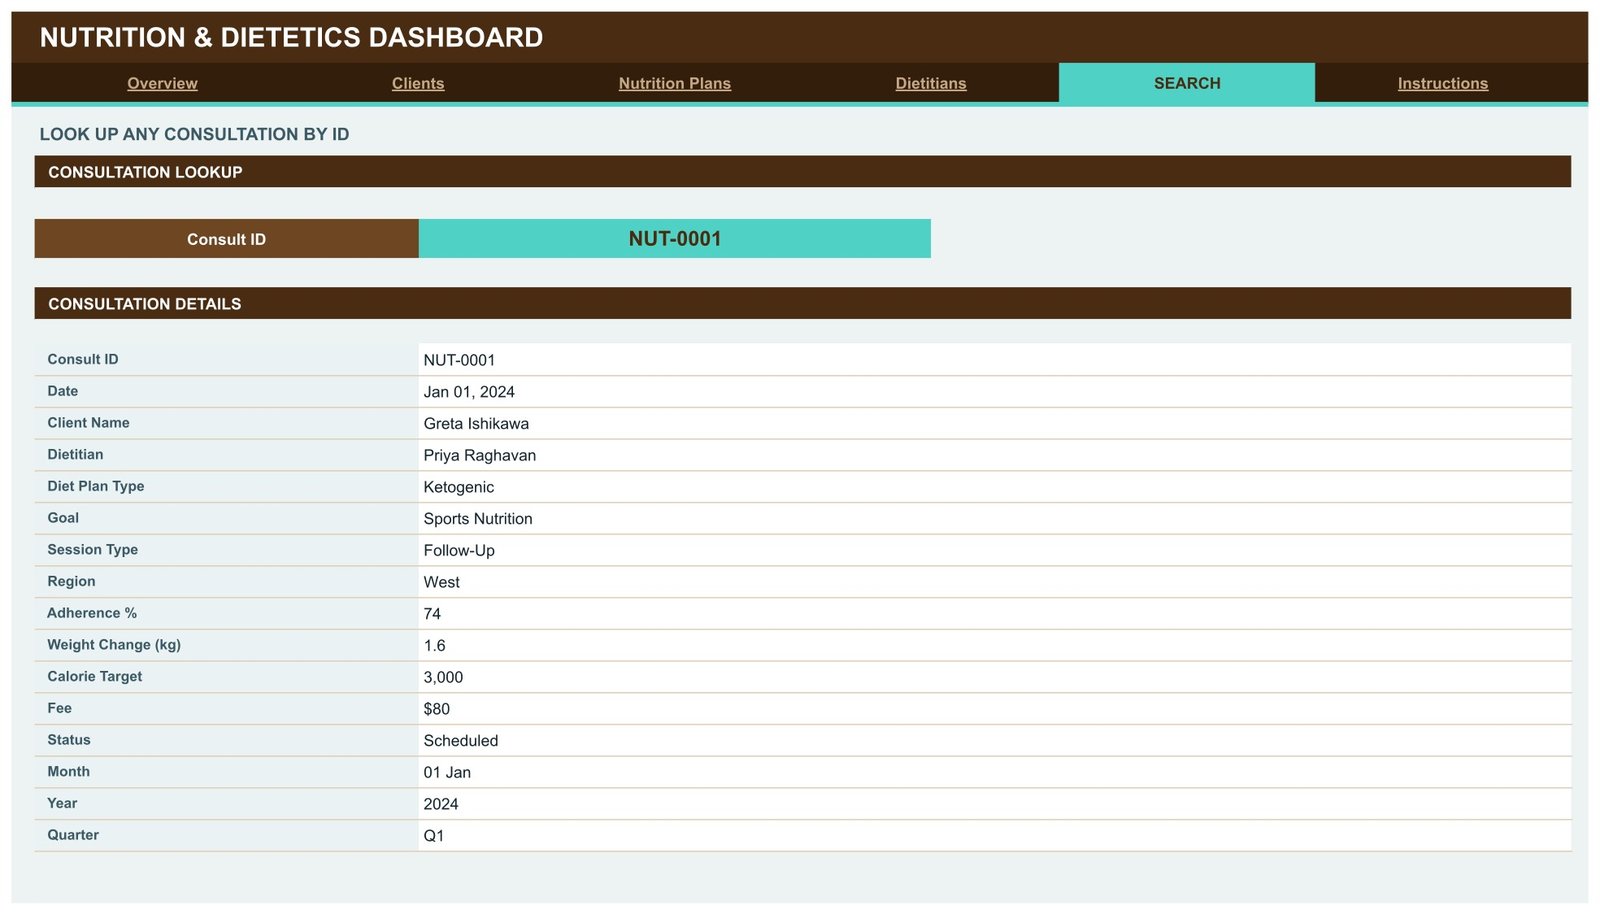
- A consultation lookup page that takes any Consult ID from NUT-0001 to NUT-0950 and returns all 15 fields of that record through INDEX/MATCH.
- Pivot-and-slicer architecture pre-sized to 1,000 data rows, raisable by editing DATA_ROWS in the attached Apps Script.
Dashboard Pages Explanation
Page 1: Overview – Practice-Wide Performance
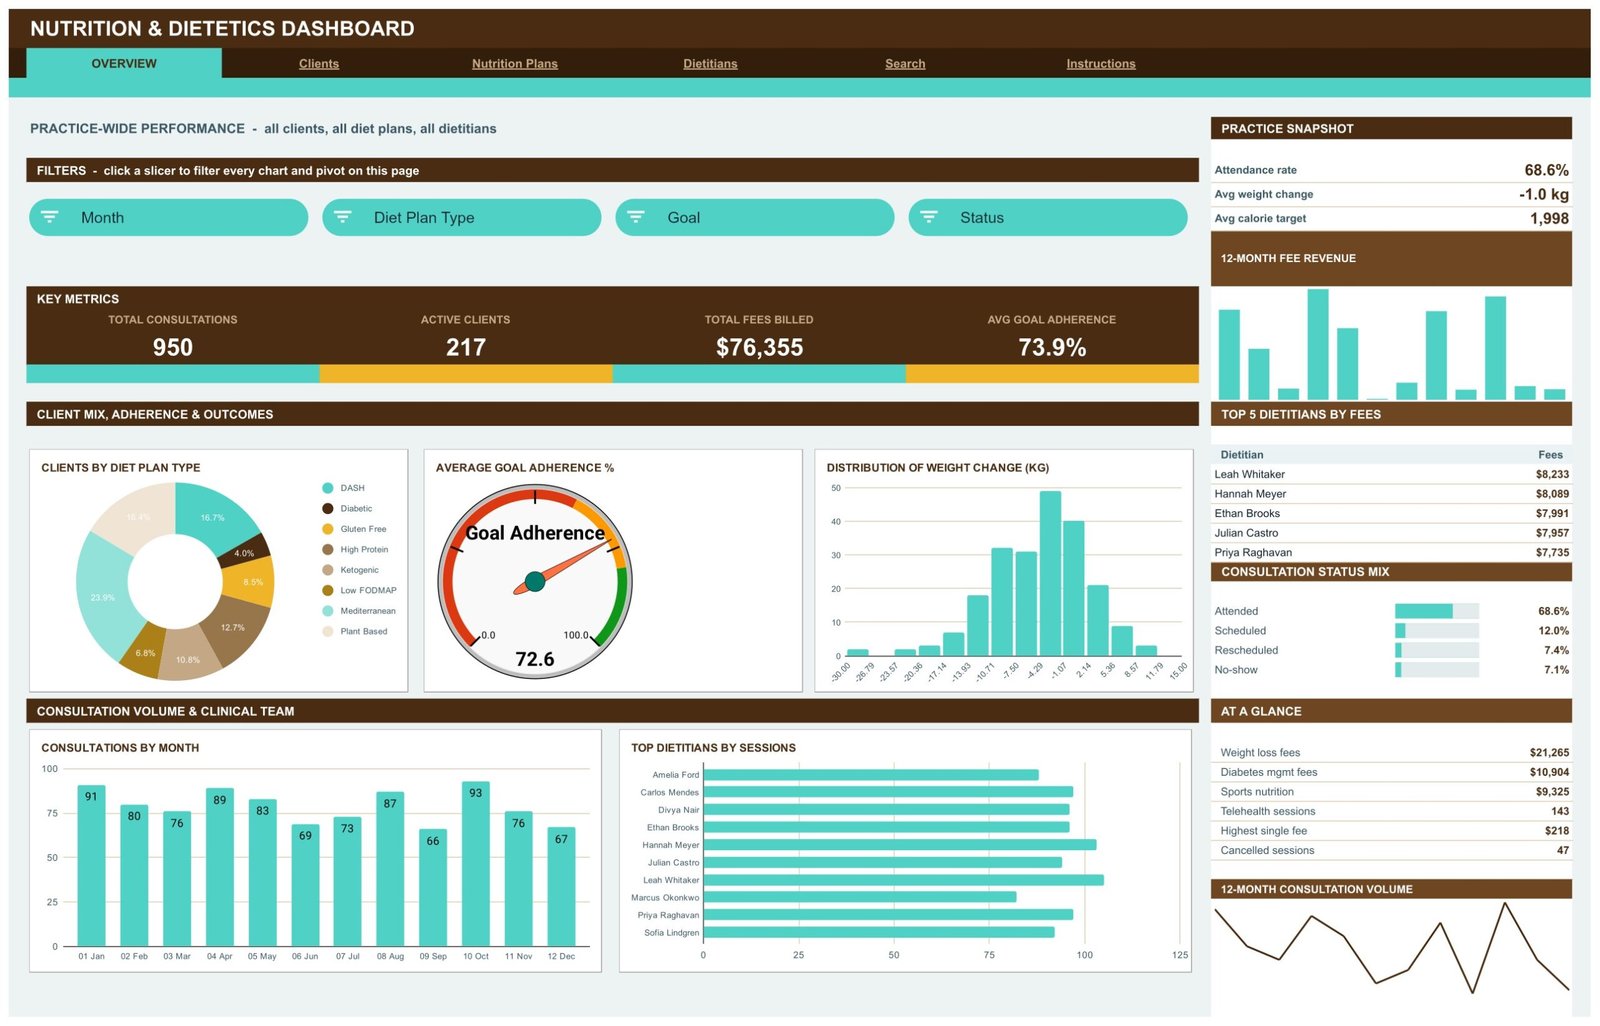
The Overview page answers “how did the whole practice do”. Four KPI cards sit under slicers for Month, Diet Plan Type, Goal and Status: Total Consultations 950, Active Clients 217, Total Fees Billed $76,355 and Avg Goal Adherence 73.9%. The chart band carries Clients by Diet Plan Type, Average Goal Adherence % on a gauge, Distribution of Weight Change (kg) as a histogram, Consultations by Month and Top Dietitians by Sessions. The right rail adds a Practice Snapshot (attendance rate 68.6%, average weight change -1.0 kg, average calorie target 1,998), a 12-month fee revenue sparkline, Top 5 Dietitians by Fees, a Consultation Status Mix and a six-row At a Glance list.
Page 2: Clients – Demographics, Adherence and Recorded Outcomes
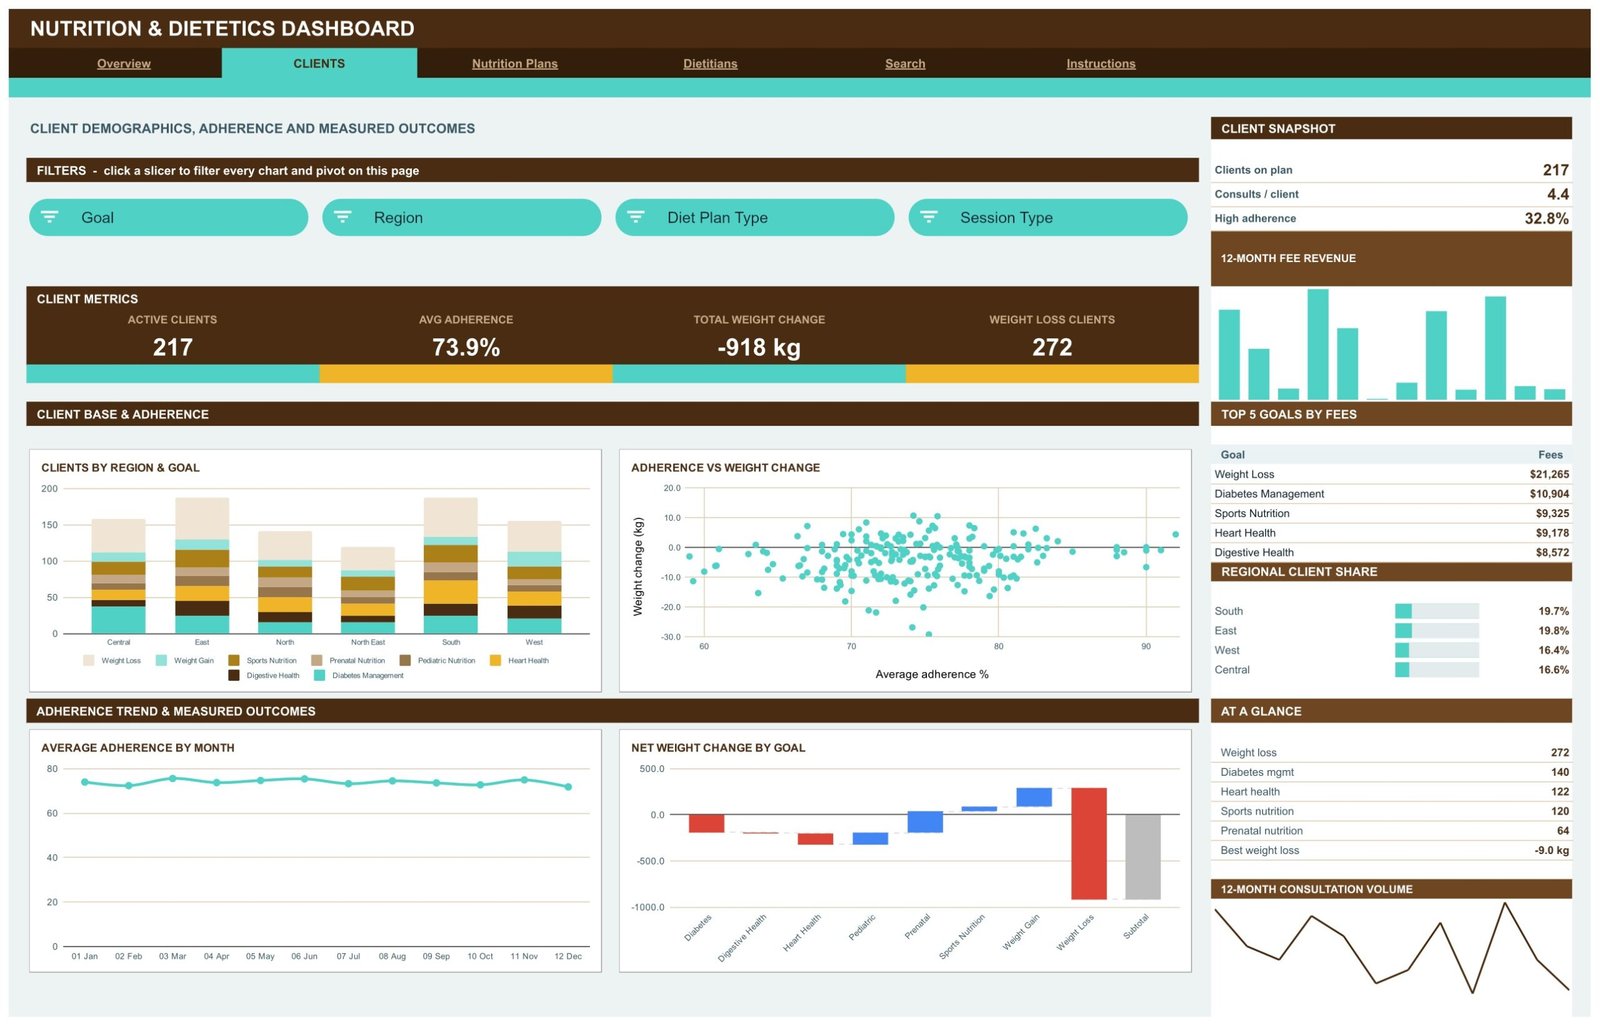
This page groups the same log by who it was for. Cards read Active Clients 217, Avg Adherence 73.9%, Total Weight Change -918 kg and Weight Loss Consultations 272, with slicers for Goal, Region, Diet Plan Type and Session Type. Charts include Clients by Region & Goal as a stacked column, Adherence vs Weight Change as a scatter, Average Adherence by Month as a line, and Net Weight Change by Goal as a waterfall. The rail reports 4.4 consults per client, a 32.8% high-adherence share, Top 5 Goals by Fees led by Weight Loss at $21,265, and a Regional Client Share panel.
Page 3: Nutrition Plans – Plan Economics, Calorie Targets and Session Mix
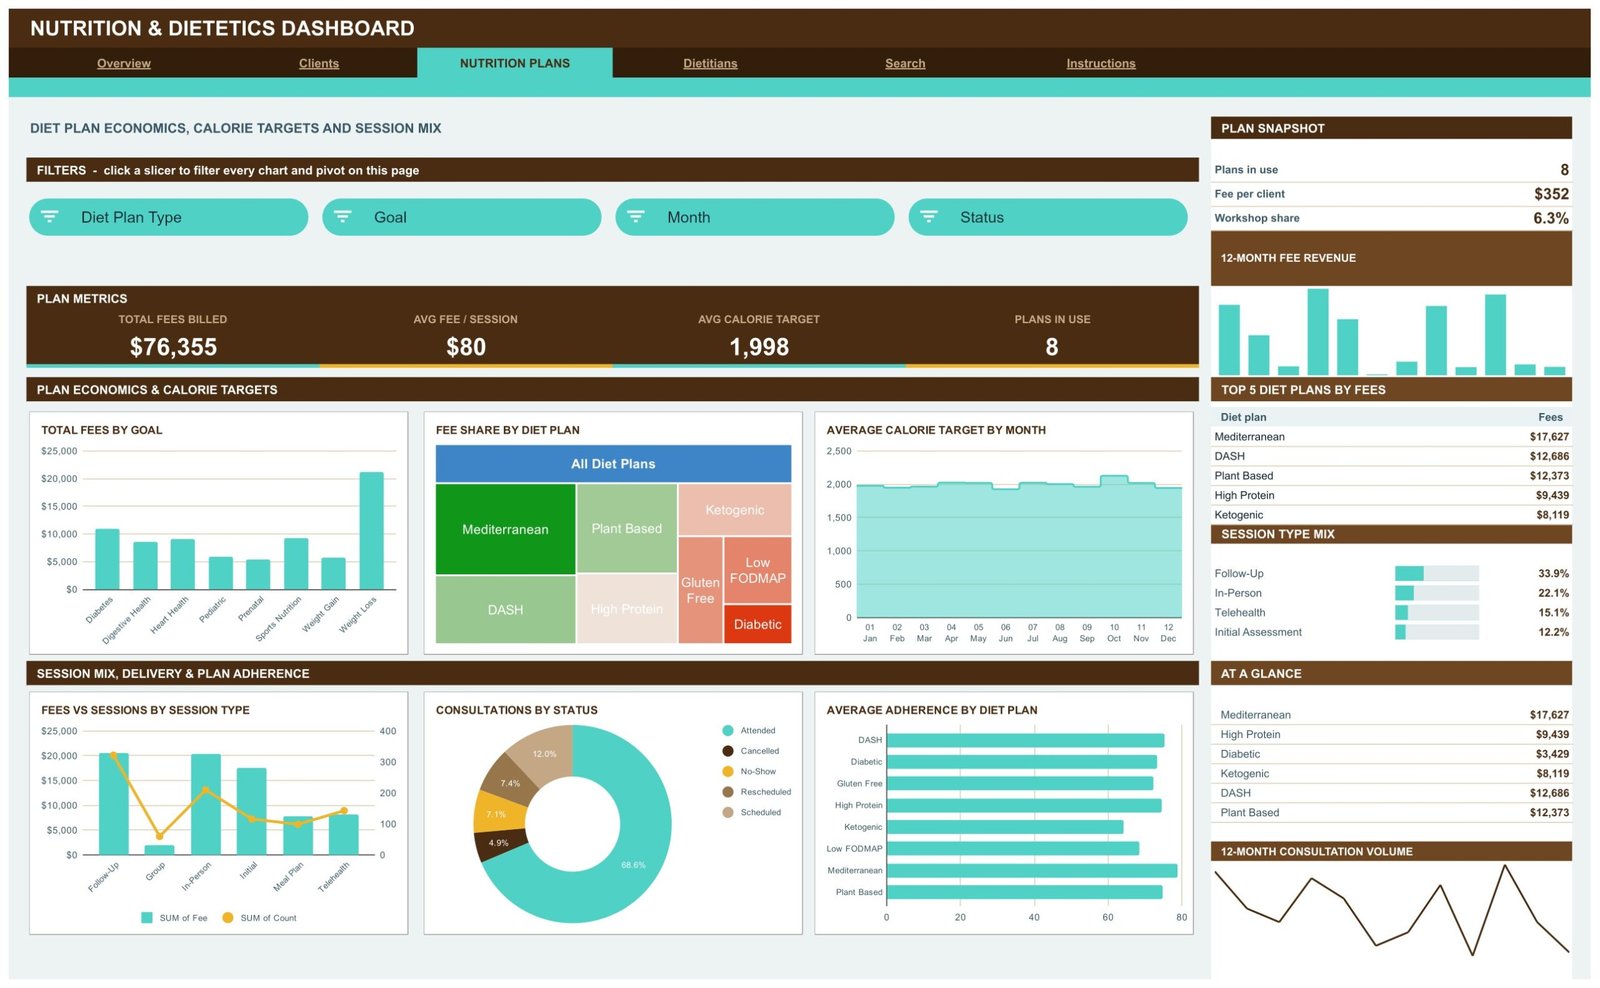
The commercial page. Cards read Total Fees Billed $76,355, Avg Fee / Session $80, Avg Calorie Target 1,998 and Plans in Use 8. Charts: Total Fees by Goal, Fee Share by Diet Plan as a treemap, Average Calorie Target by Month as a stepped area, Fees vs Sessions by Session Type as a combo, Consultations by Status as a donut, and Average Adherence by Diet Plan as a bar. On the sample data Mediterranean carries $17,627 of fees against DASH at $12,686, Plant Based at $12,373 and Diabetic at just $3,429 – the kind of spread that changes how a practice schedules its week.
Page 4: Dietitians – Team Workload and Appointment Quality
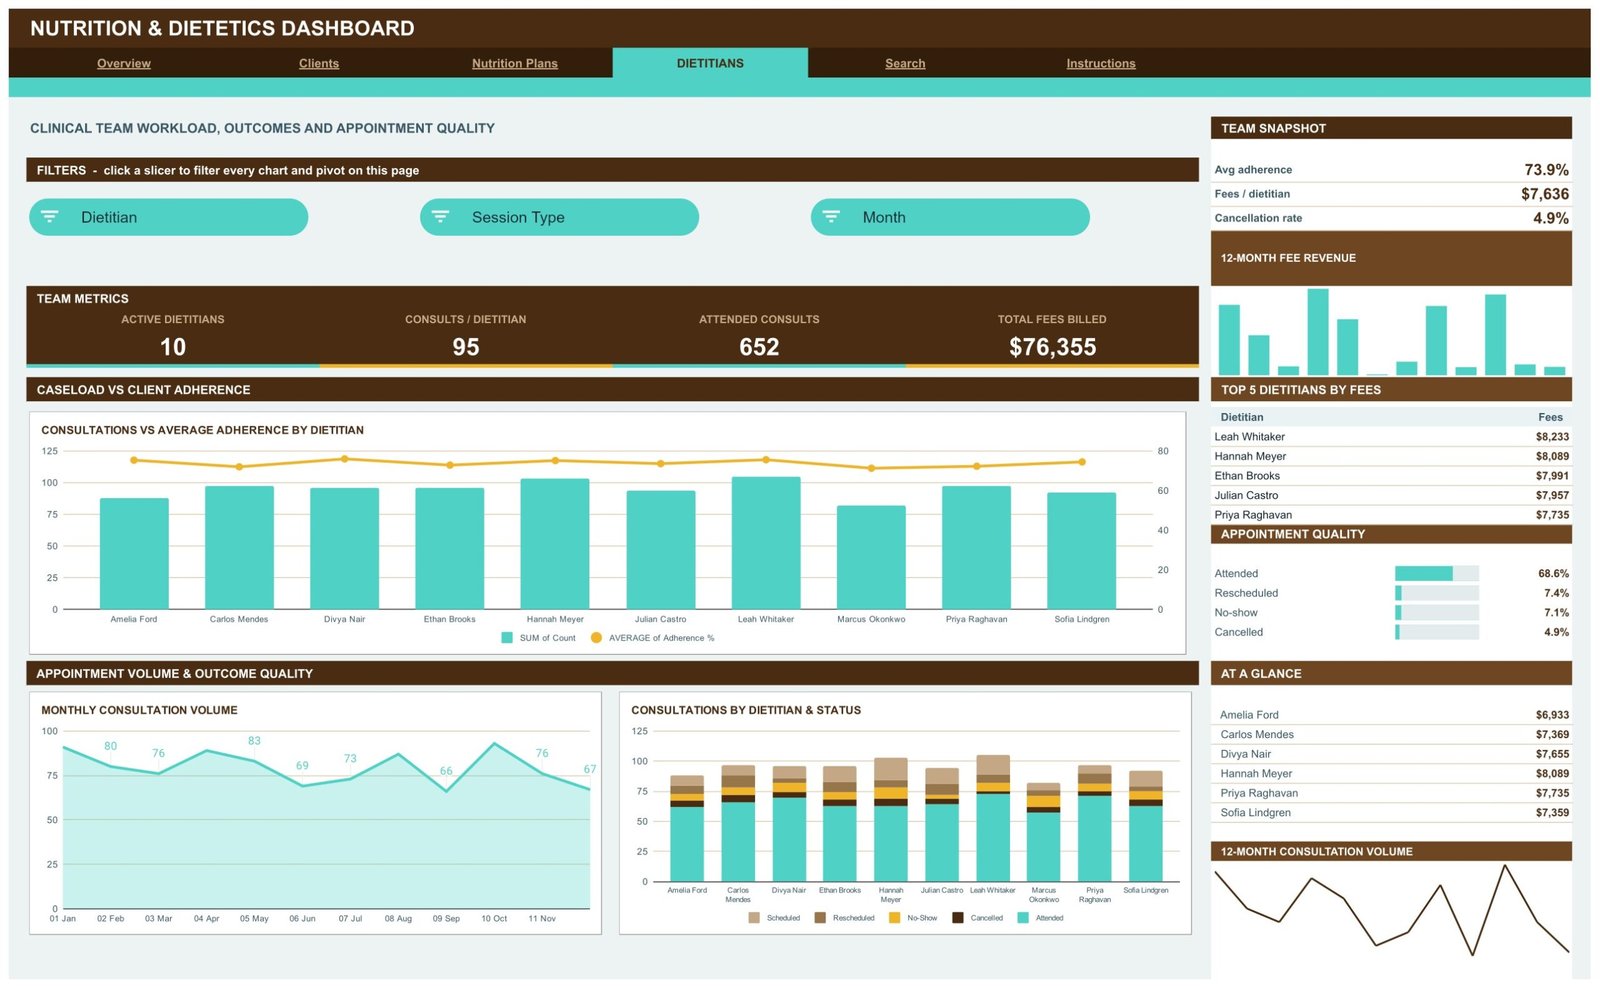
Three slicers here rather than four – Dietitian, Session Type and Month. Cards read Active Dietitians 10, Consults / Dietitian 95, Attended Consults 652 and Total Fees Billed $76,355. Charts: Consultations vs Average Adherence by Dietitian as a combo, Monthly Consultation Volume as an area, and Consultations by Dietitian & Status as a stacked column. The Appointment Quality panel splits the year into Attended 68.6%, Rescheduled 7.4%, No-show 7.1% and Cancelled 4.9%.
Page 5: Search – Consultation Lookup
One input cell, 15 returned fields. Type a Consult ID and the page returns the date, client, dietitian, diet plan type, goal, session type, region, adherence, weight change, calorie target, fee, status, month, year and quarter for that single consultation.
Pages 6 and 7: Instructions and Data
The Instructions tab is a ten-step user guide that explains the pivot architecture, how to clear a slicer, which panels are slicer-aware and which are not, how to swap in your own consultations, and how to raise the row limit. The Data tab is the log itself: Consult ID, Date, Client Name, Dietitian, Diet Plan Type, Goal, Session Type, Region, Adherence %, Weight Change (kg), Calorie Target, Fee, Status, plus four helper columns (Month, Year, Quarter, Count) that feed the pivots.
What the Template Holds About Your Clients
Because this is a health-adjacent topic, it is worth stating the data model plainly rather than in a marketing sentence. The Data tab has a Client Name column, and the sample data fills it with 217 personal names. Each row also carries an Adherence %, a Weight Change in kilograms and a Calorie Target. This template does hold client-level rows, and the Search page will display back whatever you put in that cell.
What the dashboard does with that column is narrow: it counts distinct values to produce the Active Clients figure of 217, and groups by them. A case reference or client code works exactly as well as a real name – every KPI, chart and pivot behaves identically either way. If you would rather not put client names in a spreadsheet, nothing in the template requires you to.
Checked column by column, the Data tab has no date of birth, no address, no phone or email, no diagnosis, no medication, no allergy field, no lab value and no clinical note. And because it is an ordinary Google Sheet, its privacy is your Google sharing settings and nothing more – there is no encryption, no audit trail, no in-file access roles, and no HIPAA, GDPR or accreditation standing of any kind.
Nutrition & Dietetics Dashboard in Google Sheets vs. Microsoft Excel Dashboard vs. Practice BI Suite – Feature Comparison
| Feature | Nutrition & Dietetics Dashboard in Google Sheets | Microsoft Excel Dashboard | Practice BI suite (Tableau / Qlik) |
|---|---|---|---|
| Cost | $9.99 one-time ✅ | $17.99 one-time | $70-$150 / user / month |
| Platform | Google Sheets – browser, nothing to install ✅ | Microsoft Excel desktop | Desktop app plus a server or cloud tenant |
| Setup time | Under 10 minutes – copy, paste, done ✅ | Under 15 minutes | Days to weeks with a data model |
| Real-time team collaboration | Native – several dietitians in one file ✅ | Only via OneDrive co-authoring | Yes, per licensed seat |
| Mobile access | Google Sheets app, free ✅ | Excel mobile, limited pivots | Viewer app, paid seat required |
| Customisable fields | Edit the 17 Data columns and re-point the pivots ✅ | Same, via Excel pivots | Yes, needs modelling skills |
| Share with a link | One Google link, view or edit ✅ | File attachment or OneDrive link | Portal login per viewer |
| Row capacity out of the box | 1,000 consultations, raisable in the script | Practically unlimited | Millions ✅ |
| Year-1 cost at 5 users | $9.99 total ✅ | $17.99 total | $4,200-$9,000 |
For a practice that wants clear consultation, adherence and fee reporting without a per-seat BI licence, the Nutrition & Dietetics Dashboard in Google Sheets sits in the sweet spot.
Who Should Use This Template
Perfect for:
- Independent dietitians and nutritionists who already log consultations in a spreadsheet
- Small nutrition clinics with 2-15 practitioners needing shared caseload and fee reporting
- Practice managers preparing a monthly or quarterly review of volume, attendance and fee mix
- Wellness and corporate-nutrition programmes reporting session counts and plan mix to a client organisation
- Anyone who wants pivot-and-slicer reporting in Google Sheets without building the pivots by hand
Not a fit if:
- You need clinical, diagnostic or nutritional-assessment functionality – the template provides none
- You want meal planning, recipe building or nutrient analysis – there is no food database in it
- You need a live connection to an EHR, practice-management system, booking tool or payment processor
- You need HIPAA or GDPR controls, an audit trail, or per-user permissions inside the file
- You need multi-year trend analysis out of the box – the sample covers one year with no year-over-year view
Real-World Use Cases
Amara runs a two-dietitian nutrition clinic. Every consultation goes into the Data tab, and each Friday she opens the Dietitians page to compare attended consults against no-shows per practitioner. Seeing a 7.1% no-show rate on the Appointment Quality panel prompted her to add a reminder call before first appointments – and that single number is now the one she watches month to month.
Ben is a practice manager at a five-person wellness centre. He uses the Nutrition Plans page to see which diet plan types actually carry the fee load rather than which ones feel busiest. Mediterranean at $17,627 against Diabetic at $3,429 changed how the centre allocated its group-workshop slots, which sit at 6.3% of all sessions.
Priya is a freelance dietitian working across three regions. She deliberately puts client codes rather than names in the Client Name column, filters the Clients page by Region, and exports the quarterly view for her accountant – with no practice-management subscription and no per-seat licence to renew.
Advantages of the Nutrition & Dietetics Dashboard in Google Sheets
The clearest advantage is cost shape. A practice BI seat runs $70-$150 per user per month; this is $9.99 once, for as many practitioners as your Google file allows. The second is speed to value – because every chart already points at a pivot, replacing the sample rows is genuinely the whole setup, and nothing needs modelling first.
The third is that it runs where a small practice already works. Google Sheets needs no install, opens on a phone, and shares with one link, which matters when the person who needs the quarterly number is not the person who keeps the log. Google’s own documentation on filtering with slicers covers how the filter controls behave if you want to extend them.
Opportunities for Improvement
A fair review of this template has to include what it does not do well.
- The KPI cards and the At a Glance list ignore slicers. They use SUMIFS and COUNTIFS across the whole Data sheet and always show unfiltered totals. The Instructions tab says so plainly, but it still surprises people who expect a card to move when they click a filter. Only charts, pivots and the Top 5 panels are slicer-aware.
- Total Fees Billed is scheduled fees, not collected revenue. The $76,355 includes 114 Scheduled sessions that have not happened yet, 67 No-Shows and 70 Rescheduled rows. Only the 47 Cancelled rows carry a zero fee, so the headline overstates money actually earned.
- Several panels labelled “Clients” count consultations. The Clients by Diet Plan Type donut, the Clients by Region & Goal chart and the Weight Loss Clients card (272) all count rows rather than distinct people. The Active Clients card (217) is the only true distinct-client figure.
- The Overview gauge reads 72.6 while the adherence KPI card on the same page reads 73.9%. The gauge averages the monthly pivot averages; the card averages all 950 rows. Both are correct arithmetic on different groupings, but seeing two numbers for one idea is confusing.
- Average adherence includes rows for sessions that never happened. Cancelled, No-Show and Scheduled rows all carry an Adherence % and are folded into the 73.9%; the attended-only average is 73.6.
- No date-range picker and no year-over-year view. Filtering by time means the Month slicer, present on three of the four pages.
- Cosmetic: the treemap and waterfall render in Google’s default palette instead of the bronze-and-teal theme, and the Monthly Consultation Volume chart on the Dietitians page stops labelling its x-axis at November even though all twelve months are plotted.
Best Practices
- Read the Instructions tab before you touch anything – it tells you which panels filter and which do not, which saves the most common misreading.
- Decide your Client Name convention on day one. Codes are safer than names and cost you nothing in the reporting.
- Fill the four helper columns (Month, Year, Quarter, Count) on every new row or the pivots will not group it.
- If you want a true revenue figure, add a status filter to the pivot behind the fee chart, or keep a separate collected-fee column.
- Keep the 17 headers exactly as shipped. Renaming a column silently breaks the pivots that reference it.
- Raise DATA_ROWS in the Apps Script before you approach row 1001, not after.
Explore Relevant Templates
The same reporting exists on two other platforms if your practice does not live in Google Sheets: the Nutrition & Dietetics Dashboard in Excel and the Nutrition & Dietetics Dashboard in Power BI. If you want a month-picker scorecard with traffic lights instead of an analytical dashboard, the Nutrition & Dietetics KPI Dashboard in Excel is a separate template, not a duplicate of this one.
On the client side, our Calorie & Macro Tracker in Google Sheets and Meal Planner & Grocery List in Google Sheets are personal record-keeping tools your clients can run themselves, and the Weight Loss Tracker in Google Sheets covers individual progress logging. For practice administration, the Doctor Appointments & Medical History Tracker in Google Sheets and the Lab Results & Health Metrics Tracker in Google Sheets pair naturally with this dashboard.
If pivot-based reporting like this is new to you, the Excel Pivot Tables & Dashboards course on NextGenTemplates Academy teaches the same ideas with downloadable practice files.
Get the Nutrition & Dietetics Dashboard in Google Sheets
Frequently Asked Questions
Is the Nutrition & Dietetics Dashboard in Google Sheets a clinical tool?
No. The Nutrition & Dietetics Dashboard in Google Sheets is a business reporting template for a practice. It makes no clinical, diagnostic or nutritional assessment, gives no dietary advice, plans no meals and is not a substitute for a registered dietitian or any other qualified health professional.
Does it hold client names or health information?
The Data tab includes a Client Name column with 217 sample names, plus per-consultation Adherence %, Weight Change and Calorie Target values. It has no date of birth, address, contact detail, diagnosis, medication, allergy or lab value column. Client codes work in place of names with no loss of function.
Does it connect to my practice-management system?
No. The Nutrition & Dietetics Dashboard in Google Sheets is a static Google Sheet. It has no live connection to any EHR, practice-management platform, booking tool, payment processor or nutrient database. You paste your own consultation log into the Data tab and the pivots redraw.
How many consultations can it hold?
Pivots, slicers and formulas are pre-sized to 1,000 rows out of the box, which covers roughly one year for a small practice. To go beyond that, open the attached Apps Script, raise the DATA_ROWS constant and re-run main() – the file rebuilds at the new size.
How long does setup take?
Under 10 minutes. Open the PDF included in your download, click the Google Sheets link inside it to copy the file into your own Drive, then paste your consultations over the 950 sample rows keeping all 17 column headers unchanged. Every chart and pivot updates automatically.
How does the Nutrition & Dietetics Dashboard in Google Sheets compare to a paid BI suite?
Tableau or Qlik costs $70-$150 per user per month and needs a data model built before you see a chart. This template is $9.99 once, runs in a browser and is ready in minutes – trading live connectors and unlimited rows for cost and speed.
Can several dietitians use it at once?
Yes. It is a normal Google Sheet, so any number of practitioners can open and edit it with no extra licence. Note that slicer selections are shared in a live file, so two people filtering the same page at the same time will see each other’s filter.
About the Author
Built by PK – Microsoft Certified Professional with 15+ years of Excel, Google Sheets and Power BI experience. Founder of NextGenTemplates, reaching 300K+ subscribers across YouTube channels. Every template is hand-built and tested before release.
Conclusion
If your nutrition or dietetics practice already keeps its consultations in a spreadsheet, this template is the reporting layer that was missing – 18 charts and 16 KPI cards over a log you already maintain, with a candid Instructions tab that tells you where its edges are. It will not assess a client, plan a meal or replace a practice-management system, and it does not pretend to.
Instant download · One-time payment · No subscription
Last updated: September 2026