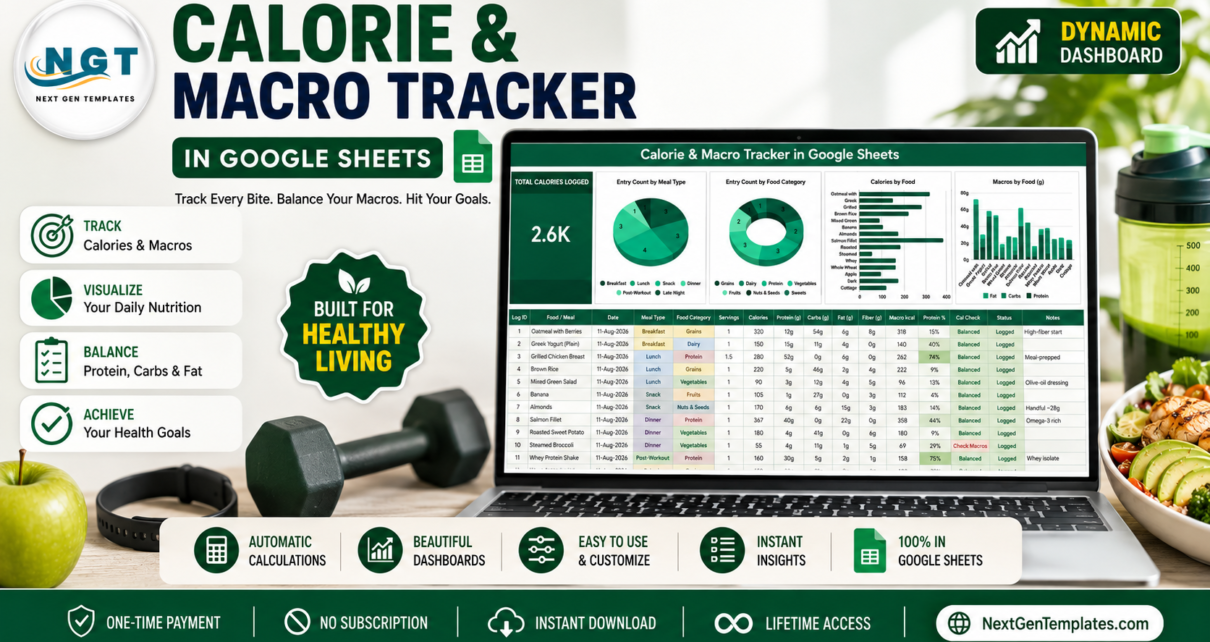
Most food logging fails for a boring reason: the tool is heavier than the habit. You open an app, hunt through a database, accept a serving size you did not measure, and three days later you stop. The Calorie & Macro Tracker in Google Sheets takes the opposite approach – one sheet, 16 columns, four charts, and no lookup step between you and the row you are typing. You supply the numbers from the label or your own source; the sheet handles the arithmetic, the cross-check and the visuals.
Everything lives on a single page. Fifteen worked sample rows show the format, four formula columns fill themselves, three dropdown lists read from a List tab with room for 500 values, and all four charts read rows 16 to 1000 directly, so entry 200 appears without anyone re-ranging a chart.
Before anything else: this template is a logging and charting tool. It is not medical or nutritional advice, it contains no nutrition database, and it does not set or recommend calorie or macro targets. Any target is yours to decide, with a qualified professional where that matters.
Get the Calorie & Macro Tracker in Google Sheets
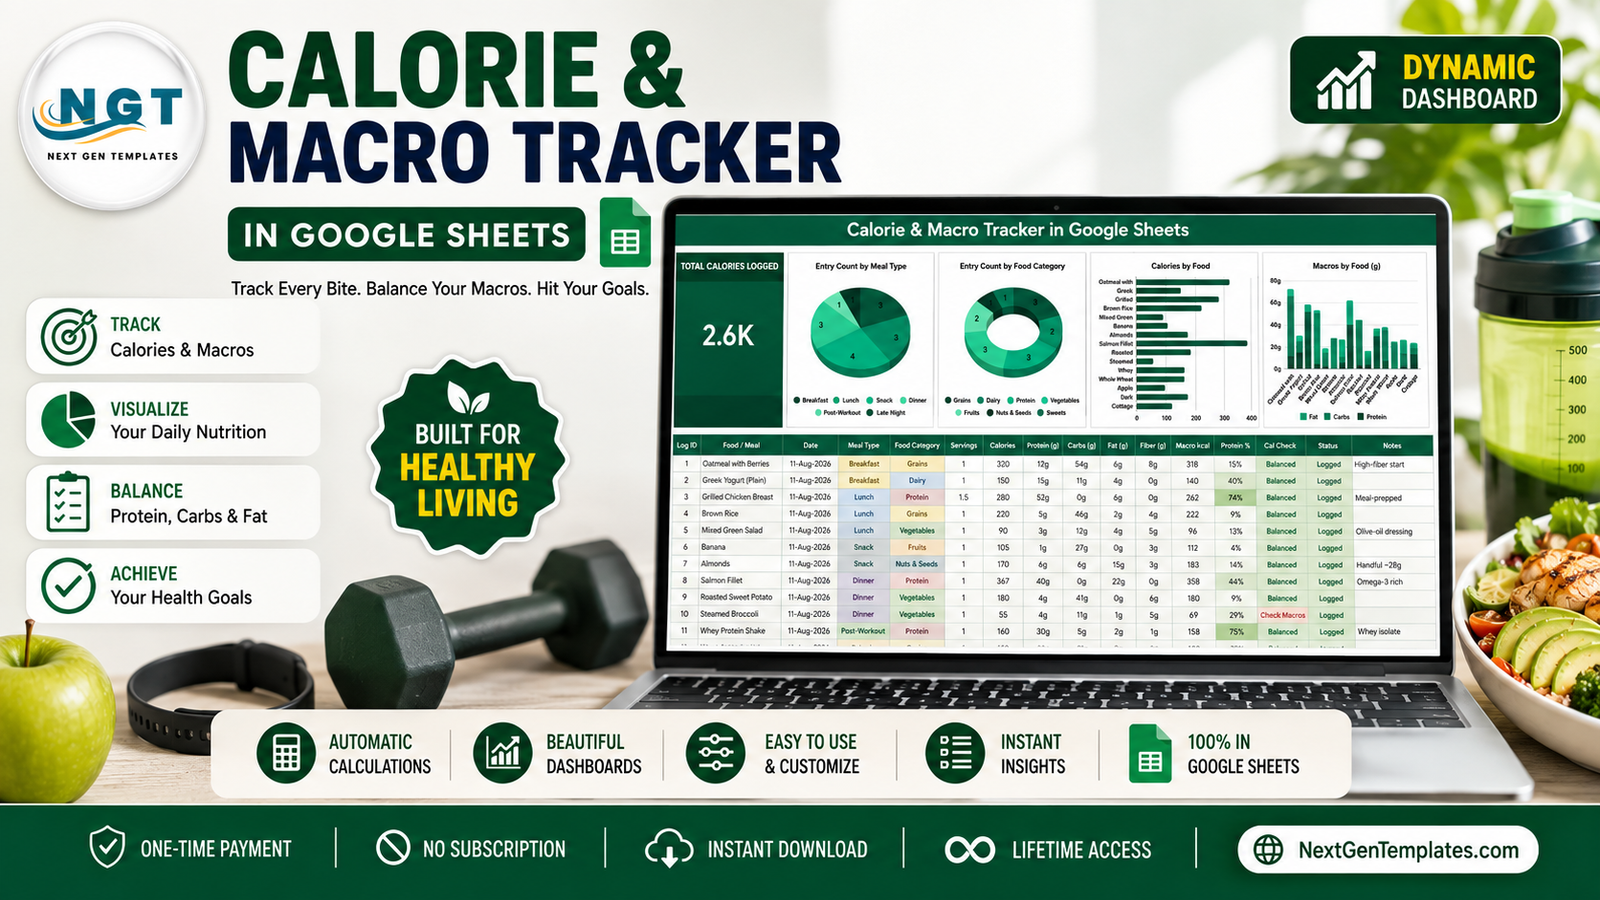
Key Features of the Calorie & Macro Tracker in Google Sheets
- Total Calories Logged card. One large KPI card summing the Calories column across every logged row. The sample data reads 2.6K.
- Four charts, all live. Entry Count by Meal Type, Entry Count by Food Category, Calories by Food, and Macros by Food (g).
- Macro kcal. A formula column recomputing calories from your macros as protein x 4 + carbs x 4 + fat x 9.
- Cal Check. Compares that figure against the Calories you typed and prints “Check Macros” when the two drift more than 15% apart. Everything else reads “Balanced”.
- Protein %. The share of an entry’s calories coming from protein, on a green scale that deepens as the share rises.
- Three dropdown lists. Meal Type, Food Category and Status pull from the List tab across rows 2 to 500.
- No helper tables. The charts use Google Sheets’ built-in Aggregate option against the data columns, so there is nothing hidden off to the right to maintain.
Inside the Tracker – Page by Page
Page 1 – The tracker
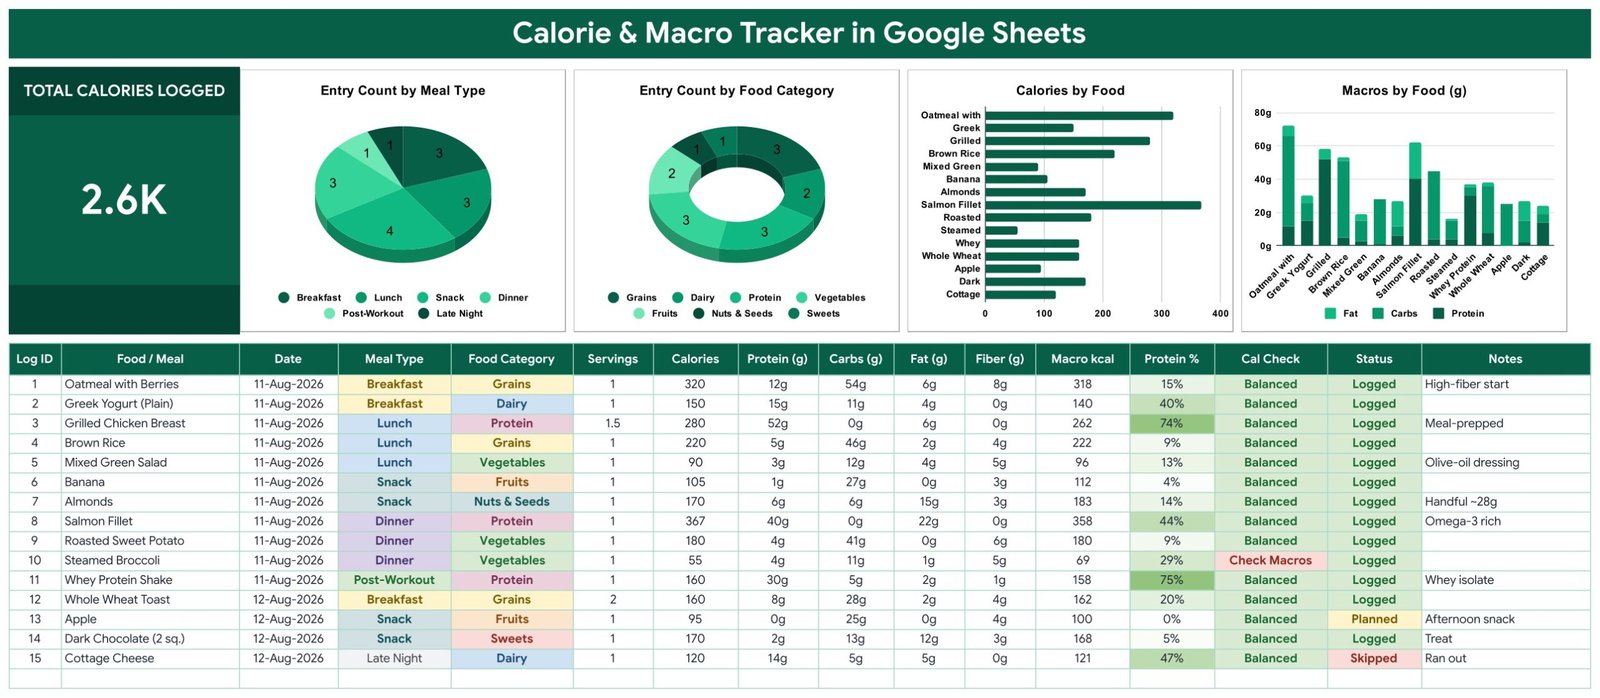
A dark green title banner, the Total Calories Logged card on the left, the four charts across the top, and the log table beneath. The table runs 16 columns: Log ID, Food / Meal, Date, Meal Type, Food Category, Servings, Calories, Protein (g), Carbs (g), Fat (g), Fiber (g), Macro kcal, Protein %, Cal Check, Status and Notes.
Meal Type offers Breakfast, Lunch, Snack, Dinner, Post-Workout and Late Night. Food Category offers Grains, Dairy, Protein, Vegetables, Fruits, Nuts & Seeds and Sweets. Status is Logged, Planned or Skipped – which is what makes the sheet honest: a planned meal you skipped stays visible instead of quietly disappearing.
The 15 sample rows cover a day and a half – oatmeal with berries, Greek yogurt, grilled chicken breast at 1.5 servings, brown rice, a mixed green salad, banana, almonds, salmon fillet, roasted sweet potato, steamed broccoli, a whey protein shake, whole wheat toast, apple, dark chocolate and cottage cheese. One of them, the steamed broccoli row, is deliberately flagged “Check Macros”, so you can see the cross-check working before you type anything of your own.
Page 2 – How to Use
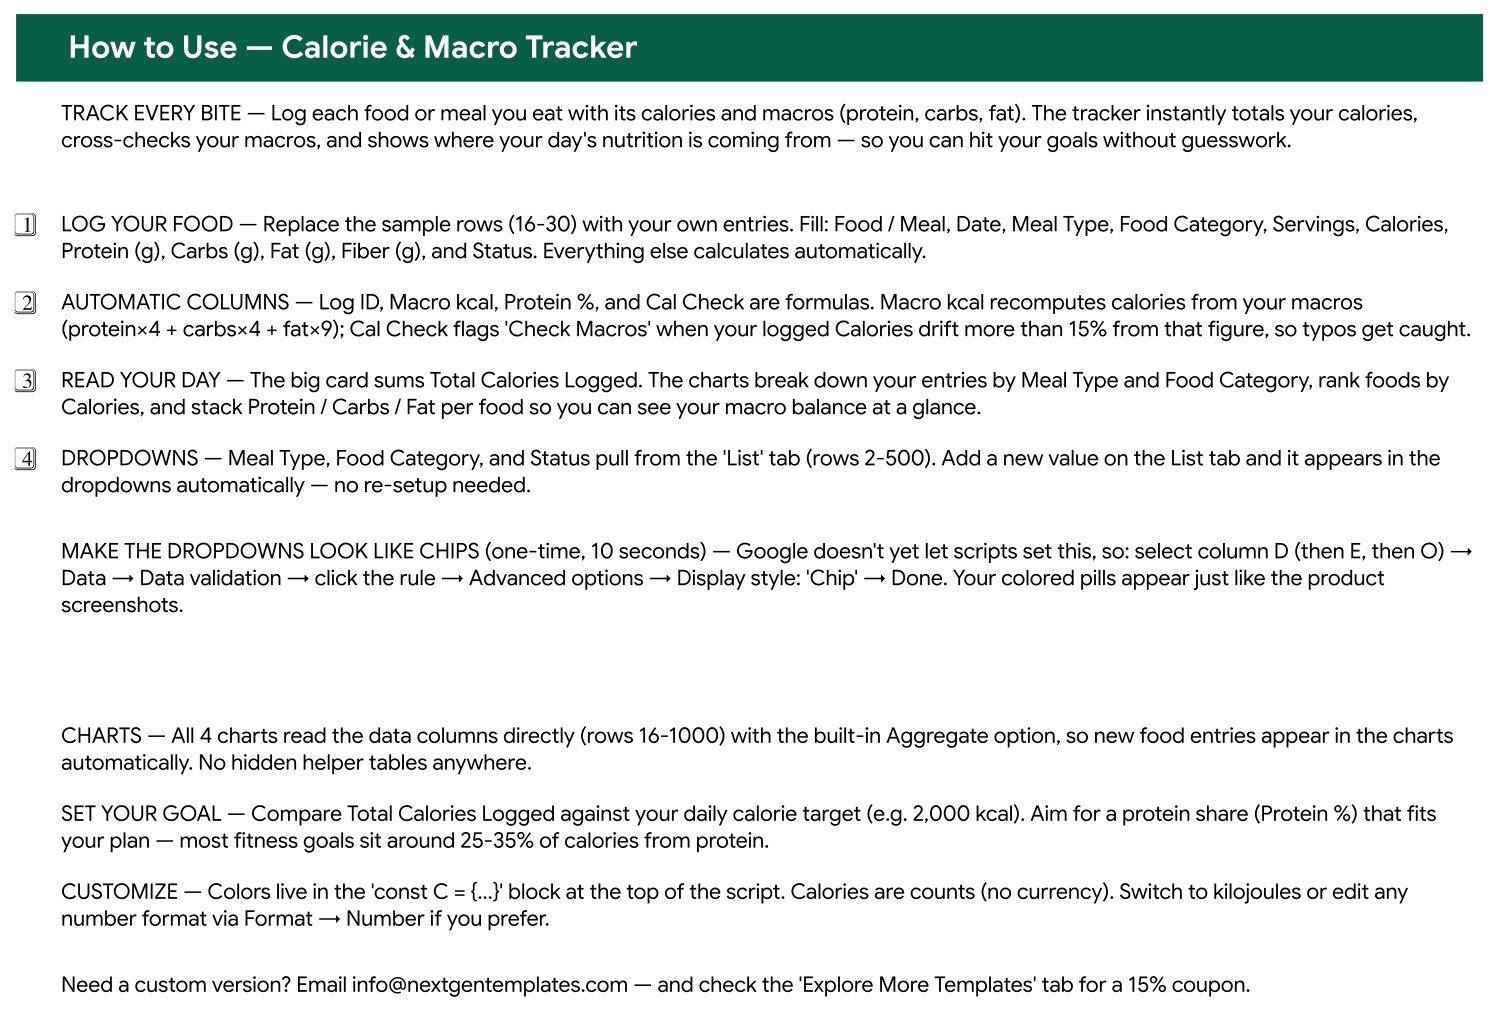
A written walkthrough shipped inside the file. It separates the columns you fill from the four that calculate themselves, states the Macro kcal formula and the 15% Cal Check threshold in plain language, points at the List tab behind each dropdown, and explains the one-time Data validation step that turns those dropdowns into the coloured chips visible in the screenshots. It ends with where the colour constants sit if you want to re-theme the sheet.
Page 3 – Explore More Templates
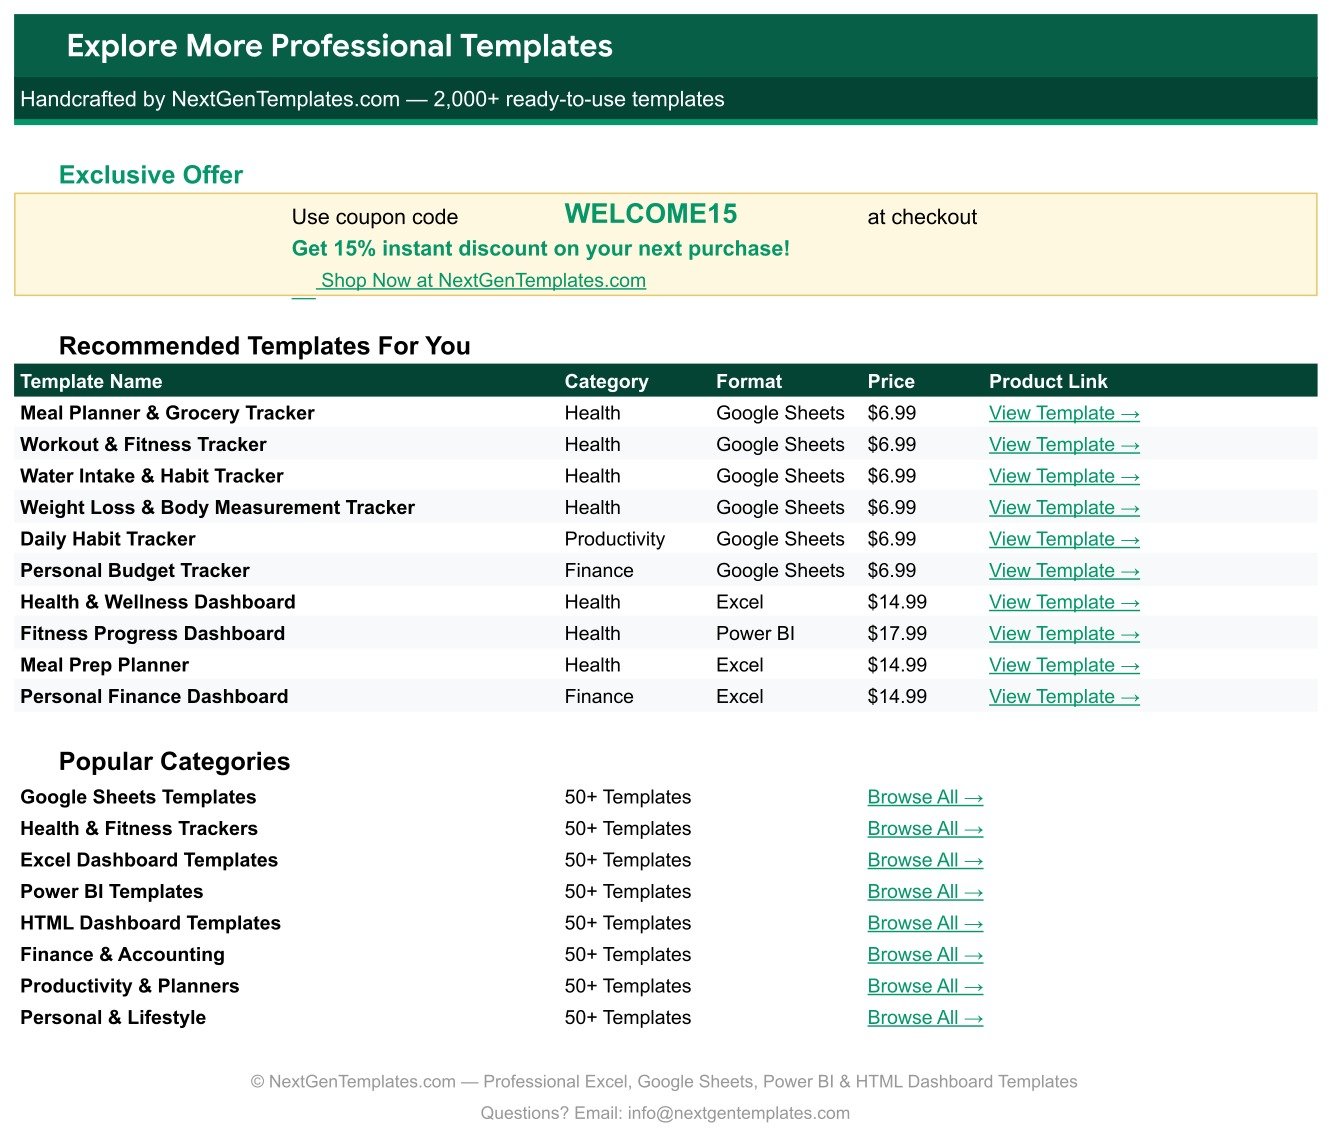
A closing sheet carrying a WELCOME15 coupon for 15% off a future purchase, a table of recommended health, fitness and finance templates with prices, and links into the main template categories.
Calorie & Macro Tracker in Google Sheets vs. an Excel Log vs. a Paid Nutrition App – Feature Comparison
| This tracker (Google Sheets) | A do-it-yourself Excel log | Paid nutrition app, premium tier | |
|---|---|---|---|
| Cost | One payment, 6.99 on sale | Free if you build it yourself | Roughly 20 per month |
| Platform | Google Sheets, any browser | Desktop Excel | Vendor’s phone app |
| Setup time | Copy, clear samples – minutes | Hours of formula and chart work | Signup plus subscription |
| Real-time collaboration | Native Sheets sharing | OneDrive co-authoring only | Usually single-account |
| Mobile access | Sheets mobile app | Excel mobile app | Yes – it is the product |
| Customisable fields | Add columns and List values freely | Yes | Fixed by the vendor |
| Share with a link | Yes | File-based | Rarely |
| Year-1 cost, 5 people | 6.99 once | Your time | Around 1,200 |
| Food database / barcode scan | No – you type the figures | No | Yes |
| Who holds the raw data | You, in your own Drive | You | The vendor |
Who Should Use This Template
It suits people who already know what they want to record and want the recording to be frictionless. Meal-preppers logging the same handful of dishes each week. Lifters keeping a written protein record. Anyone whose coach or clinician asked for a food diary that can be shared as a link rather than a screenshot. Spreadsheet users who would rather own a file than rent an app.
It is a poor fit if you want barcode scanning, photo recognition, or a built-in nutrition database – none of those exist here by design. It is also not a clinical record, and it will not tell you what your numbers should be.
Real-World Use Cases
Sunday meal prep. Cook five identical lunches, log the dish once with Servings set to 5, then glance at Entry Count by Food Category to see whether the week has tilted entirely into Grains.
Training-day protein. Use the Post-Workout meal type for shakes, then read Macros by Food (g) – the stacked column chart shows protein, carbs and fat in grams per food, so it is obvious which entries are actually carrying the protein.
A diary for an appointment. A dietitian asks for two weeks of records. Share the sheet as a view-only link; the Status column distinguishes what was planned from what was eaten and what was skipped.
A shared household log. Two people, one sheet, colour-coded meal types. Sheets handles the concurrent editing without anyone emailing a file around.
Advantages of the Calorie & Macro Tracker in Google Sheets
- Typos surface immediately. The Macro kcal and Cal Check pair catches the classic error – a gram figure entered in the wrong column – before it quietly distorts a week of data.
- Nothing to maintain. No pivot tables, no helper ranges, no refresh step. The charts read the data columns and grow with them.
- Readable at a glance. Colour chips on Meal Type, Food Category and Status mean you can scan a week without reading every cell.
- Yours to change. Add a column, add a category, re-theme the colours. It is an ordinary Google Sheet, not a locked app.
- One-time cost. No subscription, no per-device fee, no account required beyond the Google one you already have.
Opportunities for Improvement
Honest limitations, because they matter more than another feature bullet:
- No food database. Every calorie and macro figure is typed by you. That is the trade for a file with no external dependency, but it is real work on your first week until your common foods are established.
- The chip styling needs one manual step. Google Sheets does not let a script set the Chip display style, so columns D, E and O need a ten-second Data validation change to look like the screenshots. The How to Use page walks through it.
- Daily totals are not broken out. The KPI card sums everything logged, not each date separately. If you want per-day totals you will want a small SUMIFS by date, or a filter view.
- Row ceiling. The charts are wired to rows 16 to 1000. That is roughly 985 entries; past that you extend the ranges yourself.
Best Practices
- Log at the moment, not at night. The value of the Status column collapses if you reconstruct the day from memory.
- Keep serving units consistent. Decide once whether a “serving” is a cup, a gram figure or a package, and note it in the Notes column.
- Treat “Check Macros” as a to-do. It almost always means a mistyped gram value, not a genuinely unusual food.
- Extend the List tab early. Add the meal types and categories that match how you actually eat before you have 50 rows using the defaults.
- Use Planned rows deliberately. Entering tomorrow’s meals as Planned and flipping them to Logged is the closest this sheet gets to a planner.
- Duplicate the file per month if you prefer clean archives to one long sheet.
If any of the Sheets mechanics behind this – data validation, chart ranges, conditional formatting – are new to you, the Google Docs Editors Help centre documents all of them.
Explore Relevant Templates
- Body Measurements Tracker in Google Sheets – the tape-measure companion to this log.
- Water Intake Tracker in Google Sheets – hydration in the same one-page format.
- Weight Loss Tracker in Google Sheets – weigh-ins charted over time.
- Workout Log Tracker in Google Sheets – sets, reps and session volume.
- Meal Planner & Grocery List in Google Sheets – plan the week before you log it.
- All Google Sheets Trackers
Get the Calorie & Macro Tracker in Google Sheets
Curious how trackers like this are put together? The NextGenTemplates Academy learning paths teach the spreadsheet skills behind them, with practice files to work through.
Frequently Asked Questions
Does the tracker recommend how many calories or grams I should eat?
No. It records and charts what you enter, nothing more. Targets are yours to set, ideally with a qualified professional. Nothing in the template or this article is medical or nutritional advice.
Is there a barcode scanner or food database?
No. You type calorie and macro figures from the label or your own source. That keeps the file self-contained and entirely under your control.
What triggers the “Check Macros” flag?
Macro kcal recalculates calories as protein x 4 + carbs x 4 + fat x 9. When that value and the Calories you typed differ by more than 15%, the Cal Check column flags the row.
How many entries fit?
The charts cover rows 16 to 1000 – roughly 985 entries – and the List tab holds up to 500 dropdown values.
Will it work in Excel?
It is built for Google Sheets. You can export it, but the chip-styled dropdowns and the built-in Aggregate chart behaviour are Sheets features and will not survive the trip intact.
What do I actually download?
A PDF containing the Google Sheets copy link. Clicking it creates your own editable copy in your Drive; the master file is never shared or altered.
Can I share it with a coach or family member?
Yes – it is a normal Google Sheet, so view or edit sharing works exactly as it does on any other file.
About the Author
Built by PK – Microsoft Certified Professional with 15+ years of Excel, Google Sheets, and Power BI experience. Founder of NextGenTemplates, reaching 300K+ subscribers across YouTube channels. Every template is hand-built and tested before release.
Conclusion
A food log only works if it is fast enough to survive a busy week. The Calorie & Macro Tracker in Google Sheets keeps that path short: one page, four formula columns doing the arithmetic, a cross-check that catches your typos, and four charts that redraw as you type. What it will not do is decide anything for you – there are no targets, no advice and no database, just a clean record of what you entered and an honest picture of it.
Get the template here: Calorie & Macro Tracker in Google Sheets – 6.99 on sale, regular 12.99, one-time payment with lifetime access.