The Temp Staffing Dashboard in Google Sheets tracks 4 headline KPIs — Total Revenue, Gross Margin, Total Placements, and Hours Billed — across 6 interactive tabs with 16 pre-built charts and one-click slicers. Setup takes under 10 minutes, and a one-time $9.99 purchase replaces staffing ATS seats that cost $30 to $99 per user every month.
Click here to purchase the Temp Staffing Dashboard in Google Sheets
Temp and contract staffing firms live and die on gross margin, yet most still track revenue, hours billed, and recruiter output in scattered spreadsheets with no single view of profitability by branch, client, or industry. This Google Sheets staffing dashboard solves that by turning one Data sheet into a live, filterable command center that every recruiter, branch manager, and finance lead can open in a browser.
Key Features of the Temp Staffing Dashboard in Google Sheets
Click here to purchase the Temp Staffing Dashboard in Google Sheets
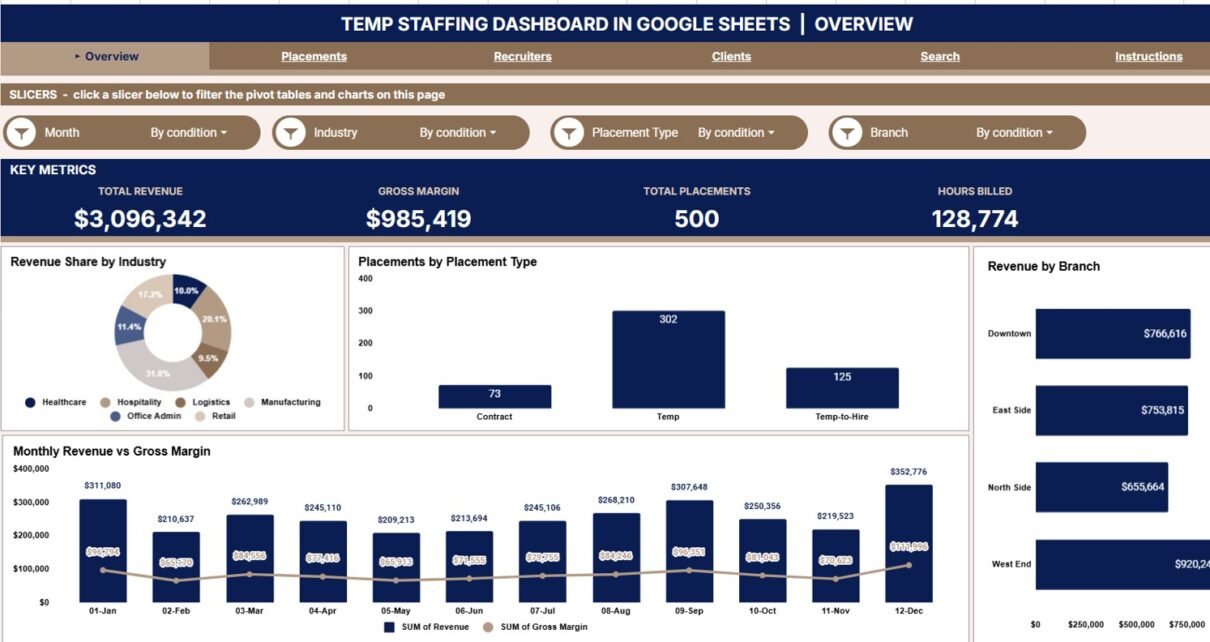
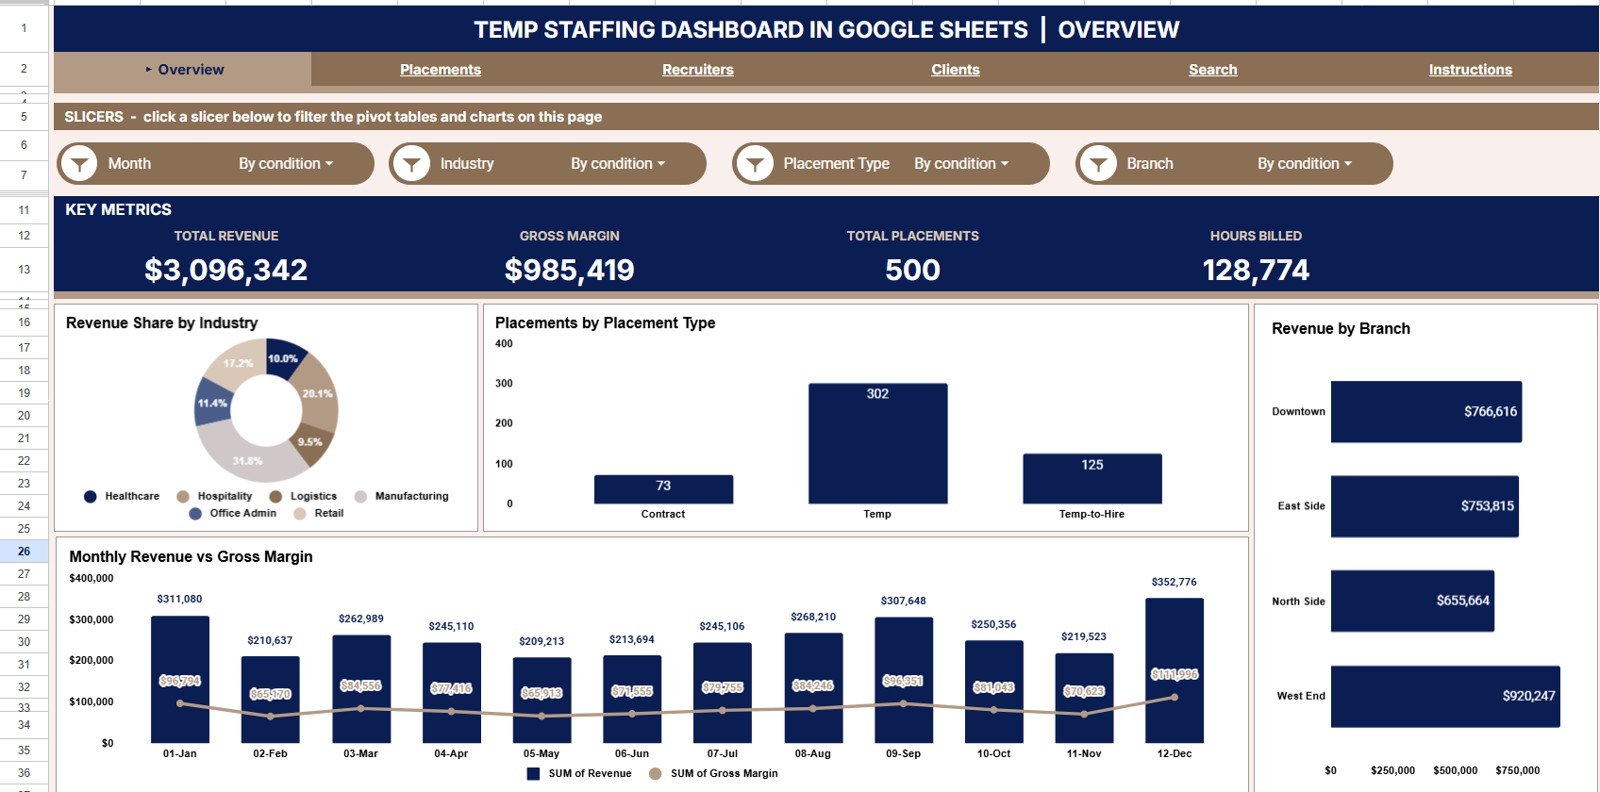
The dashboard shows 4 KPI cards the moment it opens — Total Revenue, Gross Margin, Total Placements, and Hours Billed — giving owners and finance leads an instant read on the health of the agency without scrolling raw rows.
Native Google Sheets slicers sit on the Overview page, so you can filter every chart by industry, branch, placement type, or date range in a single click. There are no pivot tables to rebuild and no macros to enable — the whole view re-draws instantly.
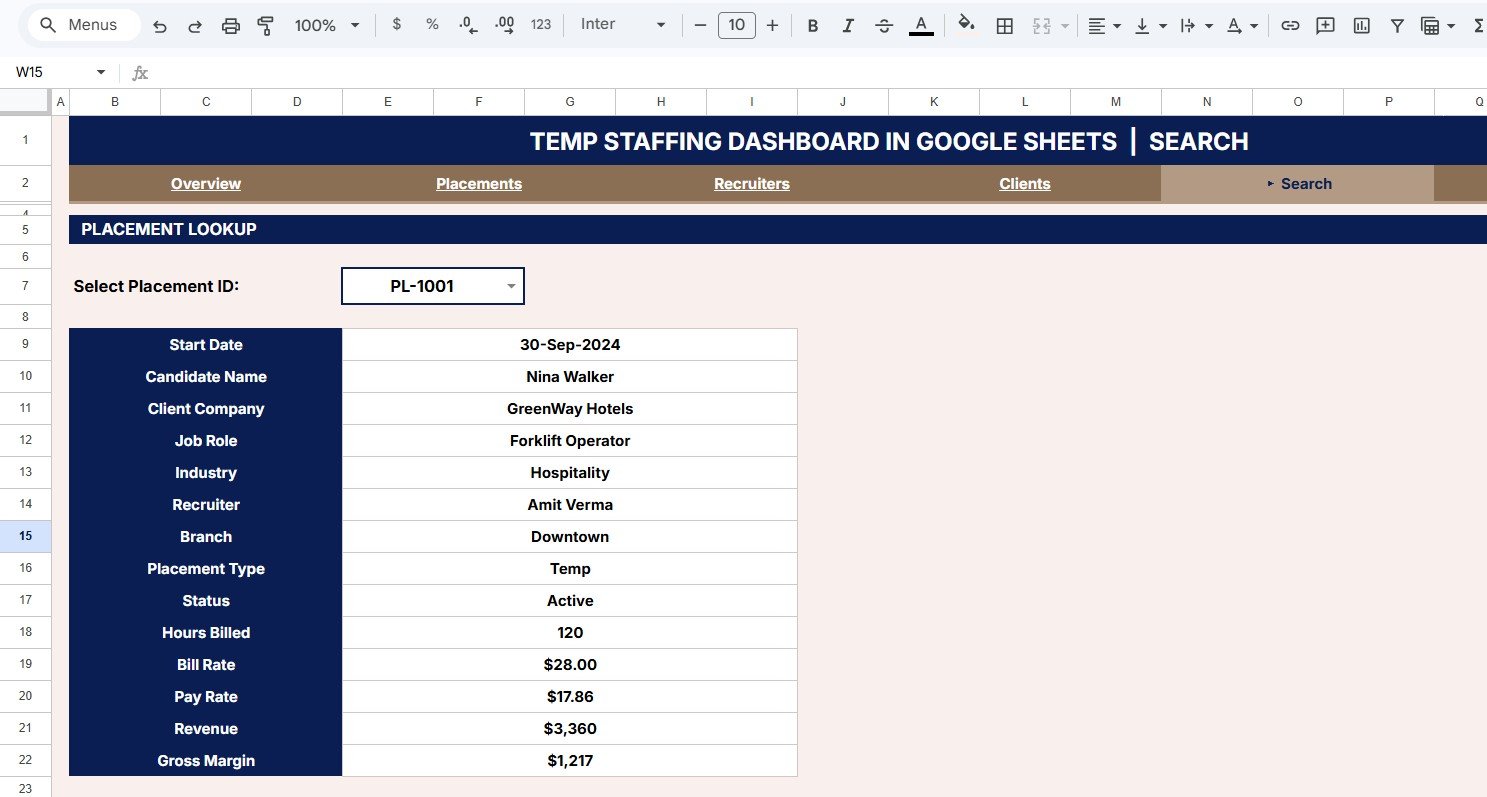
A dedicated Search sheet returns the full record for any Placement ID, including candidate name, client company, job role, industry, recruiter, branch, placement type, status, hours billed, bill rate, pay rate, revenue, and gross margin. Because it runs natively in Google Sheets, you can share it with a link and collaborate in real time on any device.
Dashboard Pages Explanation
Overview Page
The home page shows the 4 KPI cards above charts for Revenue Share by Industry, Placements by Placement Type, Revenue by Branch, and Revenue and Gross Margin by Month. The slicers at the top filter the entire page at once, so you can isolate a single branch or industry in seconds.
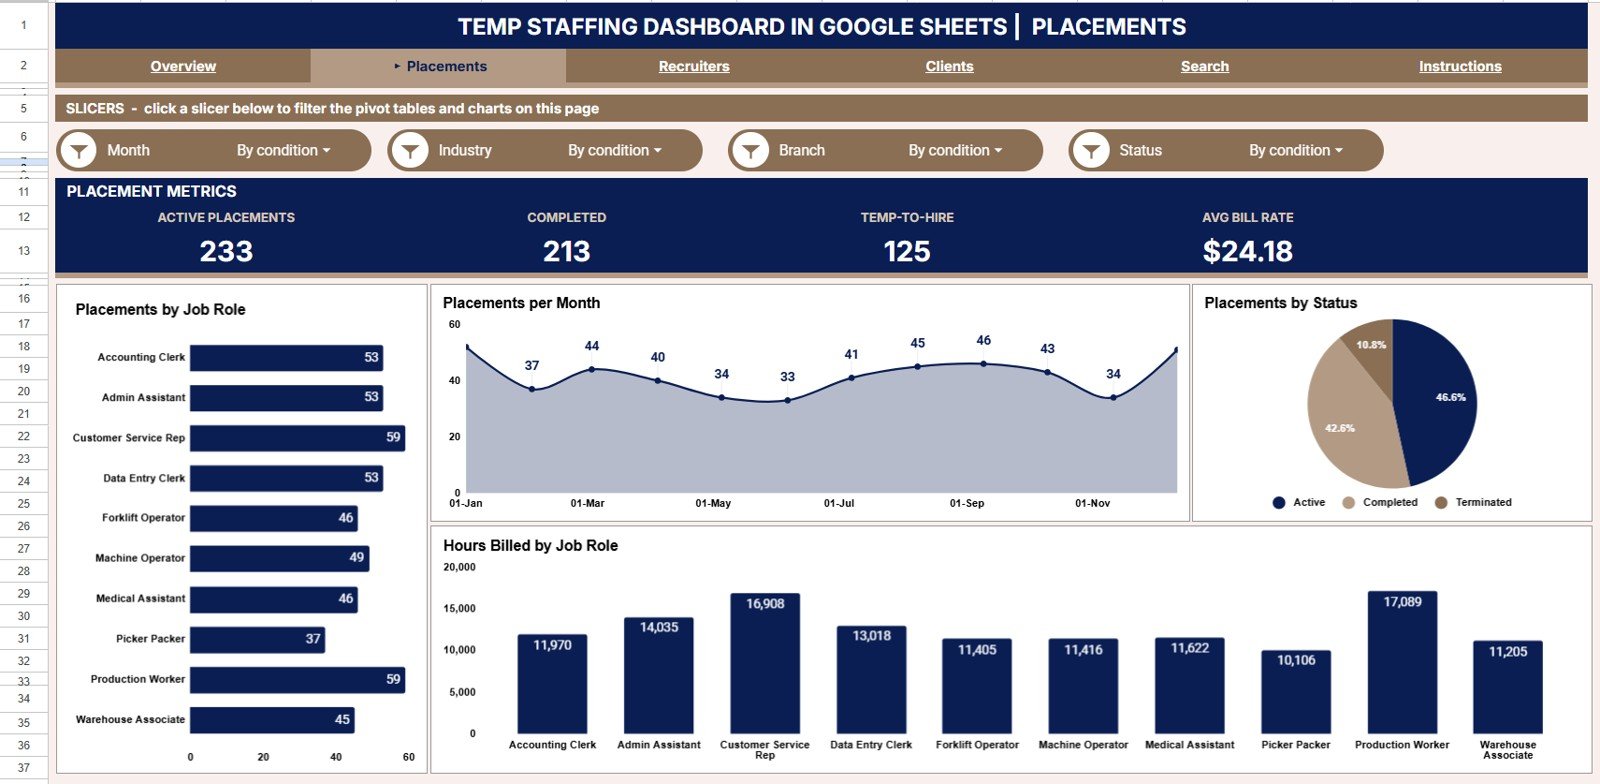
Placements Page
This page breaks down hiring activity with charts for Placements by Job Role, Placements by Month, Placements by Status, and Hours Billed by Job Role. It reveals which roles you fill most, how volume trends month over month, and how billable hours map to each role.
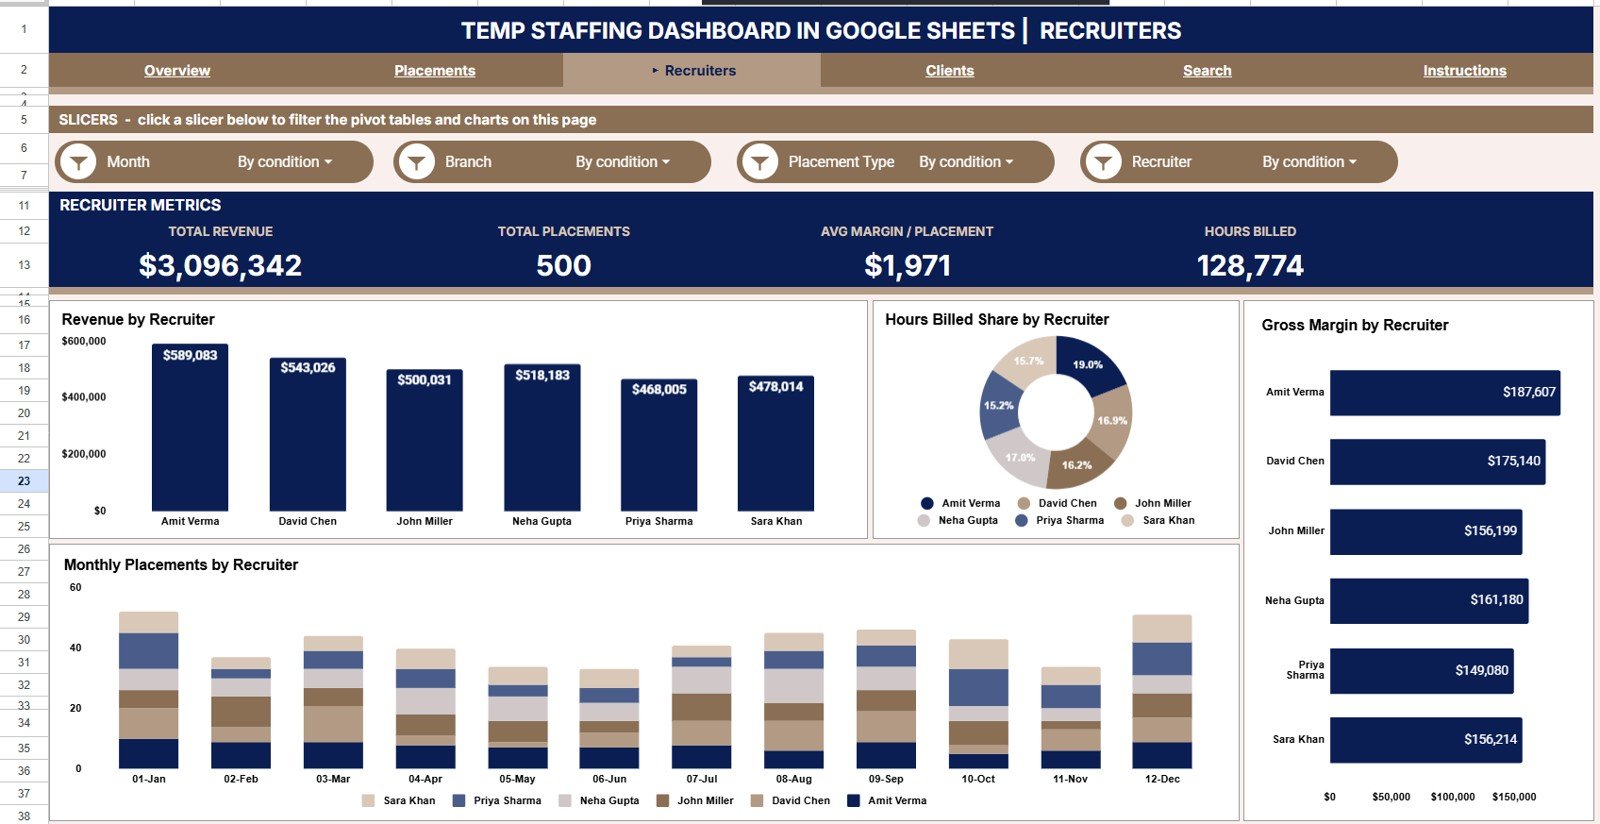
Recruiters Page
The recruiters view is a team scorecard with charts for Revenue by Recruiter, Hours Billed Share by Recruiter, Gross Margin by Recruiter, and Placements by Month and Recruiter. Use it to see who is billing the most, who protects margin, and how each recruiter trends over time.
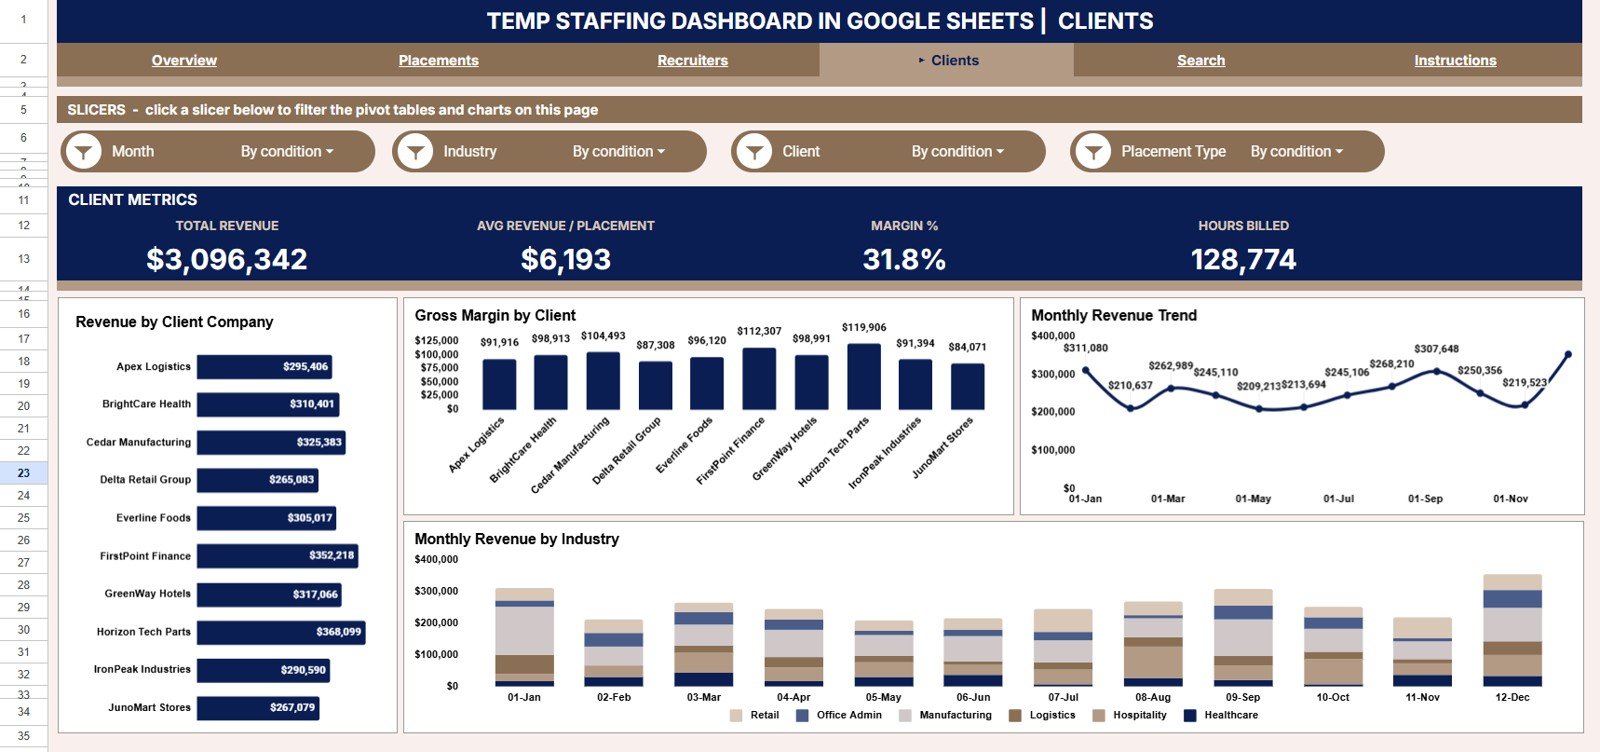
Clients Page
The clients view focuses on account profitability with charts for Revenue by Client Company, Gross Margin by Client, Revenue by Month, and Revenue by Month and Industry. It pinpoints which accounts carry your revenue and which deliver the best margin.
Search Sheet
Enter any Placement ID and instantly view its full detail — candidate name, client company, job role, industry, recruiter, branch, placement type, status, hours billed, bill rate, pay rate, revenue, and gross margin — without scrolling the raw data.
Data Sheet
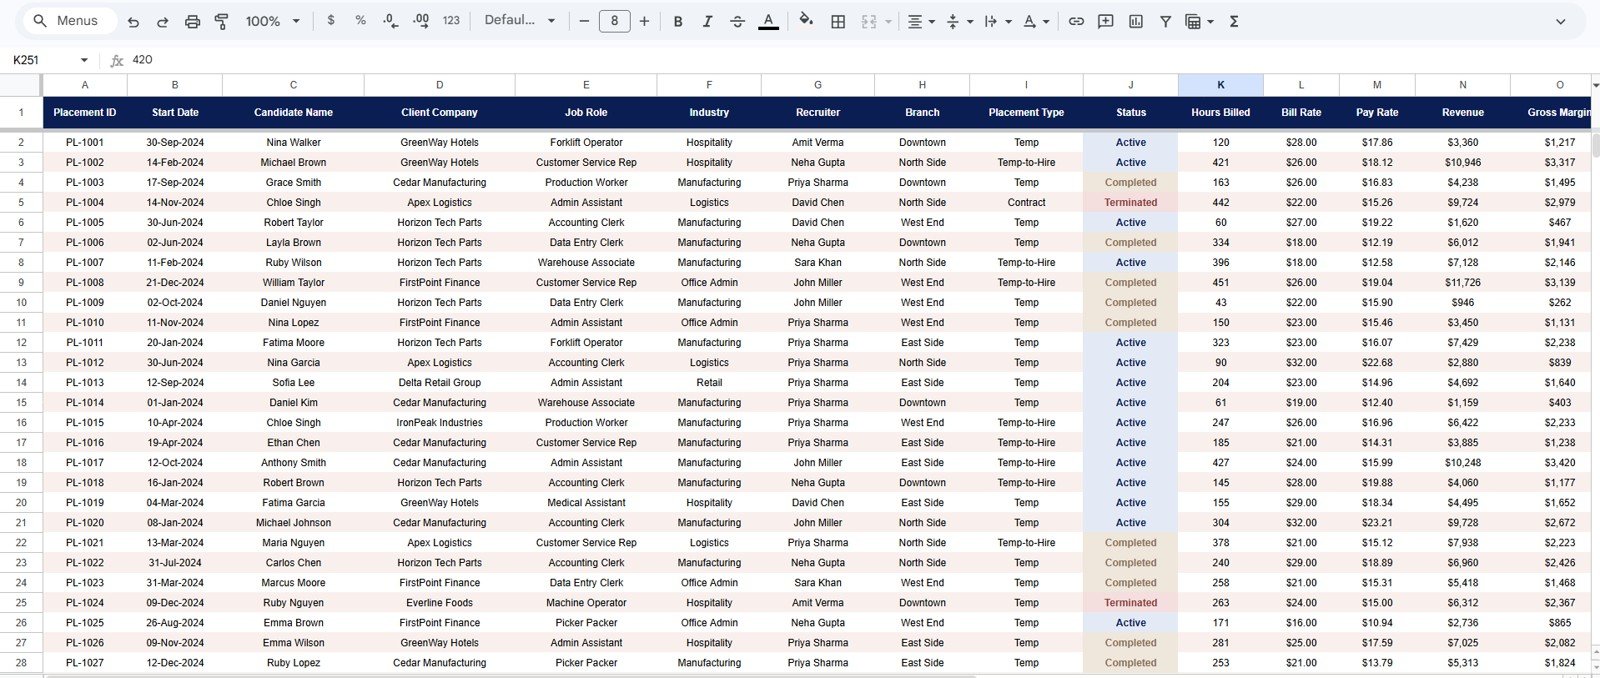
This is the single source of truth. Add or paste your placement records here in the same column format and every page, chart, KPI card, and the Search sheet update automatically — no formulas to maintain.
Temp Staffing Dashboard in Google Sheets vs. Excel vs. Bullhorn / Zoho Recruit — Feature Comparison
| Feature | Temp Staffing Dashboard (Google Sheets) | Microsoft Excel Dashboard | Bullhorn / Zoho Recruit |
|---|---|---|---|
| Cost | $9.99 one-time | $17.99 one-time | $30–$99 / user / month |
| Platform | Google Sheets (browser, any device) | Desktop Excel | Cloud ATS |
| Setup time | Under 10 minutes ✓ | Under 10 minutes ✓ | 2–4 weeks onboarding |
| Revenue & gross margin tracking | Built-in by branch, recruiter & client ✓ | Yes | Add-on / higher tier |
| Real-time team collaboration | Yes — share with a link ✓ | Limited | Yes ✓ |
| Mobile access | Yes, native ✓ | Limited | Yes ✓ |
| Placement ID lookup | Built-in Search sheet, 13 fields ✓ | Manual filtering | Yes ✓ |
| Own your data / no vendor lock-in | Yes ✓ | Yes ✓ | No |
| Year-1 cost at 5 users | $9.99 total ✓ | $17.99 total | $1,800–$5,940 |
For temp-staffing firms that want live revenue and margin visibility without paying thousands a year for an ATS seat, the Temp Staffing Dashboard in Google Sheets sits in the sweet spot.
Who Should Use This Template
Perfect for:
- Temp and contract staffing agency owners with 2–50 recruiters tracking revenue, margin, and hours billed
- Staffing operations managers who need branch, recruiter, and client profitability in one collaborative view
- Recruitment finance leads reporting gross margin and monthly billings to the founder or CFO
- Solo and boutique recruiters who want revenue analytics without $30–$99/month ATS fees
Not a fit if:
- You need an enterprise ATS with CV parsing, SOC 2, and SSO
- Your agency has 500+ recruiters needing row-level security and automated payroll
- You need a candidate sourcing funnel (sourced → screened → submitted) rather than placement and revenue reporting
Real-World Use Cases
Click here to purchase the Temp Staffing Dashboard in Google Sheets
Arjun runs a 20-recruiter temp staffing firm across three branches. Every Monday he opens the dashboard to check Total Revenue and Gross Margin, then filters Revenue by Branch to see which office is pulling ahead — and shares a live link with his branch managers before the team call.
Lena leads finance at a light-industrial staffing agency. She uses the Recruiters page to spot which recruiters protect gross margin versus those chasing low-margin volume, then reviews Revenue and Gross Margin by Month before the quarterly board meeting.
Sam is a solo contract recruiter placing IT and healthcare temps. He uses the Search sheet during client calls to pull bill rate, pay rate, and hours billed for any placement, and the Clients page to see which accounts deliver the best margin.
Advantages of the Temp Staffing Dashboard in Google Sheets
The biggest advantage is cost: a single $9.99 purchase replaces recurring ATS subscriptions that run into thousands of dollars per year once you add seats. You own the file outright, with no vendor lock-in and no risk of losing access if you stop paying.
The second advantage is speed. Because every chart and KPI is wired to one Data sheet, onboarding takes minutes rather than the weeks an ATS rollout demands. Slicers replace complex filtering, so non-technical recruiters can self-serve answers.
Finally, it lives where your team already works. Google Sheets means browser access, mobile viewing, link sharing, and real-time collaboration are built in — ideal for multi-branch agencies and remote recruiters. For more on filtering with slicers, see the official Google Sheets slicer documentation.
Opportunities for Improvement
This dashboard is a reporting and analysis layer, not a full applicant tracking system. It does not manage a candidate pipeline, parse CVs, or automate payroll, so agencies needing those capabilities should pair it with a dedicated ATS. For very large datasets exceeding 10,000 placements per year, the Temp Staffing Dashboard in Power BI handles the volume more efficiently.
It also relies on clean, consistently formatted input. If columns are reordered or data types change, charts can misread the source. Teams importing from multiple systems should standardize their export format before pasting into the Data sheet.
Best Practices
- Keep the Data sheet column order intact — paste values, not entire formatted ranges.
- Use one row per placement and avoid blank rows so charts read the full range.
- Standardize recruiter, branch, client, and industry names so slicers group cleanly.
- Duplicate the file at month-end to keep a dated archive for trend comparisons.
- Set sharing to view for recruiters and edit only for managers and finance.
Explore Relevant Templates
If you also track placement volume and bill rates, the Staffing Agency Dashboard in Google Sheets follows the same slicer-driven layout. For service-based businesses, the Coaching Business Dashboard in Google Sheets tracks revenue and sessions the same way, while the Contract Manufacturing Dashboard in Google Sheets applies the pattern to production operations. Browse the full range of Google Sheets Dashboard Templates and HR & Payroll Templates on NextGenTemplates.
🔄 Also available as: Excel · Power BI.
Frequently Asked Questions
What KPIs does the Temp Staffing Dashboard in Google Sheets track?
The Temp Staffing Dashboard in Google Sheets tracks 4 headline KPIs — Total Revenue, Gross Margin, Total Placements, and Hours Billed — plus revenue by industry, branch, recruiter, and client, gross margin by recruiter and client, placements by role, month, and status, and hours billed by job role. Every metric updates automatically when you add data.
How long does setup take?
Setup takes under 10 minutes. Make your own copy from the included link, paste your placement records into the Data sheet using the same column format, and the Temp Staffing Dashboard in Google Sheets refreshes every chart, KPI card, and the Search sheet automatically.
How does this compare to Bullhorn or Zoho Recruit?
Bullhorn and Zoho Recruit cost $30–$99 per user per month and keep your data inside their platform. The Temp Staffing Dashboard in Google Sheets is a $9.99 one-time purchase covering revenue, margin, placement, recruiter, and client reporting with real-time collaboration and no per-user fees.
Can I filter the dashboard by branch or industry?
Yes. Native slicers on the Overview page let you filter the Temp Staffing Dashboard in Google Sheets by industry, branch, placement type, and date range in one click, and every chart and KPI re-draws instantly.
Can I look up a single placement?
Yes. The Search sheet in the Temp Staffing Dashboard in Google Sheets returns 13 fields for any Placement ID — candidate name, client company, job role, industry, recruiter, branch, placement type, status, hours billed, bill rate, pay rate, revenue, and gross margin — in one lookup.
Do I need paid software to use this dashboard?
No. The Temp Staffing Dashboard in Google Sheets runs entirely in Google Sheets, which is free with any Google account. You open it in your browser with no desktop software, no plugins, and no Excel license required.
About the Author
Built by PK — Microsoft Certified Professional with 15+ years of Excel, Google Sheets, and Power BI experience. Founder of NextGenTemplates, reaching 300K+ subscribers across YouTube channels. Every template is hand-built and tested before release.
Conclusion
The Temp Staffing Dashboard in Google Sheets gives temp and contract staffing firms a live view of revenue, gross margin, placements, and hours billed for a one-time $9.99 — no subscription, no per-user fees, and full ownership of your data. Click here to purchase the Temp Staffing Dashboard in Google Sheets and start tracking in under 10 minutes.
Instant download · One-time payment · No subscription
🎥 For step-by-step video tutorials, visit YouTube.com/@NeoTechNavigators.
Last updated: July 2026