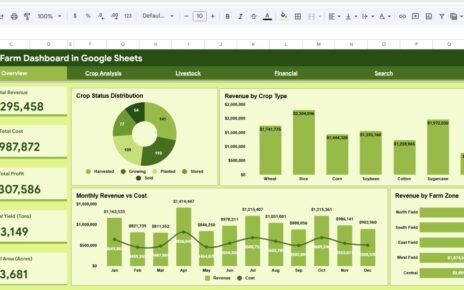
The Contract Manufacturing Dashboard in Google Sheets tracks 4 headline KPIs across 5 interactive pages, with 13 pre-built charts and one-click slicers for client, category, facility, and production line. Setup takes under 10 minutes, and a one-time $9.99 purchase replaces MRP seats that cost $49 to $199 per user every month.
Click here to purchase the Contract Manufacturing Dashboard in Google Sheets
Contract manufacturers and CMOs juggle dozens of client orders across multiple facilities, yet most still track them in scattered spreadsheets with no single view of value, output, and quality. This Google Sheets Manufacturing Dashboard solves that by turning one Data sheet into a live, filterable command center that every operations, quality, and account-management teammate can open in a browser.

Key Features of the Contract Manufacturing Dashboard in Google Sheets
Click here to purchase the Contract Manufacturing Dashboard in Google Sheets
The dashboard monitors 4 KPI cards the moment it opens: Total Order Value, Units Produced, Average Lead Time, and Work Orders. These give plant and operations managers an instant read on the health of the contract book without scrolling through raw rows.
Native Google Sheets slicers sit at the top of every page, so you can filter every chart by client, product category, facility, or production line in a single click. There are no formulas to rewrite and no pivot tables to rebuild — the whole view re-draws instantly.
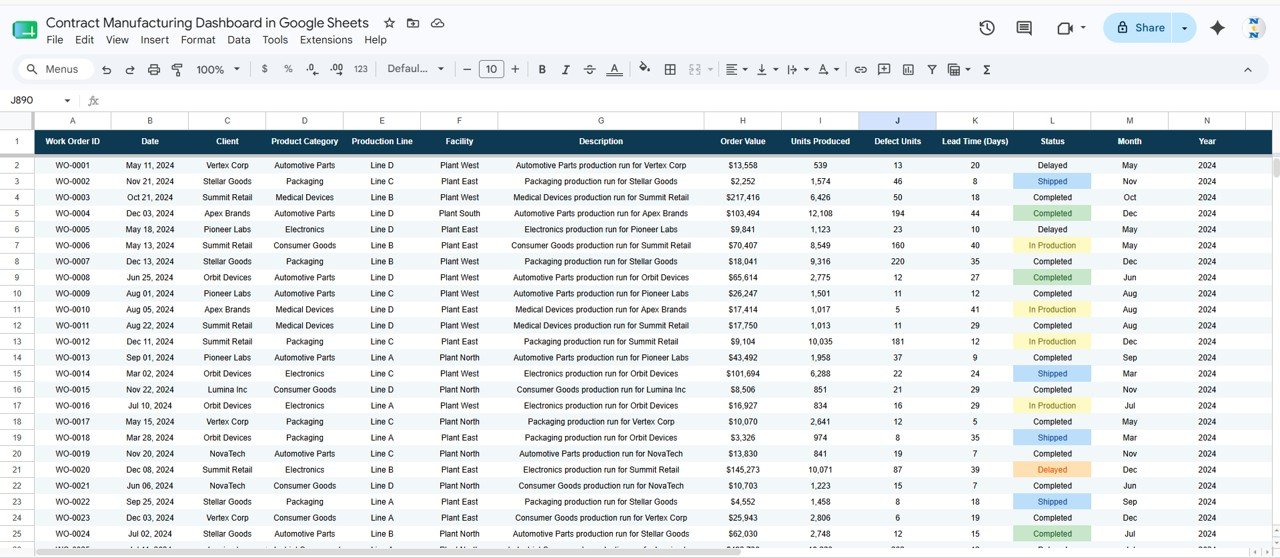
A dedicated Search sheet returns the full record for any Work Order ID, including date, client, product category, production line, facility, description, order value, units produced, defect units, lead time, and status. Because it runs natively in Google Sheets, you can share it with a link and collaborate in real time on any device.
Dashboard Pages Explanation
Overview Page
The home page shows the 4 KPI cards above charts for Order Value by Category, Order Value by Client, Units by Facility, and Monthly Order Value and Units. The slicers at the top filter the entire page at once.
Clients Page
Click here to purchase the Contract Manufacturing Dashboard in Google Sheets
This page breaks revenue down by customer with charts for Order Value by Client, Monthly Order Value, and Order Value by Category. It reveals which contracts carry your book of business and how each client trends month over month.

Production Page
The production view tracks output capacity with charts for Units by Facility, Order Value by Line, and Monthly Units by Line. Use it to compare plant throughput and see which production lines are carrying the load.

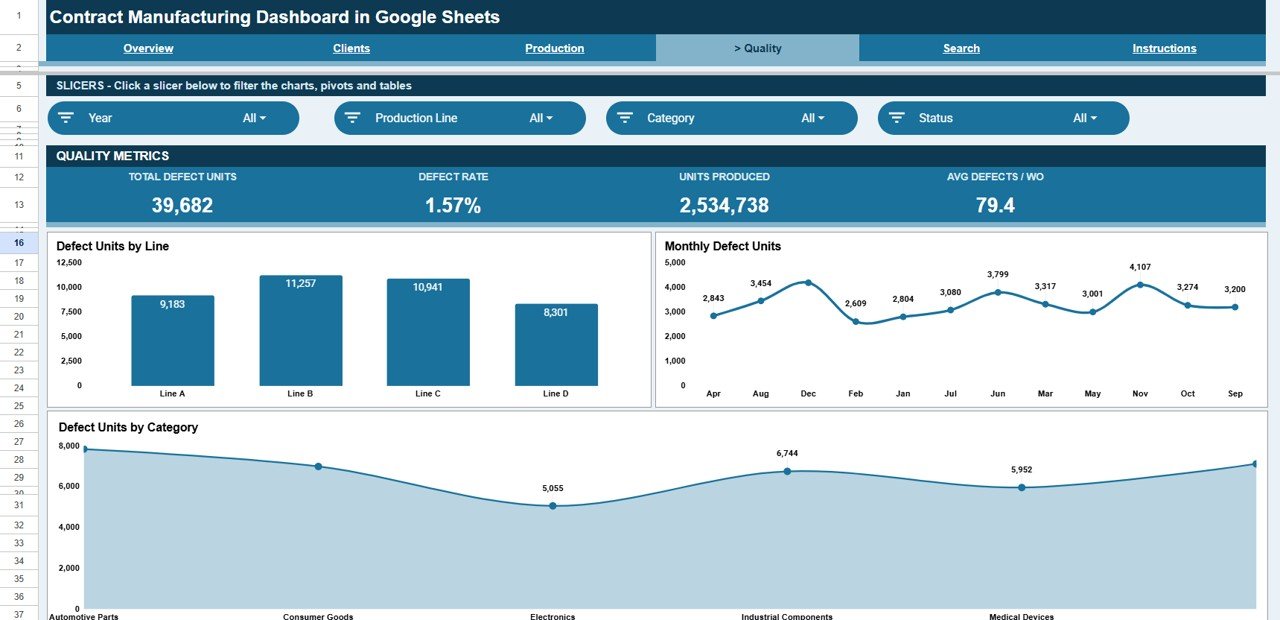
Quality Page
Click here to purchase the Contract Manufacturing Dashboard in Google Sheets
The quality view surfaces defects with charts for Defect Units by Line, Monthly Defect Units, and Defect Units by Category. It pinpoints where rework and scrap originate so you can act before a client complaint lands.
Search Sheet
Enter any Work Order ID and instantly view its full detail — date, client, product category, production line, facility, description, order value, units produced, defect units, lead time, and status — without scrolling the raw data.

Data Sheet
Click here to purchase the Contract Manufacturing Dashboard in Google Sheets
This is the single source of truth. Add or paste your work orders here in the same column format and every page, chart, KPI card, and the Search sheet update automatically.
Contract Manufacturing Dashboard in Google Sheets vs. Excel vs. Paid MRP/SaaS — Feature Comparison
| Feature | Contract Manufacturing Dashboard (Google Sheets) | Microsoft Excel Dashboard | MRPeasy / Katana MRP |
|---|---|---|---|
| Cost | $9.99 one-time | $12–$18 one-time | $49–$199 / user / month |
| Platform | Google Sheets (browser, any device) | Desktop Excel | Cloud SaaS |
| Setup time | Under 10 minutes ✓ | Under 10 minutes ✓ | Days to weeks |
| Real-time team collaboration | Yes — share with a link ✓ | Limited | Yes ✓ |
| Mobile access | Yes, native ✓ | Limited | Yes ✓ |
| Work Order ID lookup | Built-in Search sheet ✓ | Built-in | Yes ✓ |
| Defect / quality tracking | Yes — by line, month, category ✓ | Yes | Yes ✓ |
| Own your data / no vendor lock-in | Yes ✓ | Yes ✓ | No |
| Year-1 cost at 5 users | $9.99 total ✓ | ~$15 total | $3,000–$12,000+ |
For contract manufacturers who want live order, output, and defect visibility without paying thousands a year for an MRP seat, the Contract Manufacturing Dashboard in Google Sheets sits in the sweet spot.
Who Should Use This Template
Perfect for:
- Contract manufacturers and CMOs managing multiple client production orders across facilities
- Operations and plant managers who need order value, output, and lead-time visibility in one place
- Quality and account managers tracking defect units and Work Order status without an ERP login
- Small and mid-size job shops that want a dashboard without paying for MRPeasy or Katana seats
Not a fit if:
- You need live machine or IoT data feeds and automated shop-floor scheduling
- You require full MRP with BOM explosion and inventory netting in one system
- Your team cannot use Google Sheets (no Google account or browser access)
Real-World Use Cases
Click here to purchase the Contract Manufacturing Dashboard in Google Sheets
Ravi runs a 3-facility electronics contract manufacturer. Each morning he opens the dashboard to see Total Order Value and Units Produced by facility, then filters the Production page by line to decide where to add a shift — without ever opening an ERP.
Maria is a quality lead at a packaging CMO. She filters the Quality page to find which production line drove the month’s defect spike, opens the Search sheet for the affected Work Order IDs, and walks into the client review with the full record ready.
James manages key accounts at a metal-parts job shop. Before each client call he filters the Clients page to that customer, reviews their Monthly Order Value trend, and shares the live Google Sheets link so the client sees the same numbers in real time.
Advantages of the Contract Manufacturing Dashboard in Google Sheets
The biggest advantage is cost: a single $9.99 purchase replaces recurring MRP subscriptions that run into thousands of dollars per year once you add seats. You own the file outright, with no vendor lock-in and no risk of losing access if you stop paying.
The second advantage is speed. Because every chart and KPI is wired to one Data sheet, onboarding takes minutes rather than the days or weeks an MRP rollout demands. Slicers replace complex filtering, so non-technical staff can self-serve answers.
Finally, it lives where your team already works. Google Sheets means browser access, mobile viewing, link sharing, and real-time collaboration are built in — ideal for distributed operations and remote account managers. For more on filtering with slicers, see the official Google Sheets slicer documentation.
Opportunities for Improvement
Click here to purchase the Contract Manufacturing Dashboard in Google Sheets
This dashboard is a reporting and analysis layer, not a full manufacturing execution system. It does not connect to live machine sensors, automate production scheduling, or perform BOM-level material netting, so plants needing those capabilities should pair it with a dedicated MRP tool.
It also relies on clean, consistently formatted input. If columns are reordered or data types change, charts can misread the source. Teams importing from multiple systems should standardize their export format before pasting into the Data sheet.
Best Practices
- Keep the Data sheet column order intact — paste values, not entire formatted ranges.
- Use one row per work order and avoid blank rows so charts read the full range.
- Standardize client, facility, and line names so slicers group cleanly.
- Duplicate the file at month-end to keep a dated archive for trend comparisons.
- Set sharing to “view” for clients and “edit” only for internal staff.
Explore Relevant Templates
If you manage other industrial operations, the Oil and Gas Analysis Dashboard in Google Sheets follows the same slicer-driven layout. To track audits alongside production, add the Compliance and Audit Dashboard in Google Sheets. For scheduled upkeep across facilities, the Equipment Maintenance Management System Web App is a natural companion, while the Staffing Agency Dashboard in Google Sheets and ESG Environmental Dashboard in Google Sheets round out a full operations toolkit.
Frequently Asked Questions
Click here to purchase the Contract Manufacturing Dashboard in Google Sheets
What KPIs does the Contract Manufacturing Dashboard in Google Sheets track?
The Contract Manufacturing Dashboard in Google Sheets tracks 4 headline KPIs — Total Order Value, Units Produced, Average Lead Time, and Work Orders — plus defect units, order value by client, category and line, and units by facility. Every metric updates automatically when you add data.
How long does setup take?
Setup takes under 10 minutes. Make your own copy from the included link, paste your work orders into the Data sheet using the same column format, and the Contract Manufacturing Dashboard in Google Sheets refreshes every chart, KPI card, and the Search sheet automatically.
How does this compare to MRPeasy or Katana MRP?
MRP platforms like MRPeasy and Katana charge $49 to $199 per user per month. The Contract Manufacturing Dashboard in Google Sheets is a $9.99 one-time purchase covering order, output, lead-time, and defect reporting — ideal when you want visibility without an ongoing MRP subscription.
Can I filter the dashboard by client or facility?
Yes. Native slicers at the top of each page let you filter the Contract Manufacturing Dashboard in Google Sheets by client, product category, facility, or production line in one click, and every chart and KPI re-draws instantly.
Does it work on mobile and for team sharing?
Yes. Because the Contract Manufacturing Dashboard in Google Sheets runs natively in Google Sheets, you can open it in any browser, view it on mobile, and share a link for real-time collaboration with no per-user fees.
Can I look up a single work order?
Yes. The Search sheet in the Contract Manufacturing Dashboard in Google Sheets returns the full record for any Work Order ID — date, client, category, line, facility, order value, units, defects, lead time, and status — in one lookup.
About the Author
Built by PK — Microsoft Certified Professional with 15+ years of Excel, Google Sheets, and Power BI experience. Founder of NextGenTemplates, reaching 300K+ subscribers across YouTube channels. Every template is hand-built and tested before release.
Conclusion
The Contract Manufacturing Dashboard in Google Sheets gives contract manufacturers a live view of order value, output, lead time, and quality for a one-time $9.99 — no subscription, no per-user fees, and full ownership of your data. Click here to purchase the Contract Manufacturing Dashboard in Google Sheets and start tracking in under 10 minutes.
Instant download · One-time payment · No subscription
🎥 For step-by-step video tutorials, visit YouTube.com/@NeoTechNavigators.
Last updated: June 2026