Internal audit and compliance teams spend an average of 60–80% of audit cycle time on data wrangling — pulling findings from email, tagging them by risk, reconciling them against regulations, and rebuilding the same dashboard every quarter. The Compliance and Audit Dashboard in Google Sheets compresses all of that into a single shareable file with 4 analysis pages, 15+ KPIs, 18 charts, and a built-in Audit Record Lookup.
👉 Click here to Purchase the Compliance and Audit Dashboard in Google Sheets
This post walks through every page of the Compliance and Audit Dashboard in Google Sheets, explains what each KPI and chart tracks, compares it to Excel and enterprise GRC platforms like AuditBoard and LogicGate, and shows three real-world scenarios where audit managers, quality leads, and consultants are already using it instead of paying $30,000+ a year for GRC SaaS.
Key Features of the Compliance and Audit Dashboard in Google Sheets
👉 Click here to Purchase the Compliance and Audit Dashboard in Google Sheets
- 4 dedicated analysis pages — Overview, Audit Findings, Compliance Status, and Risk Analysis, each with KPI cards, charts, and slicers.
- 15+ pre-built KPIs including Total Audits, Open Findings, Critical Risk, Compliance Rate, Closed Rate, Overdue Findings, Average Severity, Compliant, Non-Compliant, Pending Review, Critical Risks, High Risks, and Max Severity.
- 18 interactive charts covering Audits by Type, Compliance Status by Category, Monthly Audit Volume by Month, Audits by Department, Risk Level by Region, Findings by Audit Type, Audits by Regulation, Risk Level Distribution, Department Risk Profile, and more.
- Slicer-based filtering on every page — one-click filters for Department, Region, Audit Type, Risk Level, Regulation, and Compliance Status.
- Audit Record Lookup on a dedicated Search sheet — pick any Audit ID from a dropdown and see all 12 fields for that record.
- Native Google Sheets — no add-ons, no scripts, real-time multi-user editing, mobile access, and one-link sharing.
Dashboard Pages Explanation
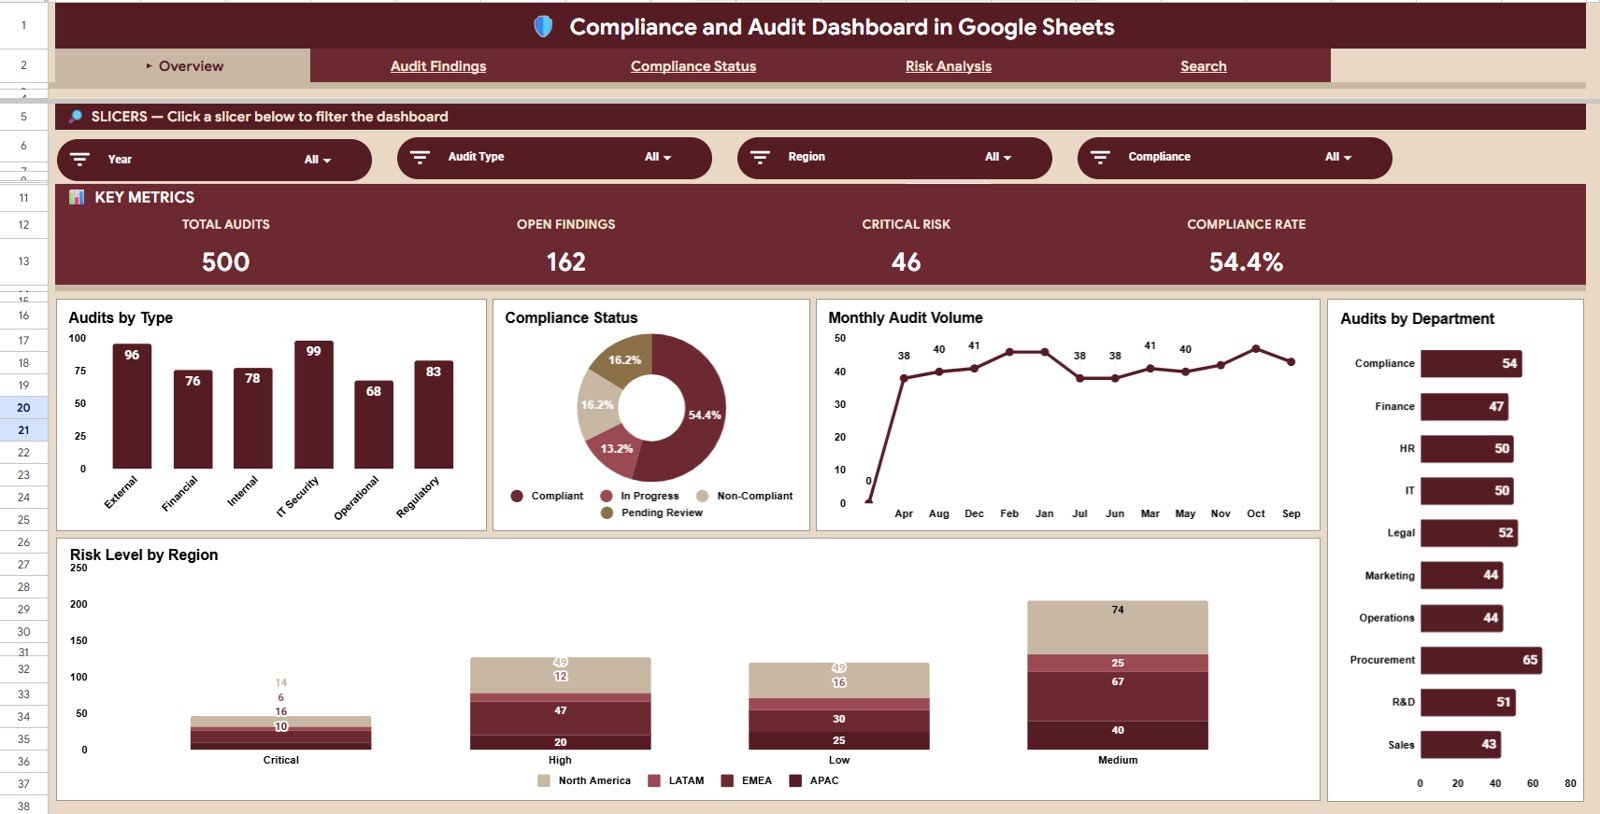
Page 1: Overview
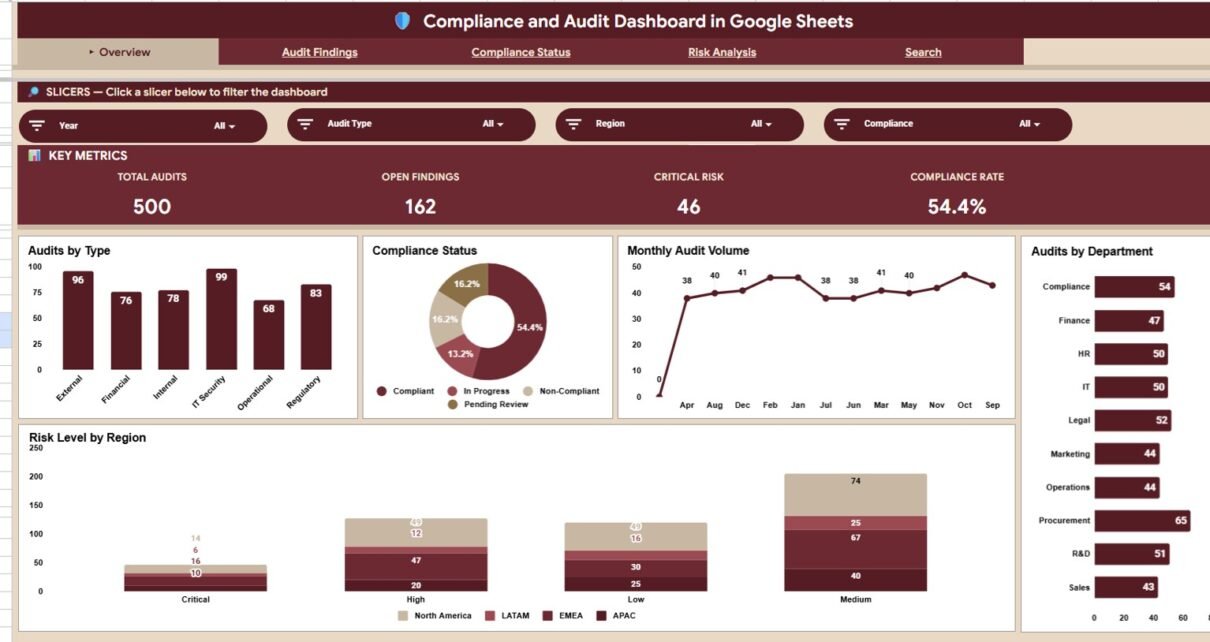
The Overview page is the executive snapshot. The top of the page shows 4 KPI cards: Total Audits, Open Findings, Critical Risk, and Compliance Rate. Below the cards sit five charts — Audits by Type, Compliance Status by Category, Monthly Audit Volume by Month, Audits by Department, and Risk Level by Region. Slicers at the top of the page let you filter the entire view by Department, Region, or Audit Type in one click. Use this page when you have 60 seconds to brief leadership before a board meeting.
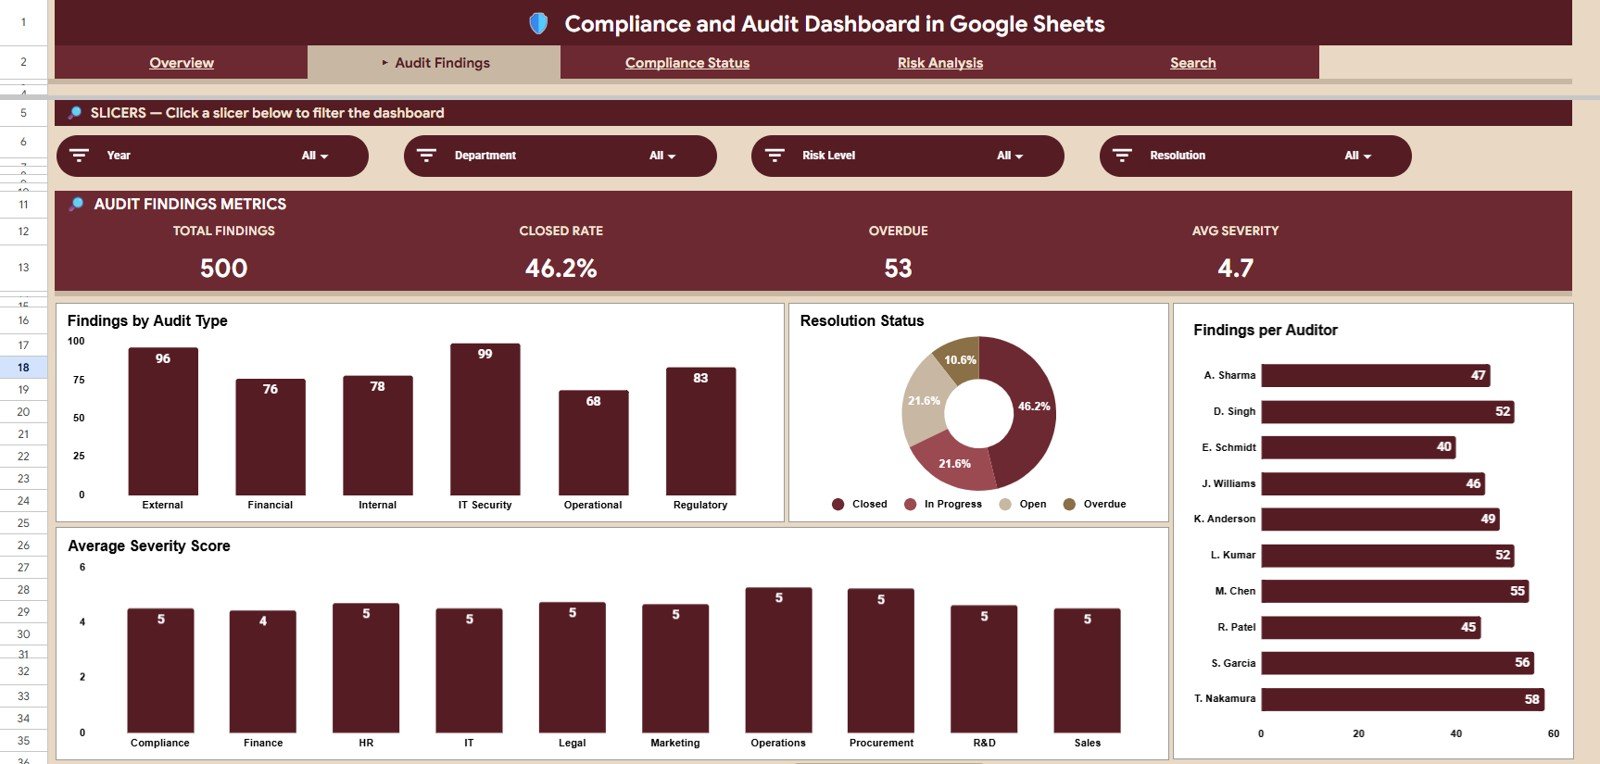
Page 2: Audit Findings
👉 Click here to Purchase the Compliance and Audit Dashboard in Google Sheets
The Audit Findings page is built for the audit team itself. KPI cards on this page show Total Findings, Closed Rate, Overdue Findings, and Average Severity. The charts below break down Findings by Audit Type, Resolution Status by Category, Findings per Auditor, and Average Severity Score by Department. Open this page during your monthly audit committee review — Findings per Auditor doubles as a performance view, while Overdue Findings is your escalation list.
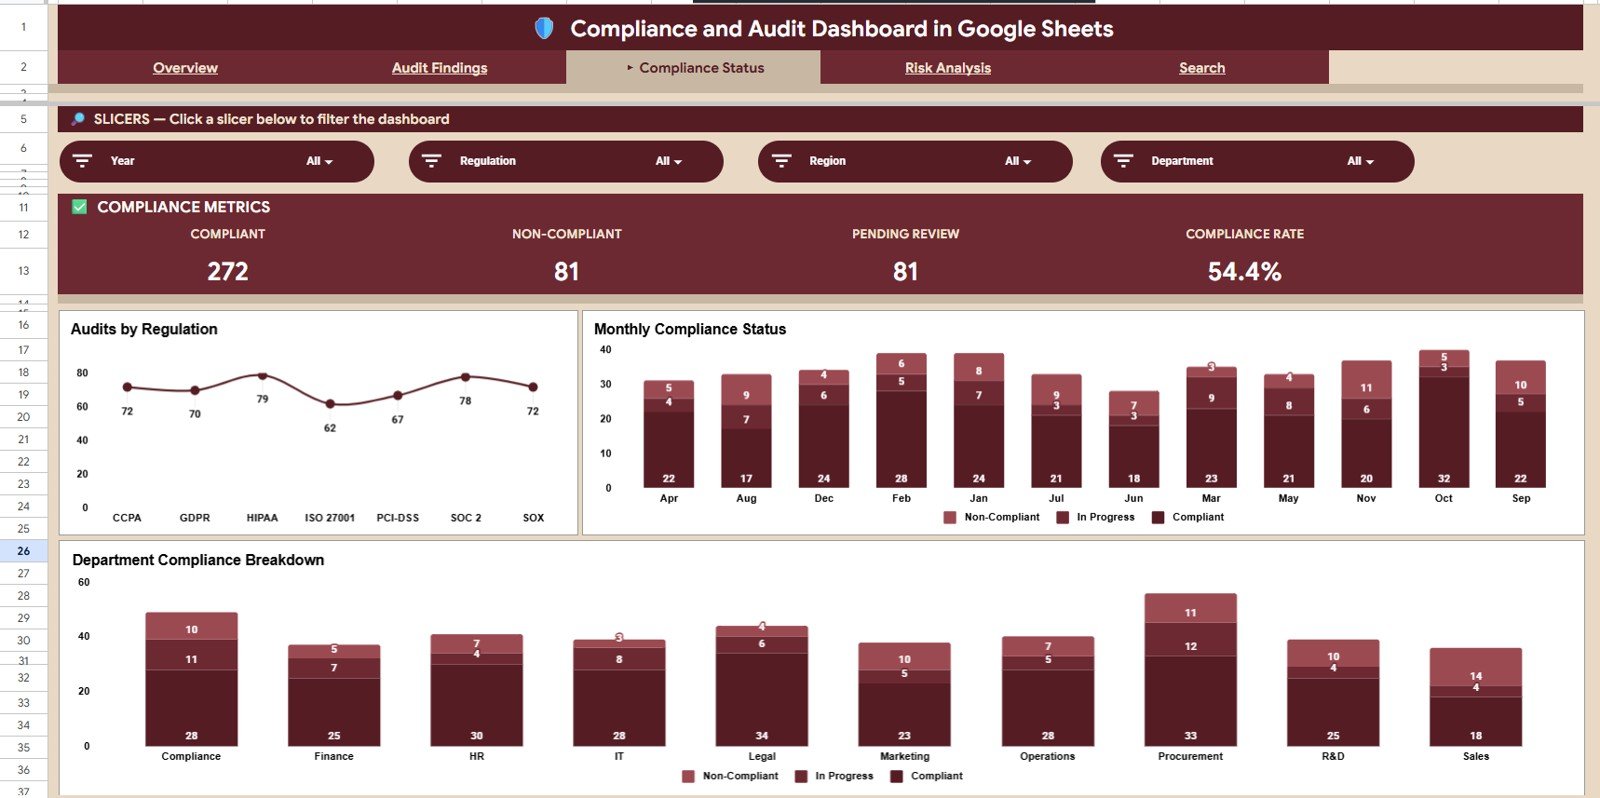
Page 3: Compliance Status
The Compliance Status page is the regulatory view. KPI cards summarise Compliant, Non-Compliant, Pending Review, and the overall Compliance Rate. Charts include Audits by Regulation (SOX, ISO 27001, GDPR, HIPAA, PCI-DSS, or whatever framework you’re tracking), Monthly Compliance Status by Month, and Department Compliance Breakdown. This is the page you’ll project on screen during external audits and regulator visits.
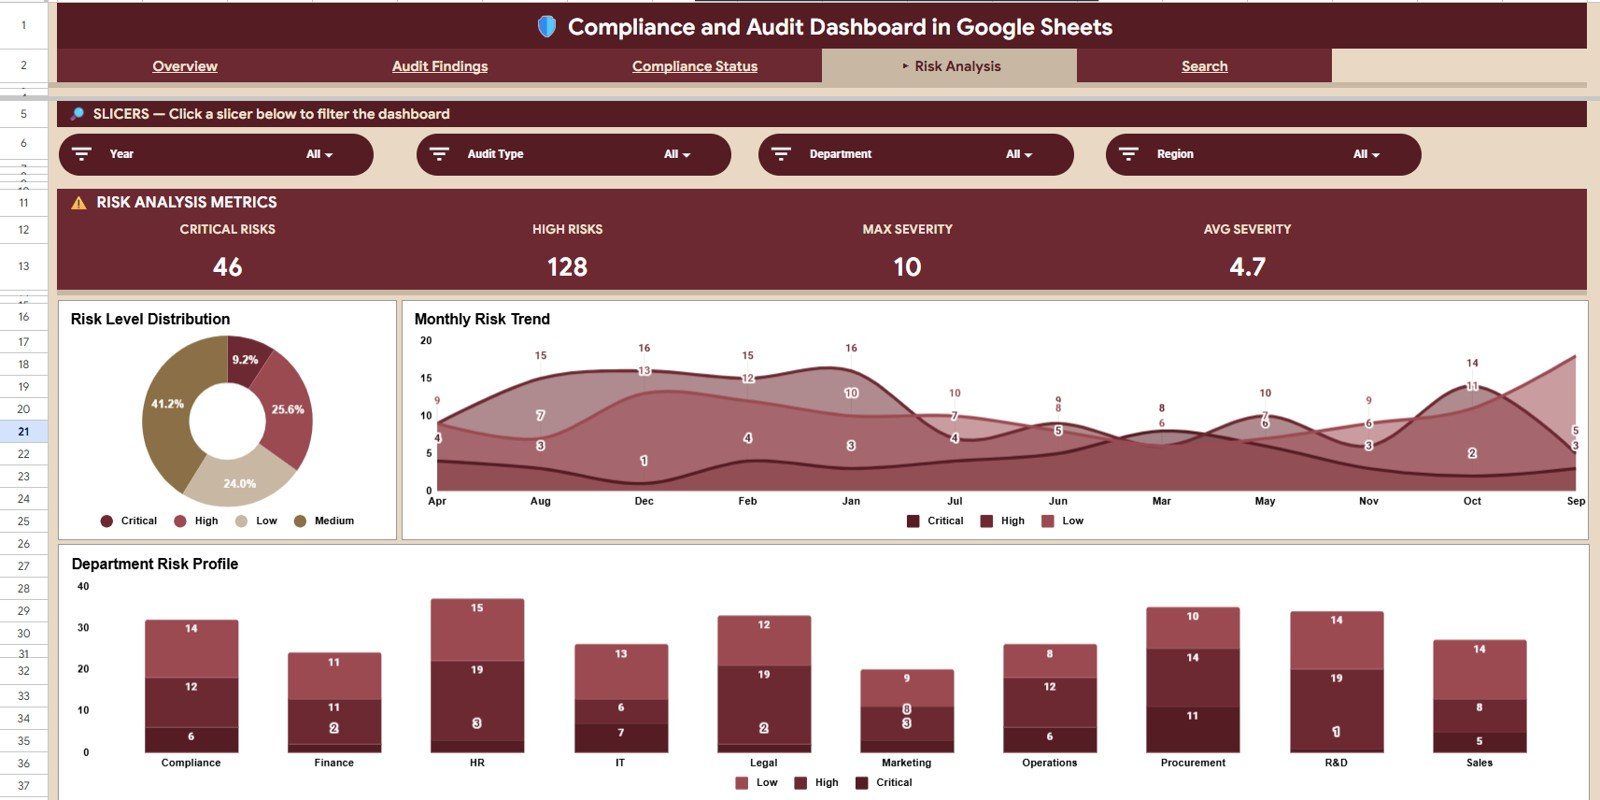
Page 4: Risk Analysis
👉 Click here to Purchase the Compliance and Audit Dashboard in Google Sheets
The Risk Analysis page surfaces severity and concentration. The KPI cards track Critical Risks, High Risks, Max Severity, and Average Severity. The charts include Risk Level Distribution, Monthly Risk Trend by Month, and Department Risk Profile — ideal for enterprise risk management (ERM) teams that need to spot where risk is clustering and how the trend line is moving.
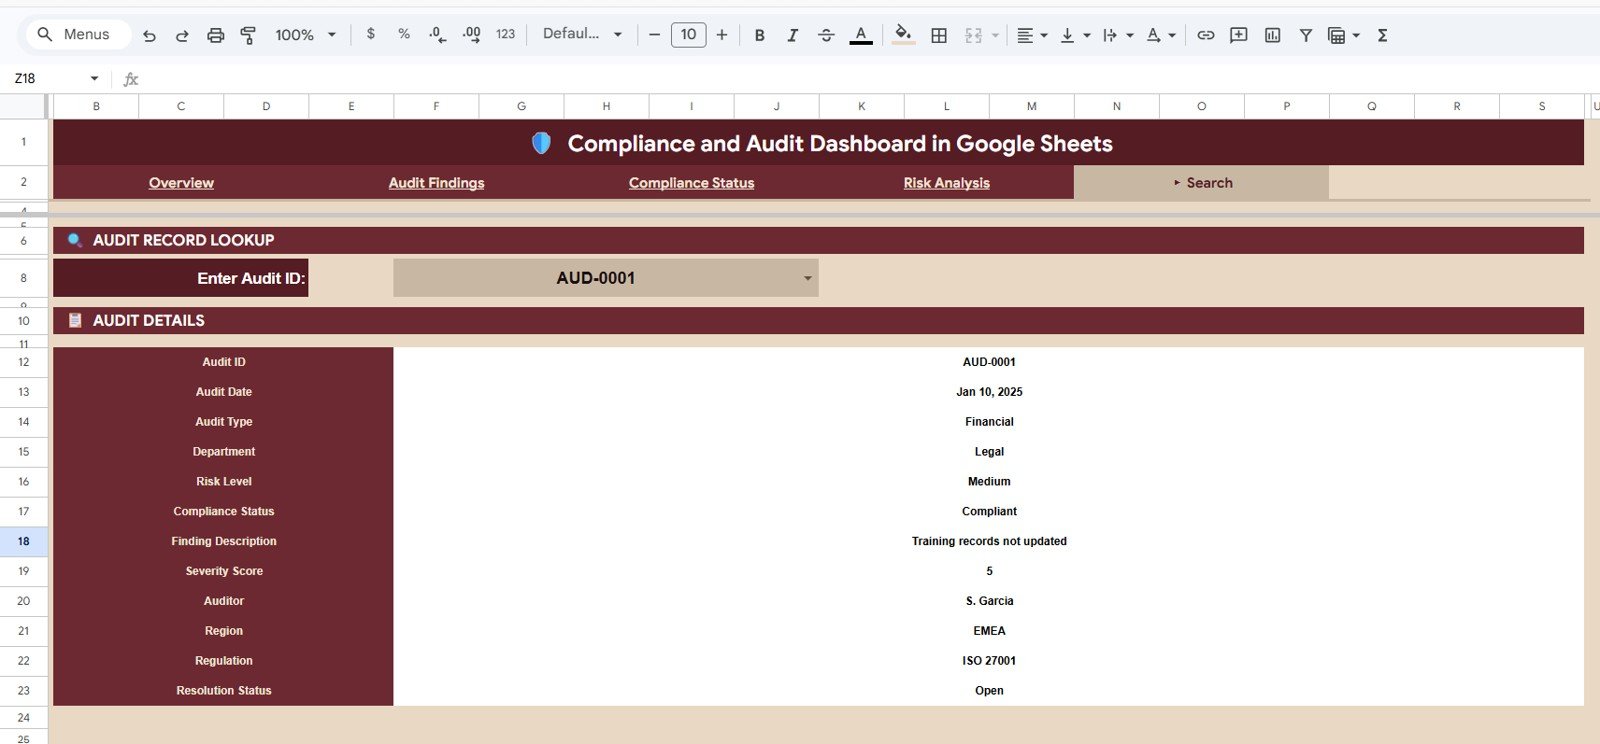
Page 5: Search Sheet — Audit Record Lookup
The Search sheet contains an Audit Record Lookup widget. Pick any Audit ID from the dropdown and the sheet instantly shows you all 12 fields for that record: Audit Date, Audit Type, Department, Risk Level, Compliance Status, Finding Description, Severity Score, Auditor, Region, Regulation, and Resolution Status. This avoids the usual VLOOKUP gymnastics on the raw data sheet whenever someone asks “what’s the status of audit A-1023?”.
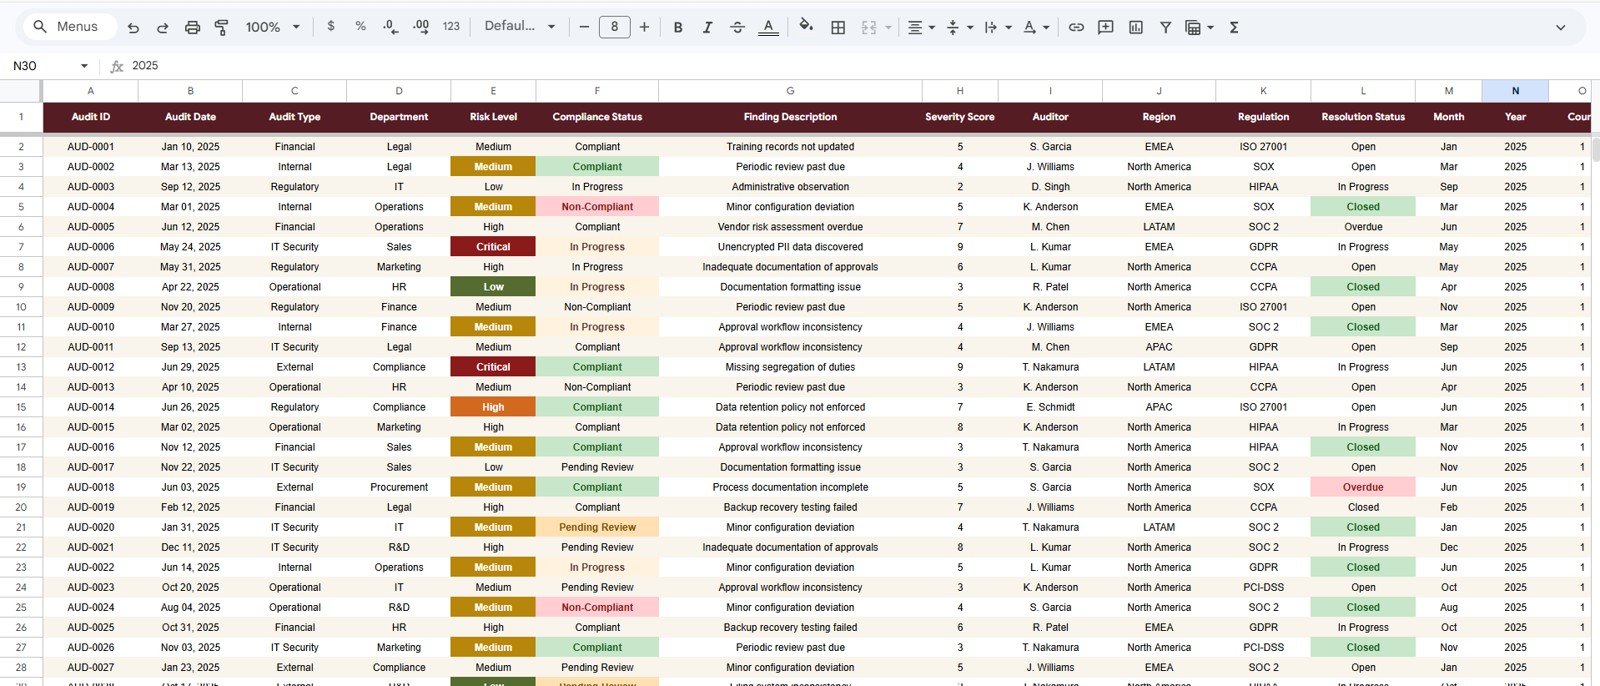
Page 6: Data Sheet
👉 Click here to Purchase the Compliance and Audit Dashboard in Google Sheets
The Data sheet is the source of truth — replace the sample audit records with your own, keep the column structure intact, and every other page recalculates automatically. The dashboard handles hundreds to a few thousand findings comfortably; beyond that, Sheets performance starts to degrade.
Compliance and Audit Dashboard in Google Sheets vs. Microsoft Excel vs. Paid GRC SaaS — Feature Comparison
| Feature | Compliance and Audit Dashboard in Google Sheets | Microsoft Excel Audit Dashboard | AuditBoard / LogicGate / MetricStream |
|---|---|---|---|
| Cost | $9.99 one-time | $15–25 one-time + Excel licence | $30,000–150,000 / year |
| Platform | Google Sheets (browser) | Microsoft Excel desktop | Proprietary cloud SaaS |
| Setup time | Under 10 minutes | 15–30 minutes | 3–6 months implementation |
| Real-time team collaboration | ✅ Native, multi-user editing | ❌ Co-authoring needs OneDrive/365 | ✅ |
| Mobile access | ✅ Free Sheets app | Limited on Excel mobile | ✅ |
| Customisable KPIs and charts | ✅ Full edit access | ✅ Full edit access | Limited, vendor-controlled |
| Share via link | ✅ One-click share | ❌ Manual file send | ✅ |
| Audit Record Lookup | ✅ Built-in search dropdown | Possible via VLOOKUP | ✅ |
| Year-1 cost at 5 users | $9.99 | $15–25 + 5× Excel licences | $30,000+ |
For audit and compliance teams that want a shareable, browser-based dashboard without paying enterprise GRC pricing, the Compliance and Audit Dashboard in Google Sheets sits in the sweet spot.
Who Should Use This Template
👉 Click here to Purchase the Compliance and Audit Dashboard in Google Sheets
Perfect for:
- Internal audit managers at 20–500 person companies running quarterly audit cycles
- Compliance officers tracking adherence to SOX, ISO 27001, GDPR, HIPAA, or industry regulations
- Risk managers preparing monthly risk reports for leadership and the audit committee
- Quality assurance leads in manufacturing, healthcare, or finance with recurring audit programs
- GRC consultants delivering audit and risk dashboards to multiple clients
Not a fit if:
- You’re an enterprise GRC team that needs SOC 2 Type II hosting, SSO, role-based field-level permissions, and signed audit trails
- You’re in a heavily regulated environment where every record change must be cryptographically locked (e.g. FDA 21 CFR Part 11)
- You’re tracking 100,000+ audit findings — Google Sheets performance degrades on very large datasets
Real-World Use Cases
Priya runs internal audit at a 180-person fintech. She used to maintain three separate spreadsheets — one for SOX testing, one for PCI-DSS, and one for internal control reviews — and rebuild the same monthly chart every cycle. Since switching to the Compliance and Audit Dashboard in Google Sheets, she runs all 60+ audits per quarter from one Data sheet, shares a single link with her three auditors, and projects the Compliance Status page directly to the audit committee. She estimates the change saves her three full days per quarter — and her audit committee actually looks at the dashboard now because it’s always up to date.
David is a Quality and Compliance lead at a mid-size medical device manufacturer. Every Monday morning he opens the Risk Analysis page on his phone before the executive standup. If Critical Risks or High Risks have moved overnight, he flags them in the meeting; if not, he moves on. The Audit Findings page is what he uses to chase auditors who have overdue findings — instead of digging through email threads, he just opens the page, sorts by Overdue, and sends three Slack messages. Total Mondays saved: every Monday.
Anika is a freelance GRC consultant. She delivers a copy of the dashboard to each new client at the start of an engagement, loads their existing audit history into the Data sheet, and walks them through the Overview, Compliance Status, and Risk Analysis pages on the kickoff call. Clients see results in week one instead of waiting for an enterprise GRC implementation; Anika gets to bill for analysis instead of platform configuration.
Advantages of the Compliance and Audit Dashboard in Google Sheets
👉 Click here to Purchase the Compliance and Audit Dashboard in Google Sheets
- One-time payment, no per-user fees — share the link with as many auditors, reviewers, and stakeholders as you like.
- Zero implementation overhead — paste your data, see your dashboard. No professional services engagement required.
- Full customisability — every formula, chart, slicer, and column is editable. Add your own KPIs using SUMIFS, COUNTIFS, and AVERAGEIFS.
- Works on any device — desktop, laptop, tablet, or phone with the free Google Sheets app.
- Aligns with common frameworks — the data structure cleanly supports SOX, ISO 27001, GDPR, HIPAA, PCI-DSS, NIST, and most internal control libraries.
Opportunities for Improvement
The Compliance and Audit Dashboard in Google Sheets is intentionally built around shared access in Google Workspace, which means a few things to be aware of: there’s no built-in user role separation beyond Sheets’ native permissions, no cryptographic audit log on cell changes, and at very large scale (10,000+ findings) chart refresh starts to feel sluggish. If you need SOC 2 hosting, signed audit trails, or per-user role-based field permissions, an enterprise GRC platform is still the right answer. For 95% of audit teams, this dashboard fits.
Best Practices
- Lock the Data sheet column headers — every formula on the dashboard pages depends on them. Use Sheets’ Protect range feature to prevent accidental edits.
- Use a controlled vocabulary for Audit Type, Risk Level, Regulation, Department, and Region. Mixing “Critical” and “critical” or “GDPR” and “G.D.P.R.” breaks every chart.
- Update the Data sheet weekly, not monthly — slicers and KPI cards are most valuable when the data is current.
- Pin the Audit Findings tab in your browser if you’re the audit manager — it’s the page you’ll open most.
- Review external authoritative references like the COSO ERM framework and the IIA International Standards for the Professional Practice of Internal Auditing to align your KPI definitions with established standards.
Explore Relevant Templates
- Also available as: Compliance and Audit Dashboard in Power BI — same KPIs and pages, built on DAX and Power Query.
- Insurance Policy Analytics Dashboard in Google Sheets — adjacent risk and policy analytics dashboard.
- Personalization Strategy KPI Dashboard in Google Sheets — for marketing and CX teams.
- SaaS Product Usage Dashboard in Google Sheets — for SaaS product and revenue analytics.
- Browse all Google Sheets Dashboards on NextGenTemplates.
Frequently Asked Questions
👉 Click here to Purchase the Compliance and Audit Dashboard in Google Sheets
What KPIs does the Compliance and Audit Dashboard in Google Sheets track?
The Compliance and Audit Dashboard in Google Sheets tracks 15+ KPIs including Total Audits, Open Findings, Critical Risk, Compliance Rate, Closed Rate, Overdue Findings, Average Severity, Compliant, Non-Compliant, Pending Review, Critical Risks, High Risks, and Max Severity — all auto-calculated from the Data sheet.
How long does setup take?
Setup of the Compliance and Audit Dashboard in Google Sheets takes under 10 minutes. After purchase, click the Google Sheets link in the PDF guide to copy the template to your Drive, paste your audit records into the Data sheet, and every page recalculates automatically — no scripts, formulas, or add-ons to configure.
How does this compare to AuditBoard or LogicGate?
AuditBoard, LogicGate, and MetricStream typically start at $30,000–$150,000 per year and require multi-month implementations. The Compliance and Audit Dashboard in Google Sheets gives you the core audit KPIs, compliance breakdown, and risk analysis views for a $9.99 one-time payment with no per-user fees.
Can I filter the dashboard by Department or Region?
Yes. Every page in the Compliance and Audit Dashboard in Google Sheets includes slicers at the top that filter every KPI card and chart on the page by Department, Region, Audit Type, Risk Level, Regulation, or Compliance Status. Filtering takes one click.
What fields does the Audit Record Lookup show?
The Audit Record Lookup on the Search sheet displays all 12 fields for any Audit ID you select — Audit Date, Audit Type, Department, Risk Level, Compliance Status, Finding Description, Severity Score, Auditor, Region, Regulation, and Resolution Status.
Is the template editable?
Yes. The Compliance and Audit Dashboard in Google Sheets is fully editable. You have full access to every formula, chart, and slicer, and you can add columns to the Data sheet or build additional KPI cards using SUMIFS, COUNTIFS, and AVERAGEIFS just like the existing ones.
Is the template available on other platforms?
Yes. The same Compliance and Audit Dashboard is also available in Power BI for teams that prefer Microsoft’s BI stack with DAX measures and Power Query refresh.
About the Author
Built by PK — Microsoft Certified Professional with 15+ years of Excel, Google Sheets, and Power BI experience. Founder of NextGenTemplates, reaching 300K+ subscribers across YouTube channels. Every template is hand-built and tested before release.
Conclusion
Internal audit, compliance, and risk teams don’t need a $50,000-a-year platform to track audits, findings, and regulatory status — they need a clear, shareable, customisable dashboard that updates the moment new data comes in. The Compliance and Audit Dashboard in Google Sheets gives you exactly that with 4 analysis pages, 15+ KPIs, 18 charts, and a one-click Audit Record Lookup.
👉 Click here to Purchase the Compliance and Audit Dashboard in Google Sheets
Instant download · One-time payment · No subscription
🎥 Visit Youtube.com/@NeoTechNavigators for video tutorials on Google Sheets dashboards, formulas, and Apps Script.
📅 Last updated: May 2026