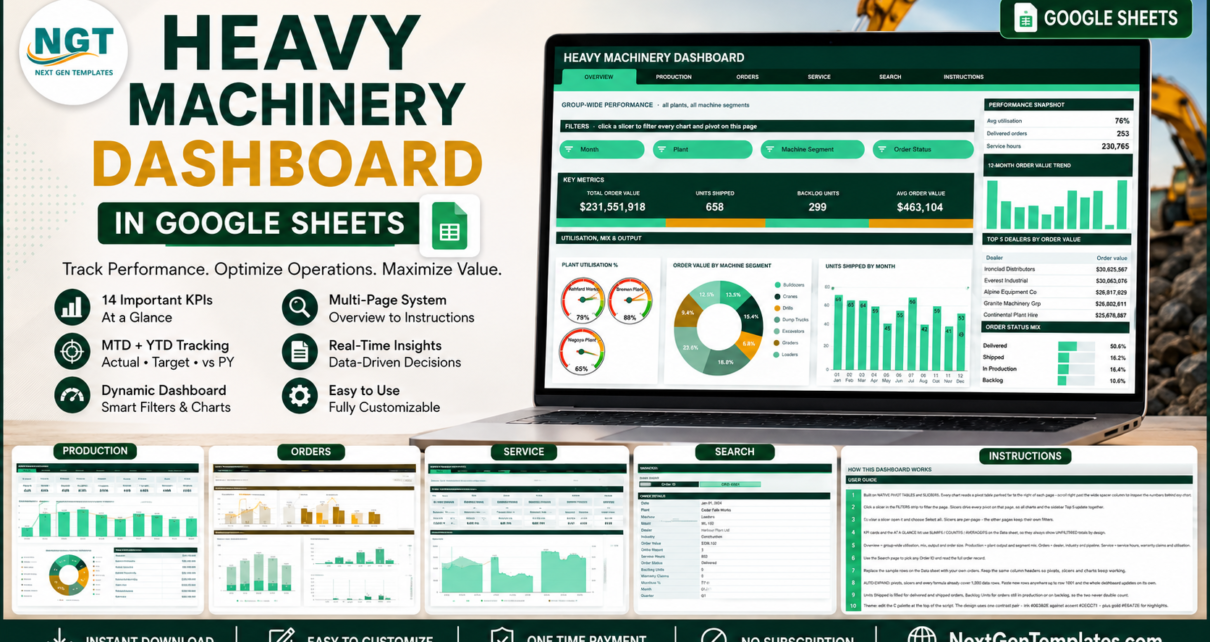
The Heavy Machinery Dashboard in Google Sheets tracks 16 KPI cards and 18 charts across 6 pages, driven by 15 native slicers over a 500-order book that auto-expands to 1,000 rows. Built on real pivot tables, it covers plant output, dealer orders, backlog and warranty service in one browser file.
Tag: manufacturing analytics
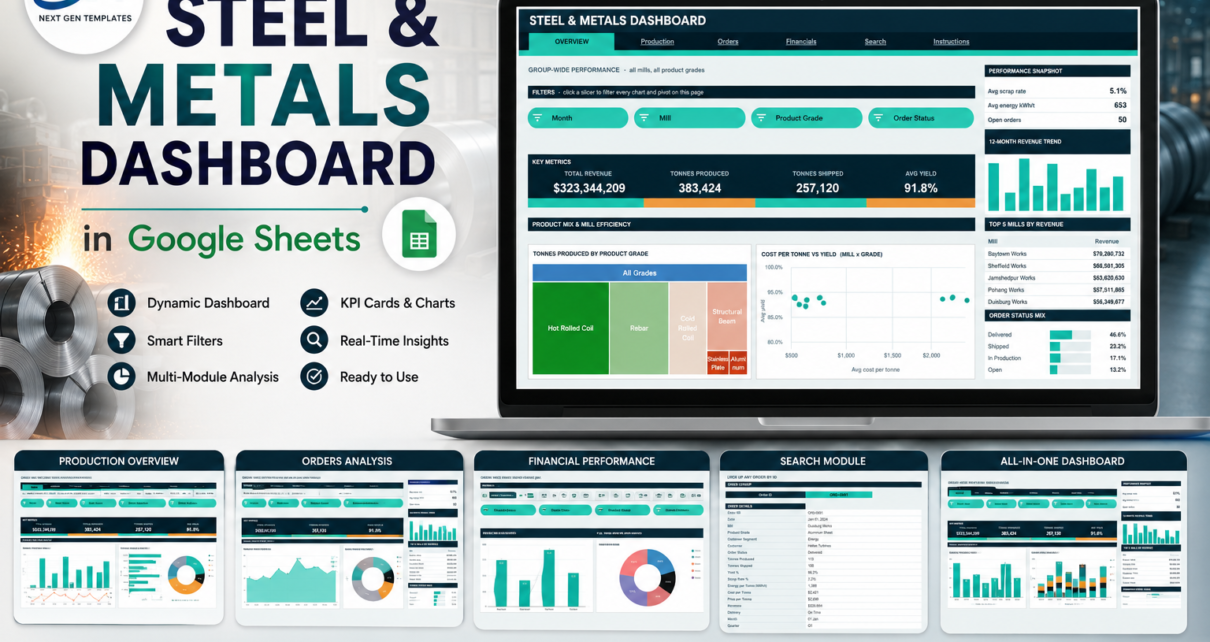
Steel & Metals Dashboard in Google Sheets
A six-page steel and metals mill dashboard built on native Google Sheets pivot tables and slicers: 16 KPI cards, 14 charts, 16 slicers and an order-level lookup, with 380 rows of demo data ready to be replaced with your own order log.
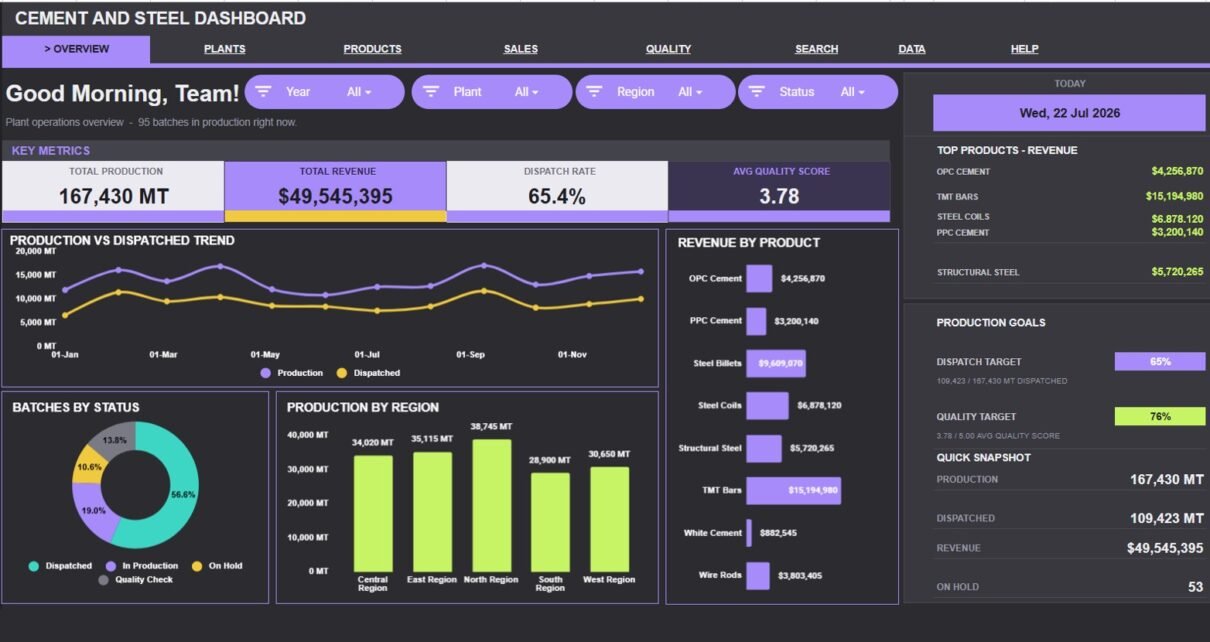
Cement and Steel Dashboard in Google Sheets
Review the Cement and Steel Dashboard in Google Sheets: seven tabs, four KPI cards, twenty chart views, slicers, Batch ID lookup, and editable data sheet for cement and steel teams.
Contract Manufacturing Dashboard in Google Sheets
A ready-to-use Contract Manufacturing Dashboard in Google Sheets that tracks order value, units produced, lead time, and defect units across 5 interactive pages with slicers and a Work Order search.
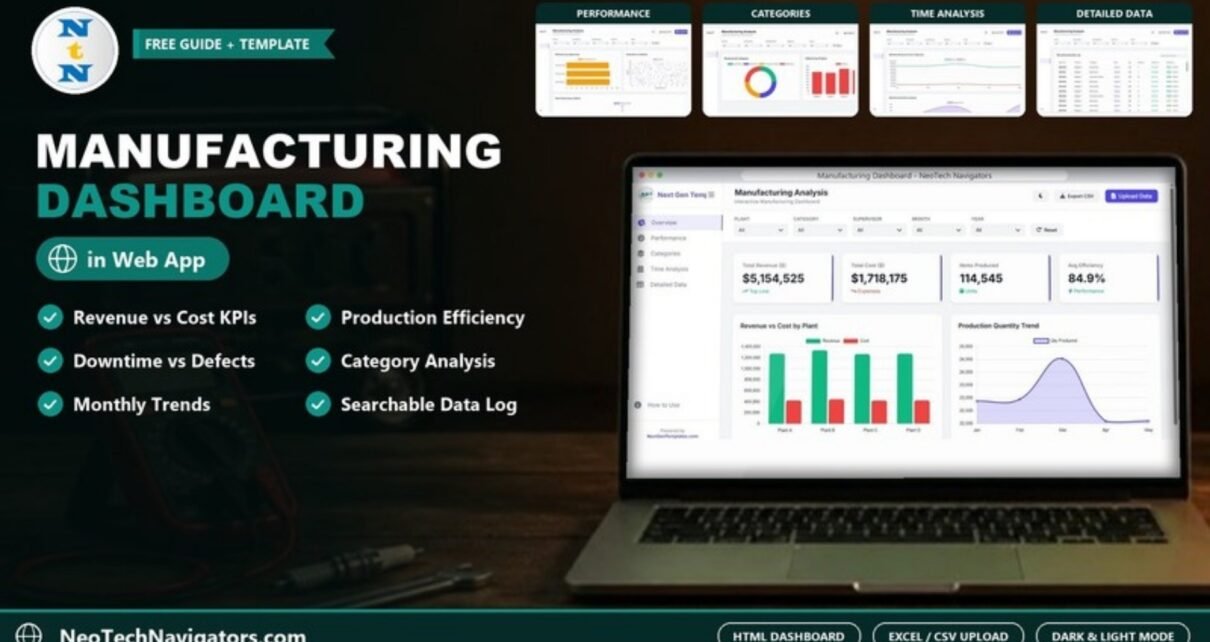
Manufacturing Dashboard in HTML
Manufacturing companies operate in a highly competitive environment where efficiency, cost control, and production performance determine success. However, many factories still rely on scattered spreadsheets, manual reports, and delayed data analysis. As a result, managers struggle to monitor production efficiency, control manufacturing costs, and identify performance issues in real time. That is exactly where a […]